Singapore Transport Packaging Market (2026-2032) | Revenue, Share, COVID-19 IMPACT, Value, Industry, Companies, Analysis, Forecast, Growth, Outlook, Size & Trends
Market Forecast By Material Type (Plastic, Polyethylene (PE), Polypropylene (PP), Polyethylene Terephthalate (PET), Paper & Paperboard, Metal, Wood, Others), By Packaging Types (Cartons, Wooden crates, Containers, Corrugated boxes, Barrels, IBCs, Strapping, Others), By End-users (Agriculture, Automotive, Building & Construction, Chemicals & Pharmaceuticals, Food & Beverages, Metallurgical, Electrical & Electronics, Others) And Competitive Landscape
| Product Code: ETC006647 | Publication Date: Jun 2023 | Product Type: Report | ||
| Publisher: 6Wresearch | Author: Ravi Bhandari | No. of Pages: 70 | No. of Figures: 35 | No. of Tables: 5 |
Singapore Transport Packaging Market Summary
The singapore transport packaging market was estimated at USD 185 Million in 2025 and is projected to reach USD 245 Million by 2032, growing at a CAGR of 4.8% from 2026 to 2032.
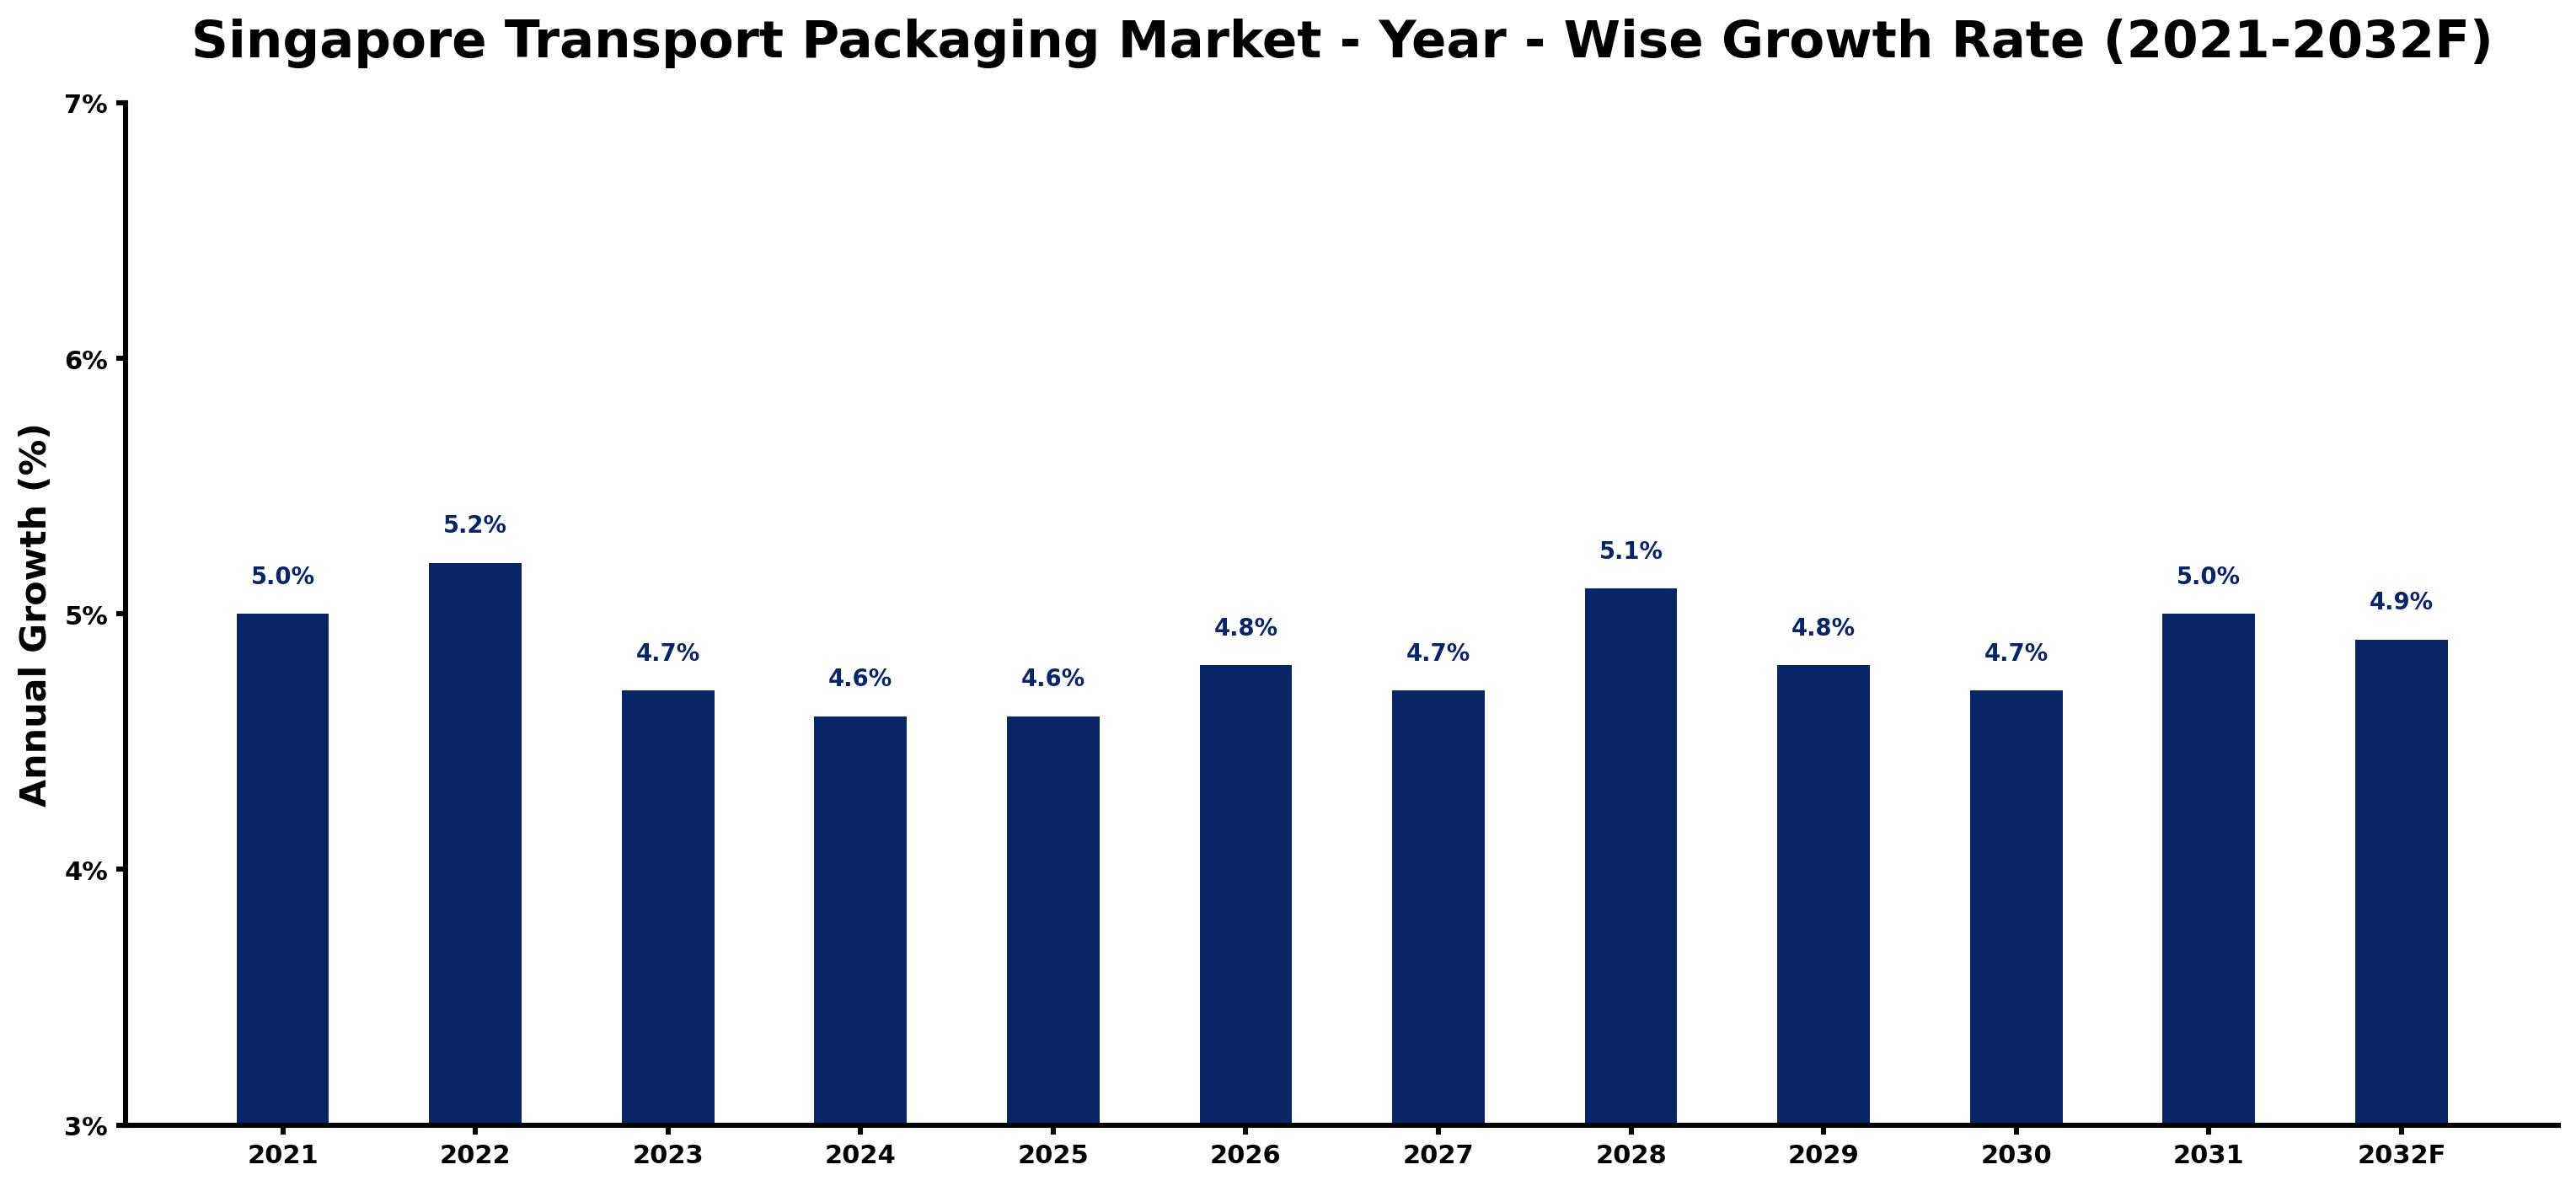
Singapore Transport Packaging Market Growth Rate Analysis (2021-2032)
The Singapore transport packaging market has exhibited stable growth, with a notable increase of 5.0% in 2021 and a rise to 5.2% in 2022, largely driven by expanding e-commerce and heightened consumer demand for efficient logistics solutions. However, growth moderated to 4.7% in 2023 as inflationary pressures and supply chain disruptions affected operational costs. A slight decline to 4.6% is anticipated in both 2024 and 2025 as companies navigate these challenges. In contrast, a rebound to 4.8% in 2026 reflects a resurgence in investments facilitated by digitalization and infrastructure improvements. As the market stabilizes, expected growth rates hover around 4.7% to 5.1% through 2032, highlighting continued resilience in this vital sector.
Singapore Transport Packaging Market Year-wise Growth Rate and Key Drivers
This graph highlights how the Singapore Transport Packaging Market has steadily grown over the past five years, supported by major growth factors.
The table below presents the year wise growth rates along with the key drivers influencing the market
| Year | Growth Rate | Major Drivers |
| 2021 | 5.0% | E-commerce expansion prompted urgent needs for reliable transport packaging solutions. |
| 2022 | 5.2% | Sustainable practices influenced packaging materials, favoring eco-friendly options significantly. |
| 2023 | 4.7% | Innovation in smart packaging technology enhanced supply chain efficiency and tracking. |
| 2024 | 4.6% | Further urbanization in Singapore necessitated adaptive packaging for metropolitan logistics. |
| 2025 | 4.6% | Rising consumer expectations for product safety pushed improvements in packaging durability. |
| 2026 | 4.8% | Global events highlighted vulnerabilities, increasing focus on resilient supply chain strategies. |
| 2027 | 4.7% | Emerging startups in logistics introduced disruptive packaging solutions to the market. |
| 2028 | 5.1% | The integration of AI in logistics reshaped how transport packaging is designed. |
| 2029 | 4.8% | Heightened environmental awareness among consumers influenced packaging material choices. |
| 2030 | 4.7% | Collaboration between companies and governments fostered innovation in packaging technologies. |
| 2031 | 5.0% | Robust online retail channels continued to elevate demand for efficient transport solutions. |
| 2032 | 4.9% | Increased competition among businesses pushed for cutting-edge, cost-effective packaging options. |
Note - Market size estimations and growth projections presented in this report are based on 6Wresearch's advanced forecasting approach, validated with industry datasets as of June 2026.
Singapore Transport Packaging Market Synopsis
The Singapore Transport Packaging Market is projected to reach 4.8% and witness significant growth during the forecast period (2026-2032). This industry is poised to benefit from various factors, including the rising demand for e-commerce coupled with an increase in transportation and logistics operations. As businesses evolve to meet the changing needs of consumers, the significance of effective transport packaging becomes increasingly prominent. The integration of technology in logistics, specifically automated sorting systems and RFID tagging, is also instrumental in enhancing operational efficiency, thereby propelling market growth.
Singapore Transport Packaging Market Growth Drivers
A number of key drivers are shaping the landscape of the Singapore transport packaging market.
- The robust growth of the e-commerce sector in Singapore is significantly escalating the demand for reliable transport packaging solutions. As online retail continues to thrive, businesses require efficient packaging to ensure the safe delivery of their products.
- Increased logistics activities, driven by urbanization and global trade demands, necessitate advanced transport packaging technologies. This rise in logistics activities is placing pressure on supply chains to operate more efficiently, thus enhancing the importance of quality packaging materials.
- Technological advancements, such as smart devices and automated systems, are streamlining logistics processes. These innovations improve handling, tracking, and delivery, which translates directly to the increasing appeal of sophisticated transport packaging solutions.
- Stringent regulations surrounding environmental sustainability are prompting companies to adopt eco-friendly packaging materials. The shift towards biodegradable and recyclable products resonates well with consumers and regulators alike, driving growth in the market.
- Government initiatives aimed at improving infrastructure are enhancing the overall efficiency of the transport packaging market. Investments in public transportation and logistics frameworks create a conducive environment for market expansion.
Singapore Transport Packaging Market Challenges and Restraints
Despite its positive growth trajectory, the Singapore transport packaging market faces certain challenges that could hinder its expansion.
- Rising raw material costs are a significant concern within the industry. The fluctuation in prices can affect profit margins and lead to increased product pricing, which may deter some businesses from investing in higher-quality packaging solutions.
- The rapid pace of technological change poses a challenge for some organizations that may struggle to keep pace with the latest innovations in transport packaging solutions.
- Compliance with complex and evolving regulatory standards can impose additional burdens on businesses. Companies must navigate various laws surrounding packaging, which can increase operational complexities and costs.
- Environmental sustainability expectations are continually rising, and businesses that fail to meet these demands may face reputational risks and potential penalties, impacting their market position.
- The reliance on global supply chains exposes the market to external risks, such as geopolitical tensions and economic instability, which can disrupt logistics and packaging operations.
Singapore Transport Packaging Market Government Investment and Initiatives
Government initiatives play a significant role in the growth of the Singapore transport packaging market. The government has been proactive in investing in infrastructure, enhancing logistics capabilities, and promoting sustainable practices within the packaging industry.
- In alignment with the “Smart Nation†initiative, the government is focusing on integrating digital technologies within logistics processes, which directly impacts the transport packaging sector.
- Funding for research and development projects related to sustainable packaging materials is being prioritized, aiming to encourage innovation and reduce environmental impact.
- Policies aimed at improving the efficiency of the supply chain logistics are being formulated, which will benefit the transport packaging market by ensuring timely distribution and reduced costs.
- The government is also advocating for public-private partnerships to encourage infrastructure development, which is crucial for improving transport efficiency and packaging delivery.
- Training and capability-building programs are being introduced to equip the workforce with necessary skills in logistics and packaging, ensuring the sector remains competitive and efficient.
Singapore Transport Packaging Market Latest Developments (May 2025 - June 2026)
Recent developments in the Singapore transport packaging market indicate a strong trend towards technological integration and sustainability. Innovations in automated sorting technologies are enhancing efficiency in logistics operations, leading to a heightened focus on transport packaging solutions that complement these advancements.
- Companies are increasingly exploring smart packaging options that utilize RFID and IoT technologies for real-time tracking, providing enhanced visibility throughout the supply chain.
- There is a marked shift towards sustainable packaging solutions, with many businesses now prioritizing the use of biodegradable materials in response to consumer demand for environmentally responsible options.
- Collaborations between logistics companies and technology providers have been initiated to develop more comprehensive packaging solutions that meet the evolving needs of the market.
- Public infrastructure projects have gained traction, with government investments directed toward improving port and transport facilities, further facilitating the growth of the transport packaging sector.
- The regulatory landscape continues to adapt, with new standards being discussed that emphasize sustainable practices in transport packaging, aiming to reduce waste and promote recycling.
Singapore Transport Packaging Market - Key Attractiveness of the Report
- 10 Years of Market Numbers
- Historical Data Starting from 2022 to 2025
- Base Year: 2025
- Forecast Data until 2032
- Key Performance Indicators Impacting the Market
- Major Upcoming Developments and Projects
Key Highlights of the Report:
- Singapore Transport Packaging Market Outlook
- Market Size of Singapore Transport Packaging Market, 2025
- Forecast of Singapore Transport Packaging Market, 2032F
- Historical Data and Forecast of Singapore Transport Packaging Revenues & Volume for the Period 2022-2032F
- Singapore Transport Packaging Market Trend Evolution
- Singapore Transport Packaging Market Drivers and Challenges
- Singapore Transport Packaging Price Trends
- Singapore Transport Packaging Porter's Five Forces
- Singapore Transport Packaging Industry Life Cycle
- Historical Data and Forecast of Singapore Transport Packaging Market Revenues & Volume By Material Type for the Period 2022-2032F
- Historical Data and Forecast of Singapore Transport Packaging Market Revenues & Volume By Plastic for the Period 2022-2032F
- Historical Data and Forecast of Singapore Transport Packaging Market Revenues & Volume By Polyethylene (PE) for the Period 2022-2032F
- Historical Data and Forecast of Singapore Transport Packaging Market Revenues & Volume By Polypropylene (PP) for the Period 2022-2032F
- Historical Data and Forecast of Singapore Transport Packaging Market Revenues & Volume By Polyethylene Terephthalate (PET) for the Period 2022-2032F
- Historical Data and Forecast of Singapore Transport Packaging Market Revenues & Volume By Paper & Paperboard for the Period 2022-2032F
- Historical Data and Forecast of Singapore Transport Packaging Market Revenues & Volume By Metal for the Period 2022-2032F
- Historical Data and Forecast of Singapore Transport Packaging Market Revenues & Volume By Wood for the Period 2022-2032F
- Historical Data and Forecast of Singapore Plastic Transport Packaging Market Revenues & Volume By Others for the Period 2022-2032F
- Historical Data and Forecast of Singapore Transport Packaging Market Revenues & Volume By Packaging Types for the Period 2022-2032F
- Historical Data and Forecast of Singapore Transport Packaging Market Revenues & Volume By Cartons for the Period 2022-2032F
- Historical Data and Forecast of Singapore Transport Packaging Market Revenues & Volume By Wooden crates for the Period 2022-2032F
- Historical Data and Forecast of Singapore Transport Packaging Market Revenues & Volume By Containers for the Period 2022-2032F
- Historical Data and Forecast of Singapore Transport Packaging Market Revenues & Volume By Corrugated boxes for the Period 2022-2032F
- Historical Data and Forecast of Singapore Transport Packaging Market Revenues & Volume By Barrels for the Period 2022-2032F
- Historical Data and Forecast of Singapore Transport Packaging Market Revenues & Volume By IBCs for the Period 2022-2032F
- Historical Data and Forecast of Singapore Transport Packaging Market Revenues & Volume By Strapping for the Period 2022-2032F
- Historical Data and Forecast of Singapore Transport Packaging Market Revenues & Volume By Others for the Period 2022-2032F
- Historical Data and Forecast of Singapore Transport Packaging Market Revenues & Volume By End-users for the Period 2022-2032F
- Historical Data and Forecast of Singapore Transport Packaging Market Revenues & Volume By Agriculture for the Period 2022-2032F
- Historical Data and Forecast of Singapore Transport Packaging Market Revenues & Volume By Automotive for the Period 2022-2032F
- Historical Data and Forecast of Singapore Transport Packaging Market Revenues & Volume By Building & Construction for the Period 2022-2032F
- Historical Data and Forecast of Singapore Transport Packaging Market Revenues & Volume By Chemicals & Pharmaceuticals for the Period 2022-2032F
- Historical Data and Forecast of Singapore Transport Packaging Market Revenues & Volume By Food & Beverages for the Period 2022-2032F
- Historical Data and Forecast of Singapore Transport Packaging Market Revenues & Volume By Metallurgical for the Period 2022-2032F
- Historical Data and Forecast of Singapore Transport Packaging Market Revenues & Volume By Electrical & Electronics for the Period 2022-2032F
- Historical Data and Forecast of Singapore Transport Packaging Market Revenues & Volume By Others for the Period 2022-2032F
- Singapore Transport Packaging Import Export Trade Statistics
- Market Opportunity Assessment By Material Type
- Market Opportunity Assessment By Packaging Types
- Market Opportunity Assessment By End-users
- Singapore Transport Packaging Top Companies Market Share
- Singapore Transport Packaging Competitive Benchmarking By Technical and Operational Parameters
- Singapore Transport Packaging Company Profiles
- Singapore Transport Packaging Key Strategic Recommendations
Frequently Asked Questions About the Market Study (FAQs):
The market is expected to grow at a CAGR of 4.8% during the forecast period from 2026 to 2032.
Key factors include the rise in e-commerce, increased logistics activities, and technological advancements in packaging solutions.
Yes, rising raw material costs and stringent regulatory requirements present significant challenges for market players.
The government is investing in infrastructure, promoting sustainable practices, and encouraging innovation through funding and partnership initiatives.
6Wresearch actively monitors the Singapore Transport Packaging Market and publishes its comprehensive annual report, highlighting emerging trends, growth drivers, revenue analysis, and forecast outlook. Our insights help businesses to make data-backed strategic decisions with ongoing market dynamics. Our analysts track relevent industries related to the Singapore Transport Packaging Market, allowing our clients with actionable intelligence and reliable forecasts tailored to emerging regional needs.
Yes, we provide customisation as per your requirements. To learn more, feel free to contact us on sales@6wresearch.com
1 Executive Summary |
2 Introduction |
2.1 Key Highlights of the Report |
2.2 Report Description |
2.3 Market Scope & Segmentation |
2.4 Research Methodology |
2.5 Assumptions |
3 Singapore Transport Packaging Market Overview |
3.1 Singapore Country Macro Economic Indicators |
3.2 Singapore Transport Packaging Market Revenues & Volume, 2022 & 2032F |
3.3 Singapore Transport Packaging Market - Industry Life Cycle |
3.4 Singapore Transport Packaging Market - Porter's Five Forces |
3.5 Singapore Transport Packaging Market Revenues & Volume Share, By Material Type, 2022 & 2032F |
3.6 Singapore Transport Packaging Market Revenues & Volume Share, By Packaging Types, 2022 & 2032F |
3.7 Singapore Transport Packaging Market Revenues & Volume Share, By End-users, 2022 & 2032F |
4 Singapore Transport Packaging Market Dynamics |
4.1 Impact Analysis |
4.2 Market Drivers |
4.3 Market Restraints |
5 Singapore Transport Packaging Market Trends |
6 Singapore Transport Packaging Market, By Types |
6.1 Singapore Transport Packaging Market, By Material Type |
6.1.1 Overview and Analysis |
6.1.2 Singapore Transport Packaging Market Revenues & Volume, By Material Type, 2022-2032F |
6.1.3 Singapore Transport Packaging Market Revenues & Volume, By Plastic, 2022-2032F |
6.1.4 Singapore Transport Packaging Market Revenues & Volume, By Polyethylene (PE), 2022-2032F |
6.1.5 Singapore Transport Packaging Market Revenues & Volume, By Polypropylene (PP), 2022-2032F |
6.1.6 Singapore Transport Packaging Market Revenues & Volume, By Polyethylene Terephthalate (PET), 2022-2032F |
6.1.7 Singapore Transport Packaging Market Revenues & Volume, By Paper & Paperboard, 2022-2032F |
6.1.8 Singapore Transport Packaging Market Revenues & Volume, By Metal, 2022-2032F |
6.1.9 Singapore Transport Packaging Market Revenues & Volume, By Others, 2022-2032F |
6.1.10 Singapore Transport Packaging Market Revenues & Volume, By Others, 2022-2032F |
6.2 Singapore Transport Packaging Market, By Packaging Types |
6.2.1 Overview and Analysis |
6.2.2 Singapore Transport Packaging Market Revenues & Volume, By Cartons, 2022-2032F |
6.2.3 Singapore Transport Packaging Market Revenues & Volume, By Wooden crates, 2022-2032F |
6.2.4 Singapore Transport Packaging Market Revenues & Volume, By Containers, 2022-2032F |
6.2.5 Singapore Transport Packaging Market Revenues & Volume, By Corrugated boxes, 2022-2032F |
6.2.6 Singapore Transport Packaging Market Revenues & Volume, By Barrels, 2022-2032F |
6.2.7 Singapore Transport Packaging Market Revenues & Volume, By IBCs, 2022-2032F |
6.2.8 Singapore Transport Packaging Market Revenues & Volume, By Others, 2022-2032F |
6.2.9 Singapore Transport Packaging Market Revenues & Volume, By Others, 2022-2032F |
6.3 Singapore Transport Packaging Market, By End-users |
6.3.1 Overview and Analysis |
6.3.2 Singapore Transport Packaging Market Revenues & Volume, By Agriculture, 2022-2032F |
6.3.3 Singapore Transport Packaging Market Revenues & Volume, By Automotive, 2022-2032F |
6.3.4 Singapore Transport Packaging Market Revenues & Volume, By Building & Construction, 2022-2032F |
6.3.5 Singapore Transport Packaging Market Revenues & Volume, By Chemicals & Pharmaceuticals, 2022-2032F |
6.3.6 Singapore Transport Packaging Market Revenues & Volume, By Food & Beverages, 2022-2032F |
6.3.7 Singapore Transport Packaging Market Revenues & Volume, By Metallurgical, 2022-2032F |
6.3.8 Singapore Transport Packaging Market Revenues & Volume, By Others, 2022-2032F |
6.3.9 Singapore Transport Packaging Market Revenues & Volume, By Others, 2022-2032F |
7 Singapore Transport Packaging Market Import-Export Trade Statistics |
7.1 Singapore Transport Packaging Market Export to Major Countries |
7.2 Singapore Transport Packaging Market Imports from Major Countries |
8 Singapore Transport Packaging Market Key Performance Indicators |
9 Singapore Transport Packaging Market - Opportunity Assessment |
9.1 Singapore Transport Packaging Market Opportunity Assessment, By Material Type, 2022 & 2032F |
9.2 Singapore Transport Packaging Market Opportunity Assessment, By Packaging Types, 2022 & 2032F |
9.3 Singapore Transport Packaging Market Opportunity Assessment, By End-users, 2022 & 2032F |
10 Singapore Transport Packaging Market - Competitive Landscape |
10.1 Singapore Transport Packaging Market Revenue Share, By Companies, 2025 |
10.2 Singapore Transport Packaging Market Competitive Benchmarking, By Operating and Technical Parameters |
11 Company Profiles |
12 Recommendations |
13 Disclaimer |
Global Go To Market Strategy - 2030
Export potential enables firms to identify high-growth global markets with greater confidence by combining advanced trade intelligence with a structured quantitative methodology. The framework analyzes emerging demand trends and country-level import patterns while integrating macroeconomic and trade datasets such as GDP and population forecasts, bilateral import–export flows, tariff structures, elasticity differentials between developed and developing economies, geographic distance, and import demand projections. Using weighted trade values from 2020–2024 as the base period to project country-to-country export potential for 2030, these inputs are operationalized through calculated drivers such as gravity model parameters, tariff impact factors, and projected GDP per-capita growth. Through an analysis of hidden potentials, demand hotspots, and market conditions that are most favorable to success, this method enables firms to focus on target countries, maximize returns, and global expansion with data, backed by accuracy.
By factoring in the projected importer demand gap that is currently unmet and could be potential opportunity, it identifies the potential for the Exporter (Country) among 190 countries, against the general trade analysis, which identifies the biggest importer or exporter.
To discover high-growth global markets and optimize your business strategy:
Click Here
Pricing
- Single User License$ 1,995
- Department License$ 2,400
- Site License$ 3,120
- Global License$ 3,795

Leadership Perspectives from Industry Events
Search
Thought Leadership and Analyst Meet


Our Clients
6WResearch In News
- India Air Conditioner Market Set for Strong Rebound in 2026 After Weather-Led Correction and GST-Driven Recovery: 6Wresearch
- ADAS in India: How Automatic Emergency Braking, Blind Spot Detection & Driver Monitoring are Transforming Road Safety
- Doha a strategic location for EV manufacturing hub: IPA Qatar
- Demand for luxury TVs surging in the GCC, says Samsung
- Empowering Growth: The Thriving Journey of Bangladesh’s Cable Industry
- Demand for luxury TVs surging in the GCC, says Samsung
Latest Reports
- Nicaragua RPG Gaming Market (2026-2032)
- New Zealand RPG Gaming Market (2026-2032)
- Netherlands RPG Gaming Market (2026-2032)
- Nauru RPG Gaming Market (2026-2032)
- Namibia RPG Gaming Market (2026-2032)
- Mozambique RPG Gaming Market (2026-2032)
- Montenegro RPG Gaming Market (2026-2032)
- Mongolia RPG Gaming Market (2026-2032)
- Monaco RPG Gaming Market (2026-2032)
- Micronesia RPG Gaming Market (2026-2032)
Industry Events and Analyst Meet

HIMTEX 2026

India Refining Summit 2026

India EV Show 2026

EV tech India Expo 2026

Auto Tech Asia 2026
Whitepaper
- Middle East & Africa Commercial Security Market Click here to view more.
- Middle East & Africa Fire Safety Systems & Equipment Market Click here to view more.
- GCC Drone Market Click here to view more.
- Middle East Lighting Fixture Market Click here to view more.
- GCC Physical & Perimeter Security Market Click here to view more.