Slovakia Soup Market (2026-2032) | Size & Revenue, Segmentation, Analysis, Value, Share, Outlook, Industry, Growth, Trends, Forecast, Companies, Competitive Landscape
Market Forecast By Category (Vegetarian Soup, Non-Vegetarian Soup), By Type (Dehydrated, Instant, Canned/Preserved, Chilled, Frozen, UHT, Others), By Packaging (Canned, Pouch, Other), By Distribution Channels (Supermarket/Hypermarkets, Convenience Stores, Online Retail Stores, Others) And Competitive Landscape
| Product Code: ETC9306327 | Publication Date: Sep 2024 | Updated Date: Apr 2026 | Product Type: Market Research Report | |
| Publisher: 6Wresearch | Author: Summon Dutta | No. of Pages: 75 | No. of Figures: 35 | No. of Tables: 20 |
Slovakia Soup Market Size (2020-2030)
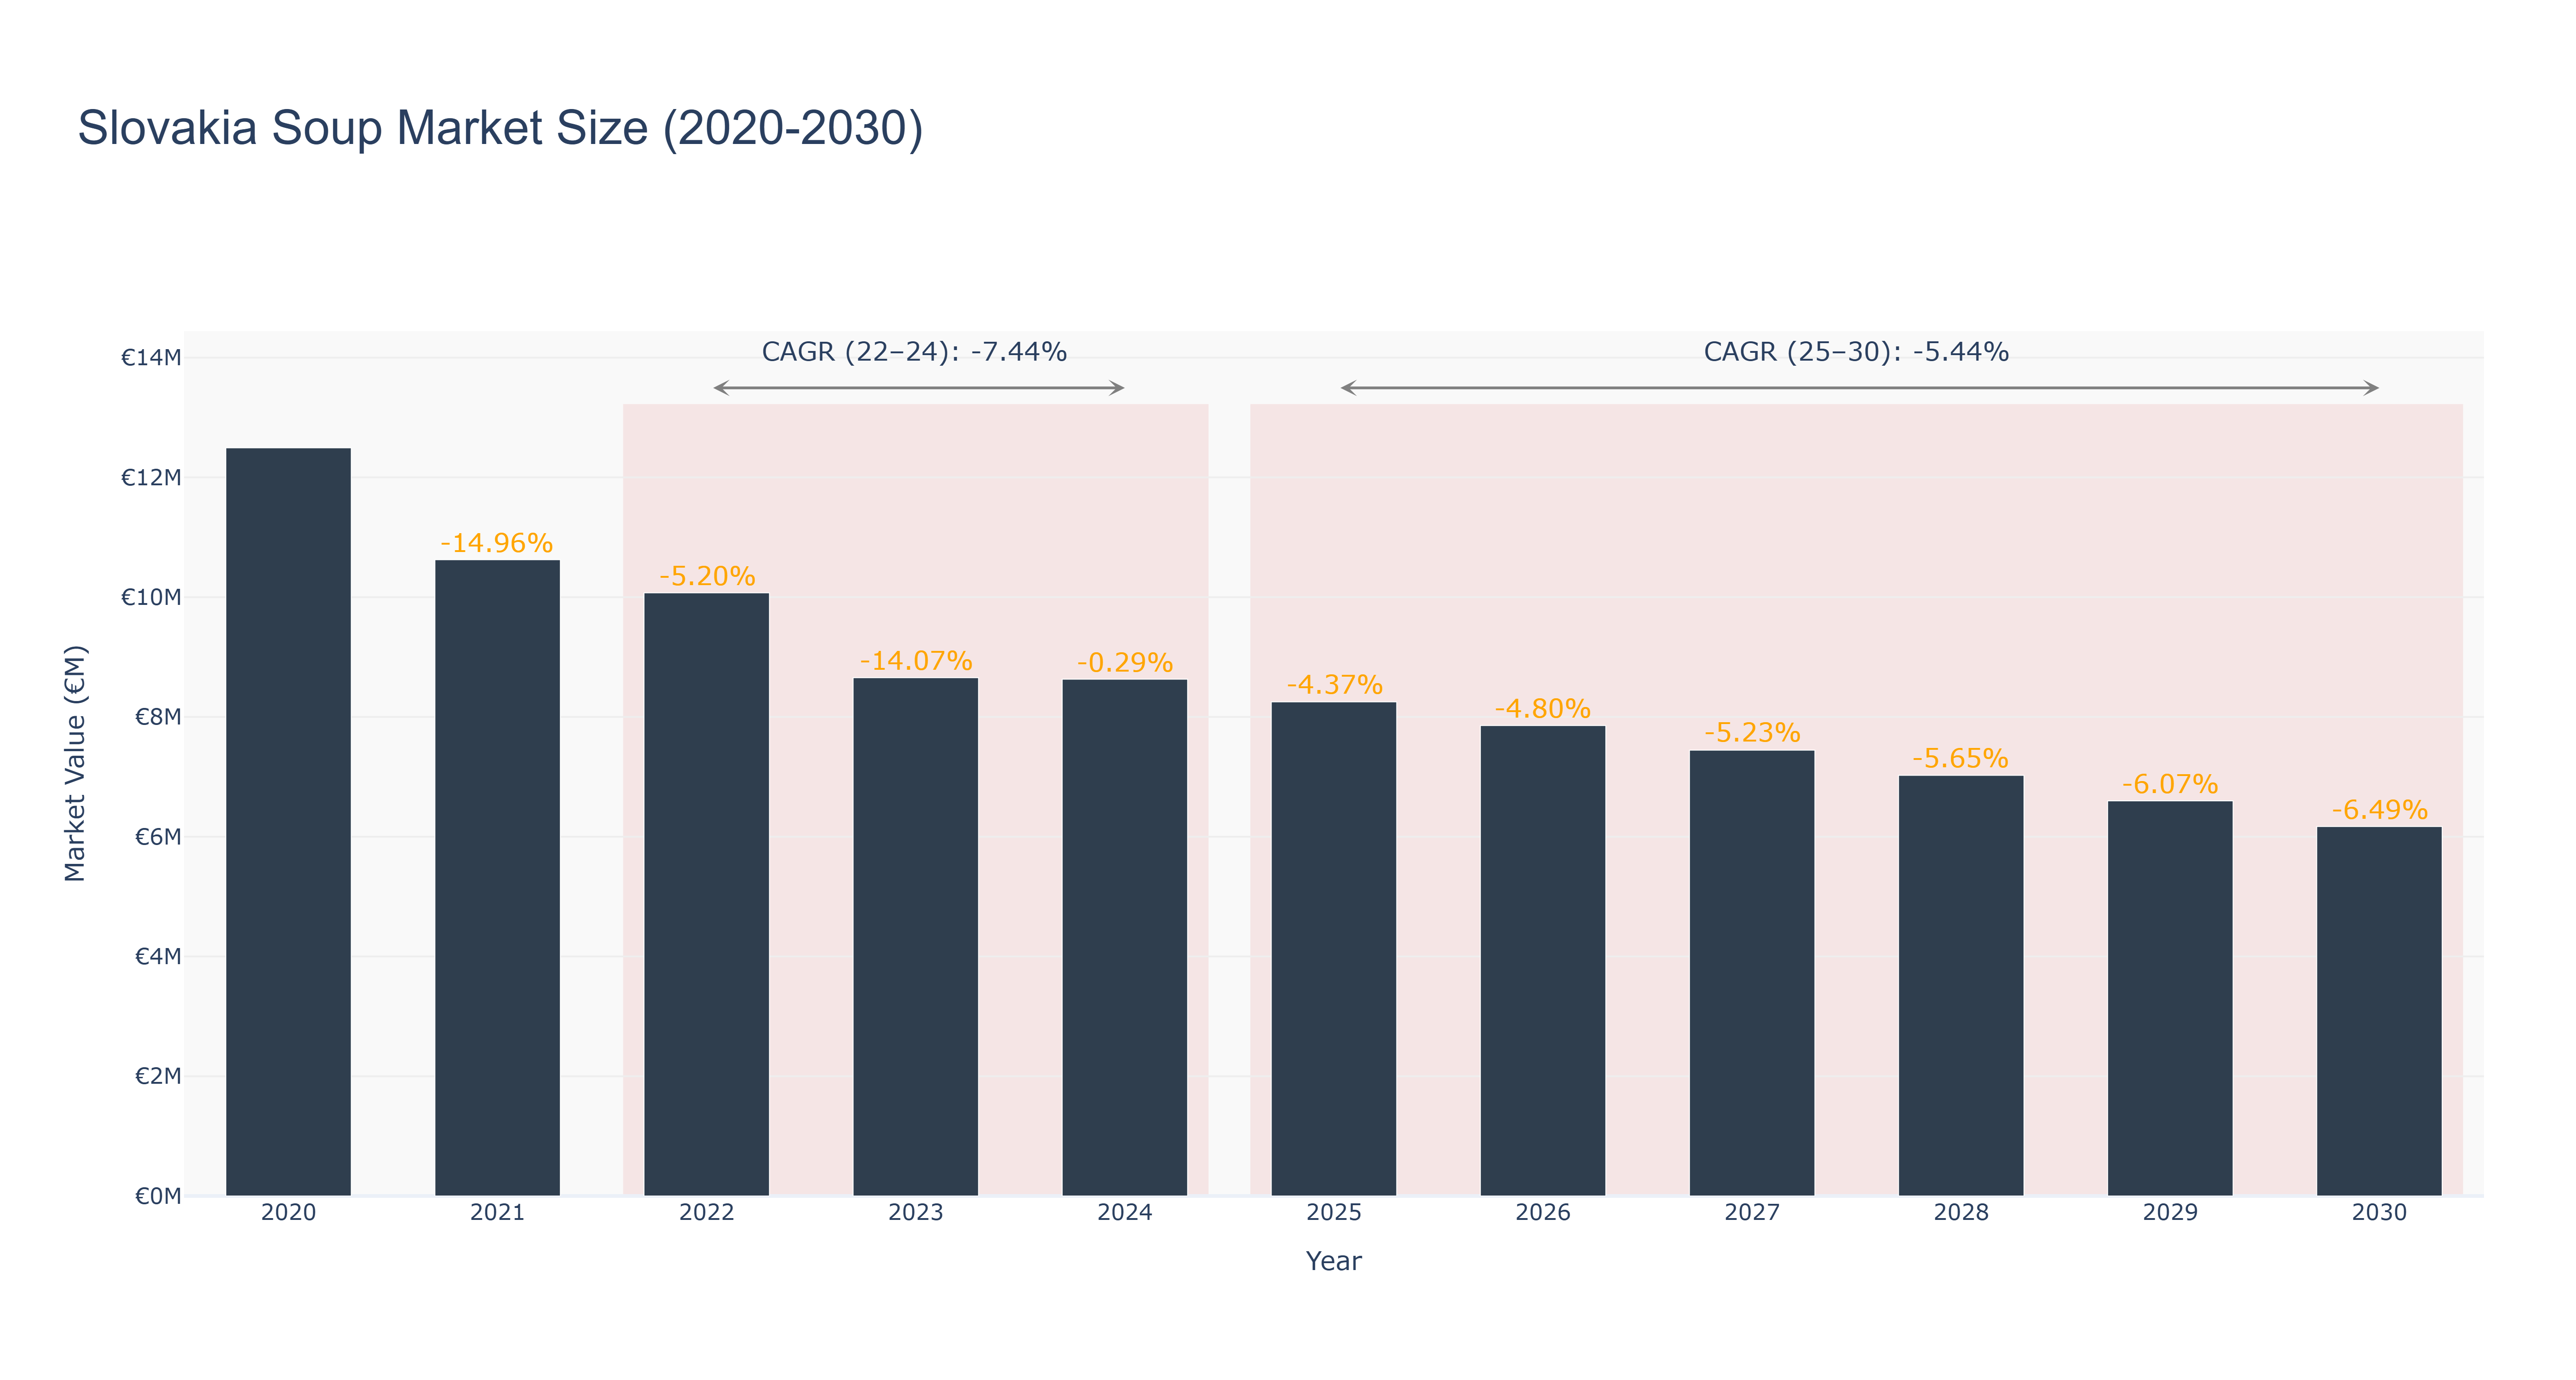
The Slovakia Soup Market experienced its peak market size in 2020, valued at €12.49 million, but has since faced a significant decline, with actual market sizes of €10.07 million in 2022 and €8.63 million in 2024, reflecting a CAGR of -7.44% during this period. The downturn can be attributed to evolving consumer preferences toward healthier and more convenient food options, along with increasing competition from alternative meal solutions. Looking ahead, the forecasted market size is projected to decrease further, with estimated values dropping to €6.17 million by 2030, indicating a CAGR of -5.44%. This decline may be exacerbated by ongoing economic pressures and shifting dietary trends. While no specific projects are highlighted for revitalization, industry stakeholders will need to adapt to changing consumer demands and explore innovative product offerings to mitigate further losses in this shrinking market.
Slovakia Soup Market: Production & Trade Performance (2019-2025)
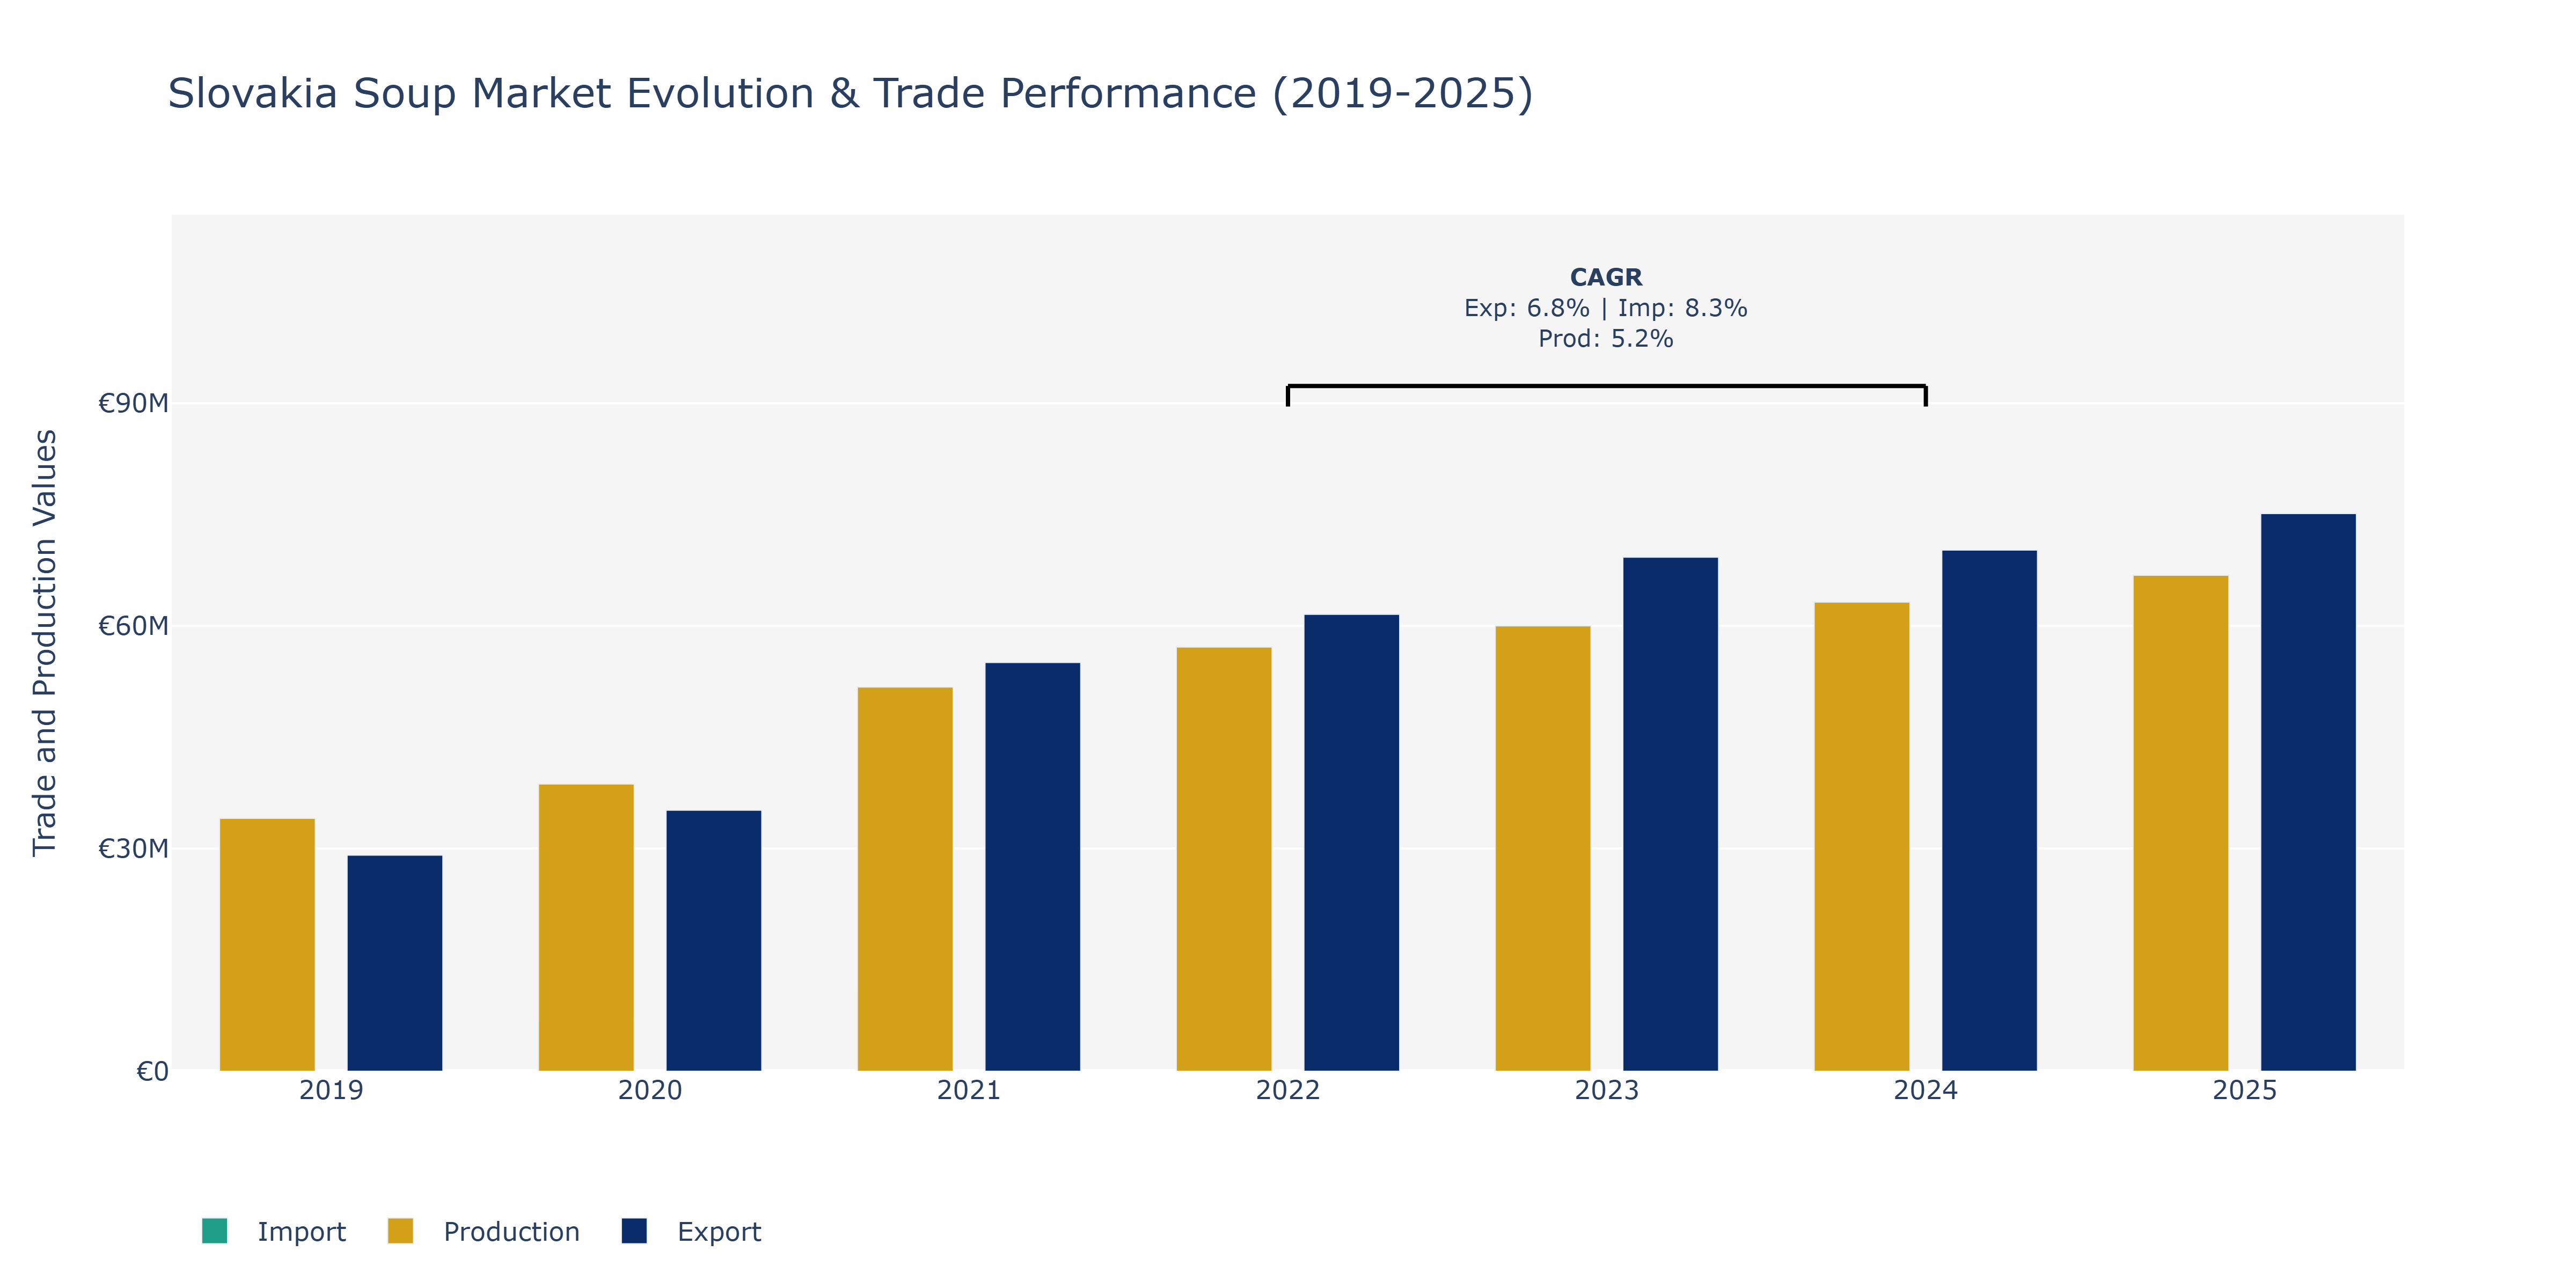
Between 2019 and 2025, Slovakia's Soup Market saw notable shifts in exports, imports, and production. Exports surged from €29.12 million in 2019 to €75.14 million in 2025, showcasing a consistent upward trajectory each year. This growth can be attributed to increasing global demand for Slovakian soup products, possibly due to the country's reputation for high-quality ingredients and traditional recipes. Imports followed a similar pattern, rising from €7.14 million in 2019 to €15.63 million in 2025, indicating a parallel increase in foreign soup varieties entering the Slovakian market. Production value also saw steady growth, climbing from €34.05 million in 2019 to €66.82 million in 2025. This rise in production aligns with the growing trend of consumers preferring convenient and healthy food options, with soup being a popular choice due to its convenience and nutritional value. The consistent expansion across all metrics underscores Slovakia's position as a significant player in the global soup market, with the potential for further growth driven by consumer preferences and innovative product offerings.
Key Highlights of the Report:
- Slovakia Soup Market Outlook
- Market Size of Slovakia Soup Market, 2025
- Forecast of Slovakia Soup Market, 2032
- Historical Data and Forecast of Slovakia Soup Revenues & Volume for the Period 2022 - 2032
- Slovakia Soup Market Trend Evolution
- Slovakia Soup Market Drivers and Challenges
- Slovakia Soup Price Trends
- Slovakia Soup Porter's Five Forces
- Slovakia Soup Industry Life Cycle
- Historical Data and Forecast of Slovakia Soup Market Revenues & Volume By Category for the Period 2022 - 2032
- Historical Data and Forecast of Slovakia Soup Market Revenues & Volume By Vegetarian Soup for the Period 2022 - 2032
- Historical Data and Forecast of Slovakia Soup Market Revenues & Volume By Non-Vegetarian Soup for the Period 2022 - 2032
- Historical Data and Forecast of Slovakia Soup Market Revenues & Volume By Type for the Period 2022 - 2032
- Historical Data and Forecast of Slovakia Soup Market Revenues & Volume By Dehydrated for the Period 2022 - 2032
- Historical Data and Forecast of Slovakia Soup Market Revenues & Volume By Instant for the Period 2022 - 2032
- Historical Data and Forecast of Slovakia Soup Market Revenues & Volume By Canned/Preserved for the Period 2022 - 2032
- Historical Data and Forecast of Slovakia Soup Market Revenues & Volume By Chilled for the Period 2022 - 2032
- Historical Data and Forecast of Slovakia Soup Market Revenues & Volume By Frozen for the Period 2022 - 2032
- Historical Data and Forecast of Slovakia Soup Market Revenues & Volume By UHT for the Period 2022 - 2032
- Historical Data and Forecast of Slovakia Soup Market Revenues & Volume By Others for the Period 2022 - 2032
- Historical Data and Forecast of Slovakia Soup Market Revenues & Volume By Packaging for the Period 2022 - 2032
- Historical Data and Forecast of Slovakia Soup Market Revenues & Volume By Canned for the Period 2022 - 2032
- Historical Data and Forecast of Slovakia Soup Market Revenues & Volume By Pouch for the Period 2022 - 2032
- Historical Data and Forecast of Slovakia Soup Market Revenues & Volume By Other for the Period 2022 - 2032
- Historical Data and Forecast of Slovakia Soup Market Revenues & Volume By Distribution Channels for the Period 2022 - 2032
- Historical Data and Forecast of Slovakia Soup Market Revenues & Volume By Supermarket/Hypermarkets for the Period 2022 - 2032
- Historical Data and Forecast of Slovakia Soup Market Revenues & Volume By Convenience Stores for the Period 2022 - 2032
- Historical Data and Forecast of Slovakia Soup Market Revenues & Volume By Online Retail Stores for the Period 2022 - 2032
- Historical Data and Forecast of Slovakia Soup Market Revenues & Volume By Others for the Period 2022 - 2032
- Slovakia Soup Import Export Trade Statistics
- Market Opportunity Assessment By Category
- Market Opportunity Assessment By Type
- Market Opportunity Assessment By Packaging
- Market Opportunity Assessment By Distribution Channels
- Slovakia Soup Top Companies Market Share
- Slovakia Soup Competitive Benchmarking By Technical and Operational Parameters
- Slovakia Soup Company Profiles
- Slovakia Soup Key Strategic Recommendations
Frequently Asked Questions About the Market Study (FAQs):
6Wresearch actively monitors the Slovakia Soup Market and publishes its comprehensive annual report, highlighting emerging trends, growth drivers, revenue analysis, and forecast outlook. Our insights help businesses to make data-backed strategic decisions with ongoing market dynamics. Our analysts track relevent industries related to the Slovakia Soup Market, allowing our clients with actionable intelligence and reliable forecasts tailored to emerging regional needs.
Yes, we provide customisation as per your requirements. To learn more, feel free to contact us on sales@6wresearch.com
1 Executive Summary |
2 Introduction |
2.1 Key Highlights of the Report |
2.2 Report Description |
2.3 Market Scope & Segmentation |
2.4 Research Methodology |
2.5 Assumptions |
3 Slovakia Soup Market Overview |
3.1 Slovakia Country Macro Economic Indicators |
3.2 Slovakia Soup Market Revenues & Volume, 2022 & 2032F |
3.3 Slovakia Soup Market - Industry Life Cycle |
3.4 Slovakia Soup Market - Porter's Five Forces |
3.5 Slovakia Soup Market Revenues & Volume Share, By Category, 2022 & 2032F |
3.6 Slovakia Soup Market Revenues & Volume Share, By Type, 2022 & 2032F |
3.7 Slovakia Soup Market Revenues & Volume Share, By Packaging, 2022 & 2032F |
3.8 Slovakia Soup Market Revenues & Volume Share, By Distribution Channels, 2022 & 2032F |
4 Slovakia Soup Market Dynamics |
4.1 Impact Analysis |
4.2 Market Drivers |
4.2.1 Increasing health consciousness among consumers leading to a preference for nutritious and convenient meal options. |
4.2.2 Growing demand for organic and natural ingredients in soups due to rising awareness of sustainable and clean eating habits. |
4.2.3 Busy lifestyles and changing dietary preferences driving the demand for ready-to-eat and convenient soup products. |
4.3 Market Restraints |
4.3.1 Intense competition among soup manufacturers leading to pricing pressures and margin constraints. |
4.3.2 Fluctuating raw material costs impacting the overall production costs of soups. |
4.3.3 Regulatory challenges and compliance requirements affecting product innovation and market entry for new players. |
5 Slovakia Soup Market Trends |
6 Slovakia Soup Market, By Types |
6.1 Slovakia Soup Market, By Category |
6.1.1 Overview and Analysis |
6.1.2 Slovakia Soup Market Revenues & Volume, By Category, 2022 - 2032F |
6.1.3 Slovakia Soup Market Revenues & Volume, By Vegetarian Soup, 2022 - 2032F |
6.1.4 Slovakia Soup Market Revenues & Volume, By Non-Vegetarian Soup, 2022 - 2032F |
6.2 Slovakia Soup Market, By Type |
6.2.1 Overview and Analysis |
6.2.2 Slovakia Soup Market Revenues & Volume, By Dehydrated, 2022 - 2032F |
6.2.3 Slovakia Soup Market Revenues & Volume, By Instant, 2022 - 2032F |
6.2.4 Slovakia Soup Market Revenues & Volume, By Canned/Preserved, 2022 - 2032F |
6.2.5 Slovakia Soup Market Revenues & Volume, By Chilled, 2022 - 2032F |
6.2.6 Slovakia Soup Market Revenues & Volume, By Frozen, 2022 - 2032F |
6.2.7 Slovakia Soup Market Revenues & Volume, By UHT, 2022 - 2032F |
6.3 Slovakia Soup Market, By Packaging |
6.3.1 Overview and Analysis |
6.3.2 Slovakia Soup Market Revenues & Volume, By Canned, 2022 - 2032F |
6.3.3 Slovakia Soup Market Revenues & Volume, By Pouch, 2022 - 2032F |
6.3.4 Slovakia Soup Market Revenues & Volume, By Other, 2022 - 2032F |
6.4 Slovakia Soup Market, By Distribution Channels |
6.4.1 Overview and Analysis |
6.4.2 Slovakia Soup Market Revenues & Volume, By Supermarket/Hypermarkets, 2022 - 2032F |
6.4.3 Slovakia Soup Market Revenues & Volume, By Convenience Stores, 2022 - 2032F |
6.4.4 Slovakia Soup Market Revenues & Volume, By Online Retail Stores, 2022 - 2032F |
6.4.5 Slovakia Soup Market Revenues & Volume, By Others, 2022 - 2032F |
7 Slovakia Soup Market Import-Export Trade Statistics |
7.1 Slovakia Soup Market Export to Major Countries |
7.2 Slovakia Soup Market Imports from Major Countries |
8 Slovakia Soup Market Key Performance Indicators |
8.1 Consumer engagement on social media platforms for soup brands. |
8.2 Number of new product launches in the Slovakia soup market. |
8.3 Consumer satisfaction scores and feedback on taste, quality, and packaging of soup products. |
8.4 Sustainability metrics such as packaging materials used and waste reduction initiatives by soup manufacturers. |
8.5 Health and wellness trends influencing soup consumption patterns in Slovakia. |
9 Slovakia Soup Market - Opportunity Assessment |
9.1 Slovakia Soup Market Opportunity Assessment, By Category, 2022 & 2032F |
9.2 Slovakia Soup Market Opportunity Assessment, By Type, 2022 & 2032F |
9.3 Slovakia Soup Market Opportunity Assessment, By Packaging, 2022 & 2032F |
9.4 Slovakia Soup Market Opportunity Assessment, By Distribution Channels, 2022 & 2032F |
10 Slovakia Soup Market - Competitive Landscape |
10.1 Slovakia Soup Market Revenue Share, By Companies, 2025 |
10.2 Slovakia Soup Market Competitive Benchmarking, By Operating and Technical Parameters |
11 Company Profiles |
12 Recommendations |
13 Disclaimer |
Export potential assessment - trade Analytics for 2030
Export potential enables firms to identify high-growth global markets with greater confidence by combining advanced trade intelligence with a structured quantitative methodology. The framework analyzes emerging demand trends and country-level import patterns while integrating macroeconomic and trade datasets such as GDP and population forecasts, bilateral import–export flows, tariff structures, elasticity differentials between developed and developing economies, geographic distance, and import demand projections. Using weighted trade values from 2020–2024 as the base period to project country-to-country export potential for 2030, these inputs are operationalized through calculated drivers such as gravity model parameters, tariff impact factors, and projected GDP per-capita growth. Through an analysis of hidden potentials, demand hotspots, and market conditions that are most favorable to success, this method enables firms to focus on target countries, maximize returns, and global expansion with data, backed by accuracy.
By factoring in the projected importer demand gap that is currently unmet and could be potential opportunity, it identifies the potential for the Exporter (Country) among 190 countries, against the general trade analysis, which identifies the biggest importer or exporter.
To discover high-growth global markets and optimize your business strategy:
Click Here
Pricing
- Single User License$ 1,995
- Department License$ 2,400
- Site License$ 3,120
- Global License$ 3,795

Search
Thought Leadership and Analyst Meet


Our Clients
Latest Reports
- Philippines Polyhydroxybutyrate-co-Hydroxyvalerate Market (2026-2032) | Trends, Insights, Challenges, Restraints, Competition, Size, Value, Forecast, Pricing, Share, Outlook, Revenue, Investment Opportunities, Strategy, Drivers, Demand, Growth, segmentation, Analysis, Companies
- Peru Polyhydroxybutyrate-co-Hydroxyvalerate Market (2026-2032) | Growth, Demand, Challenges, Share, Trends, Analysis, Pricing, Investment Opportunities, Drivers, Value, Forecast, Competition, Size, Companies, Insights, Outlook, Restraints, segmentation, Revenue, Strategy
- Pakistan Polyhydroxybutyrate-co-Hydroxyvalerate Market (2026-2032) | Restraints, segmentation, Pricing, Forecast, Share, Strategy, Competition, Trends, Insights, Drivers, Challenges, Growth, Revenue, Outlook, Value, Investment Opportunities, Companies, Size, Analysis, Demand
- Oman Polyhydroxybutyrate-co-Hydroxyvalerate Market (2026-2032) | Drivers, segmentation, Insights, Competition, Pricing, Outlook, Size, Revenue, Challenges, Forecast, Analysis, Growth, Value, Share, Trends, Investment Opportunities, Strategy, Restraints, Companies, Demand
- Nigeria Polyhydroxybutyrate-co-Hydroxyvalerate Market (2026-2032) | Value, Investment Opportunities, Analysis, Revenue, Restraints, Pricing, Outlook, Competition, Demand, Growth, Forecast, Companies, Trends, Challenges, segmentation, Drivers, Insights, Share, Size, Strategy
- Nepal Polyhydroxybutyrate-co-Hydroxyvalerate Market (2026-2032) | Insights, Analysis, Drivers, Share, Revenue, Demand, segmentation, Investment Opportunities, Competition, Forecast, Growth, Pricing, Companies, Strategy, Trends, Restraints, Challenges, Outlook, Size, Value
- Myanmar Polyhydroxybutyrate-co-Hydroxyvalerate Market (2026-2032) | Outlook, Revenue, Strategy, Restraints, Drivers, segmentation, Share, Forecast, Competition, Insights, Growth, Pricing, Size, Demand, Value, Companies, Trends, Challenges, Investment Opportunities, Analysis
- Morocco Polyhydroxybutyrate-co-Hydroxyvalerate Market (2026-2032) | Outlook, Investment Opportunities, Restraints, Strategy, Forecast, Challenges, Drivers, Growth, Companies, segmentation, Trends, Size, Competition, Revenue, Demand, Insights, Share, Analysis, Value, Pricing
- Mexico Polyhydroxybutyrate-co-Hydroxyvalerate Market (2026-2032) | Size, Drivers, Outlook, Share, Strategy, Growth, Pricing, Challenges, Companies, Demand, Value, Investment Opportunities, Restraints, Trends, Forecast, segmentation, Analysis, Insights, Competition, Revenue
- Malaysia Polyhydroxybutyrate-co-Hydroxyvalerate Market (2026-2032) | Share, segmentation, Size, Companies, Analysis, Insights, Forecast, Value, Revenue, Drivers, Restraints, Challenges, Investment Opportunities, Trends, Competition, Strategy, Demand, Growth, Outlook, Pricing
Industry Events and Analyst Meet

HIMTEX 2026

India Refining Summit 2026

India EV Show 2026

EV tech India Expo 2026

Auto Tech Asia 2026
Whitepaper
- Middle East & Africa Commercial Security Market Click here to view more.
- Middle East & Africa Fire Safety Systems & Equipment Market Click here to view more.
- GCC Drone Market Click here to view more.
- Middle East Lighting Fixture Market Click here to view more.
- GCC Physical & Perimeter Security Market Click here to view more.
6WResearch In News
- Doha a strategic location for EV manufacturing hub: IPA Qatar
- Demand for luxury TVs surging in the GCC, says Samsung
- Empowering Growth: The Thriving Journey of Bangladesh’s Cable Industry
- Demand for luxury TVs surging in the GCC, says Samsung
- Video call with a traditional healer? Once unthinkable, it’s now common in South Africa
- Intelligent Buildings To Smooth GCC’s Path To Net Zero