Slovenia Action Figures Market (2026-2032) | Value, Segmentation, Competitive Landscape, Analysis, Size & Revenue, Outlook, Growth, Industry, Trends, Forecast, Companies, Share
Market Forecast By Type (Superheroes, Anime Characters, Movie Characters), By Distribution Channel (Online, Offline), By End Users (Up to 8 years, 9-15 years, 15 years and Above) And Competitive Landscape
| Product Code: ETC9309612 | Publication Date: Sep 2024 | Updated Date: Apr 2026 | Product Type: Market Research Report | |
| Publisher: 6Wresearch | Author: Sumit Sagar | No. of Pages: 75 | No. of Figures: 35 | No. of Tables: 20 |
Slovenia Action Figures Market Size (2020-2030)
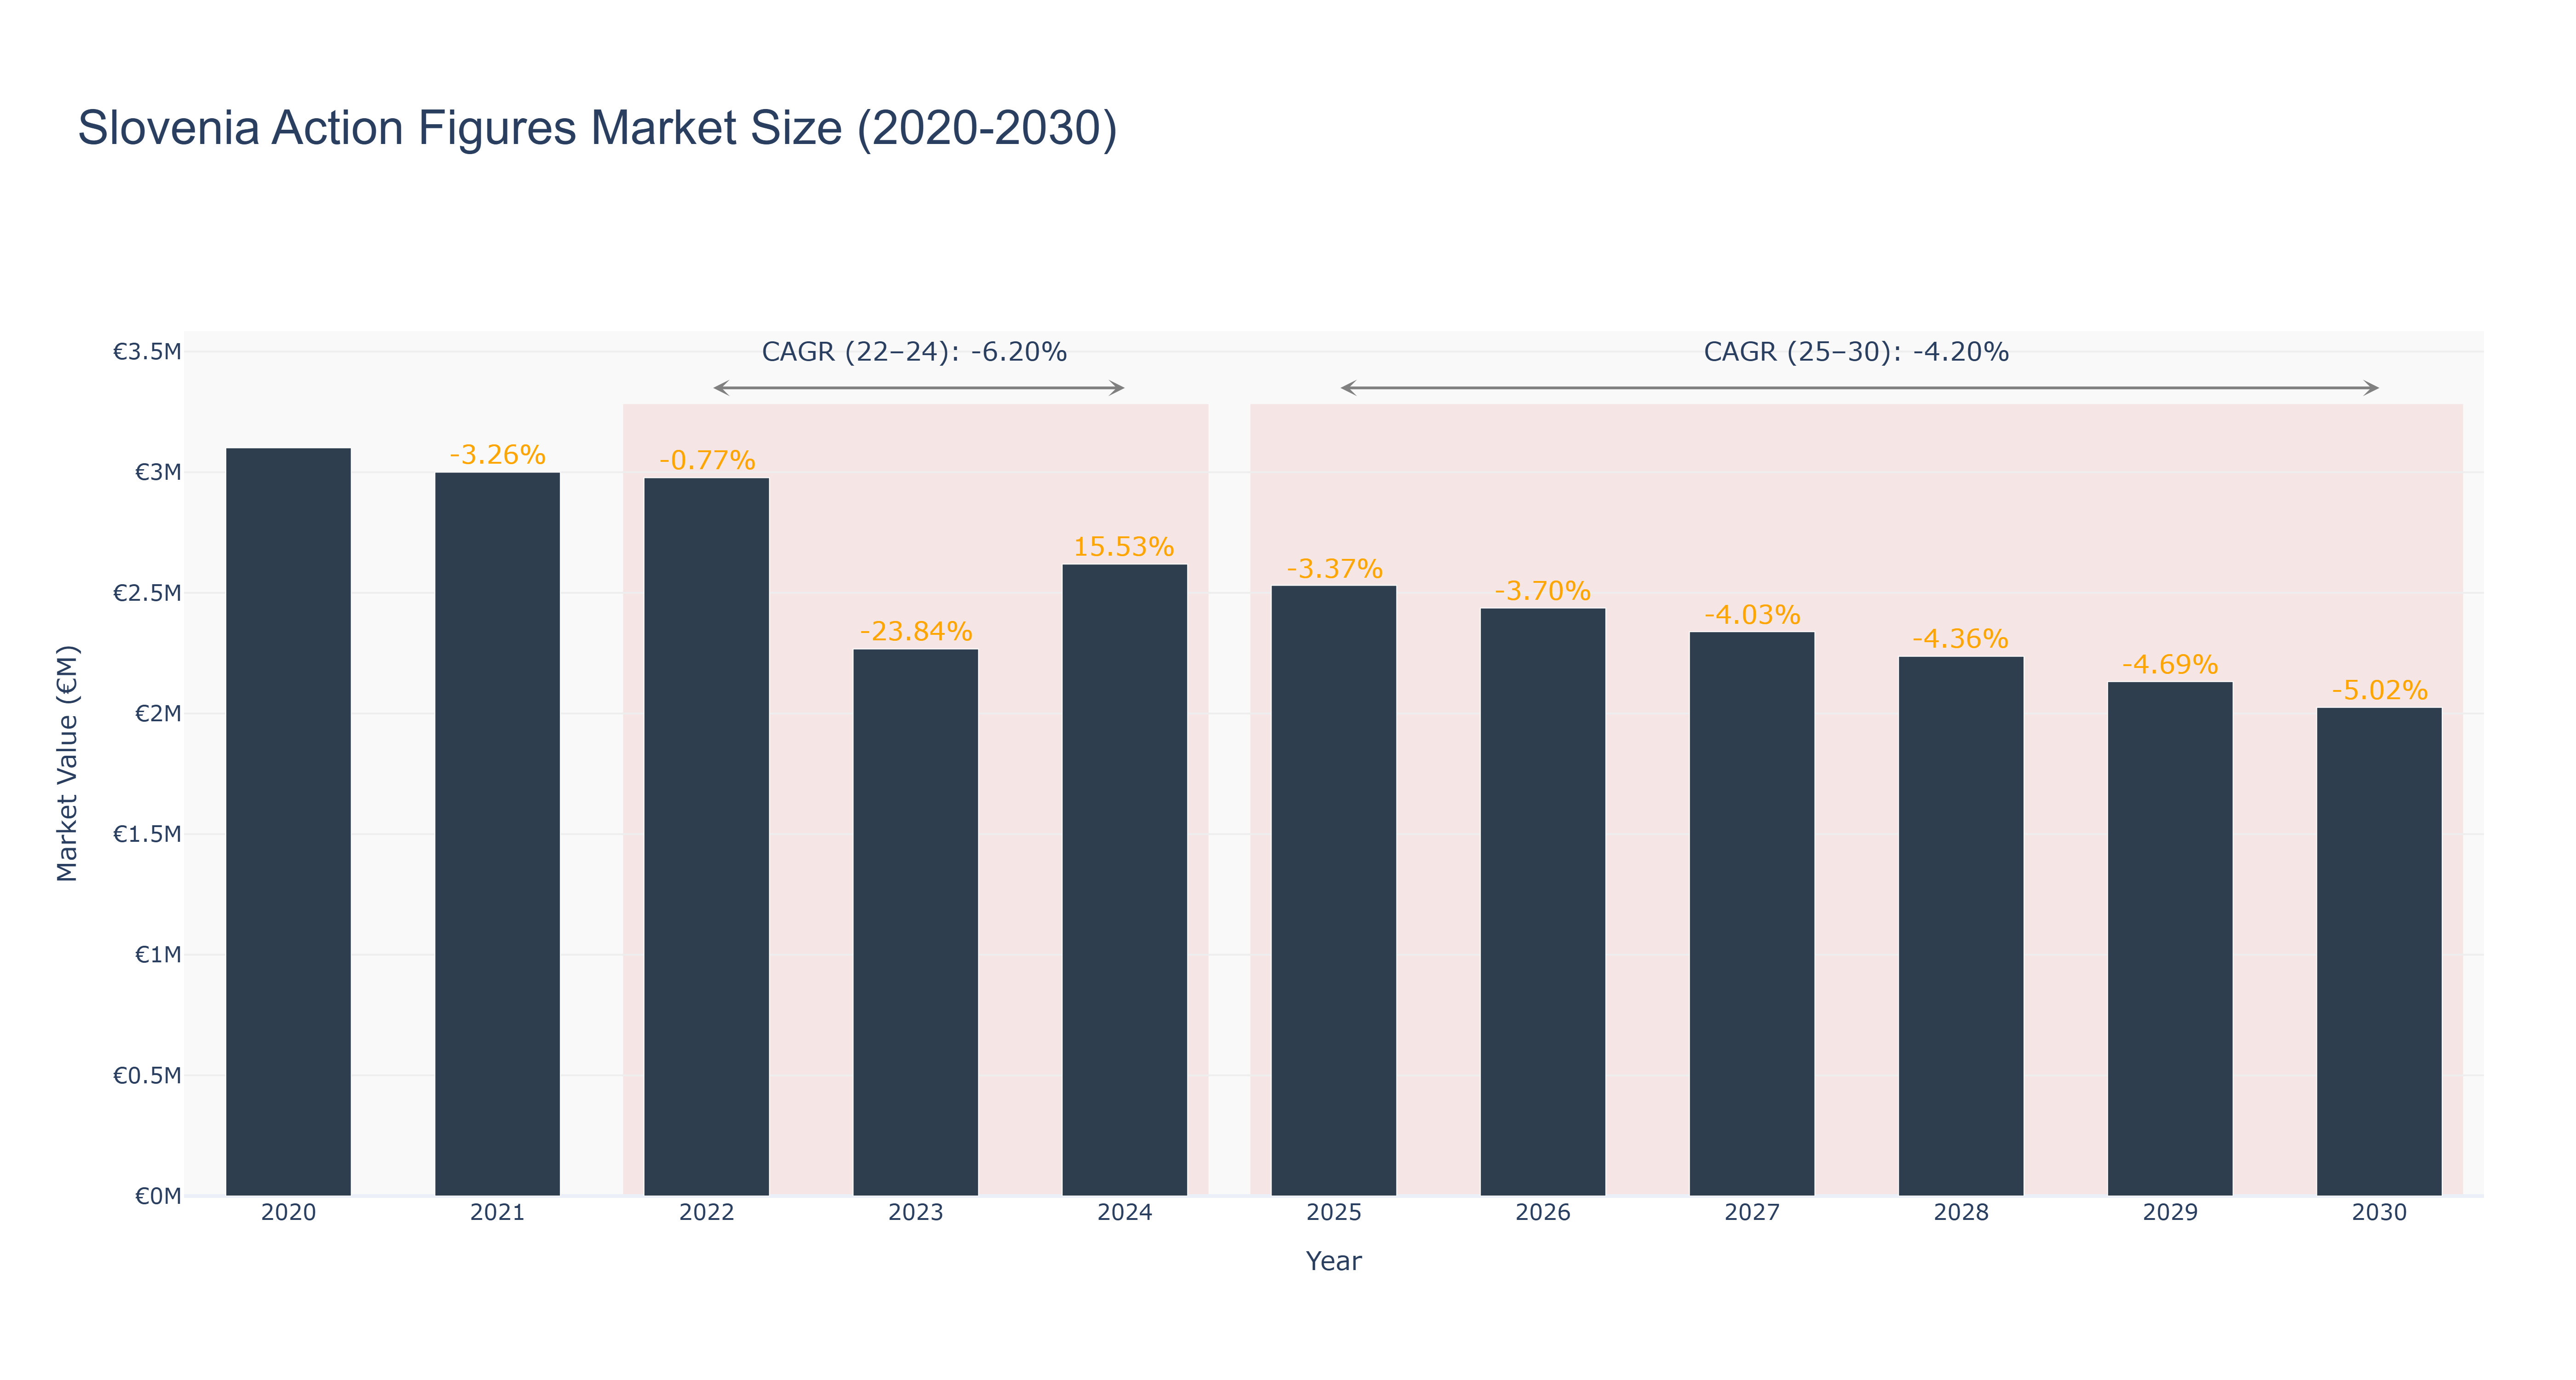
Slovenia's Action Figures Market experienced a peak market size of €3.10 million in 2020, followed by a steady decline in subsequent years. The actual market size decreased to €2.62 million in 2024, showcasing a brief recovery from the initial downturn. Forecasted market sizes indicate a continued downward trend, with an expected size of €2.03 million by 2030. The CAGR values for the periods 2022-24 and 2025-30 are -6.20% and -4.20% respectively. The market's decline can be attributed to changing consumer preferences, increased competition, and economic uncertainties. Looking ahead, Slovenia's Action Figures Market is expected to focus on digital marketing strategies and product innovation to revitalize growth in the coming years. Additionally, upcoming collaborations with local artists and influencers are set to enhance brand visibility and attract new customer segments.
Slovenia Action Figures Market: Production & Trade Performance (2019-2025)
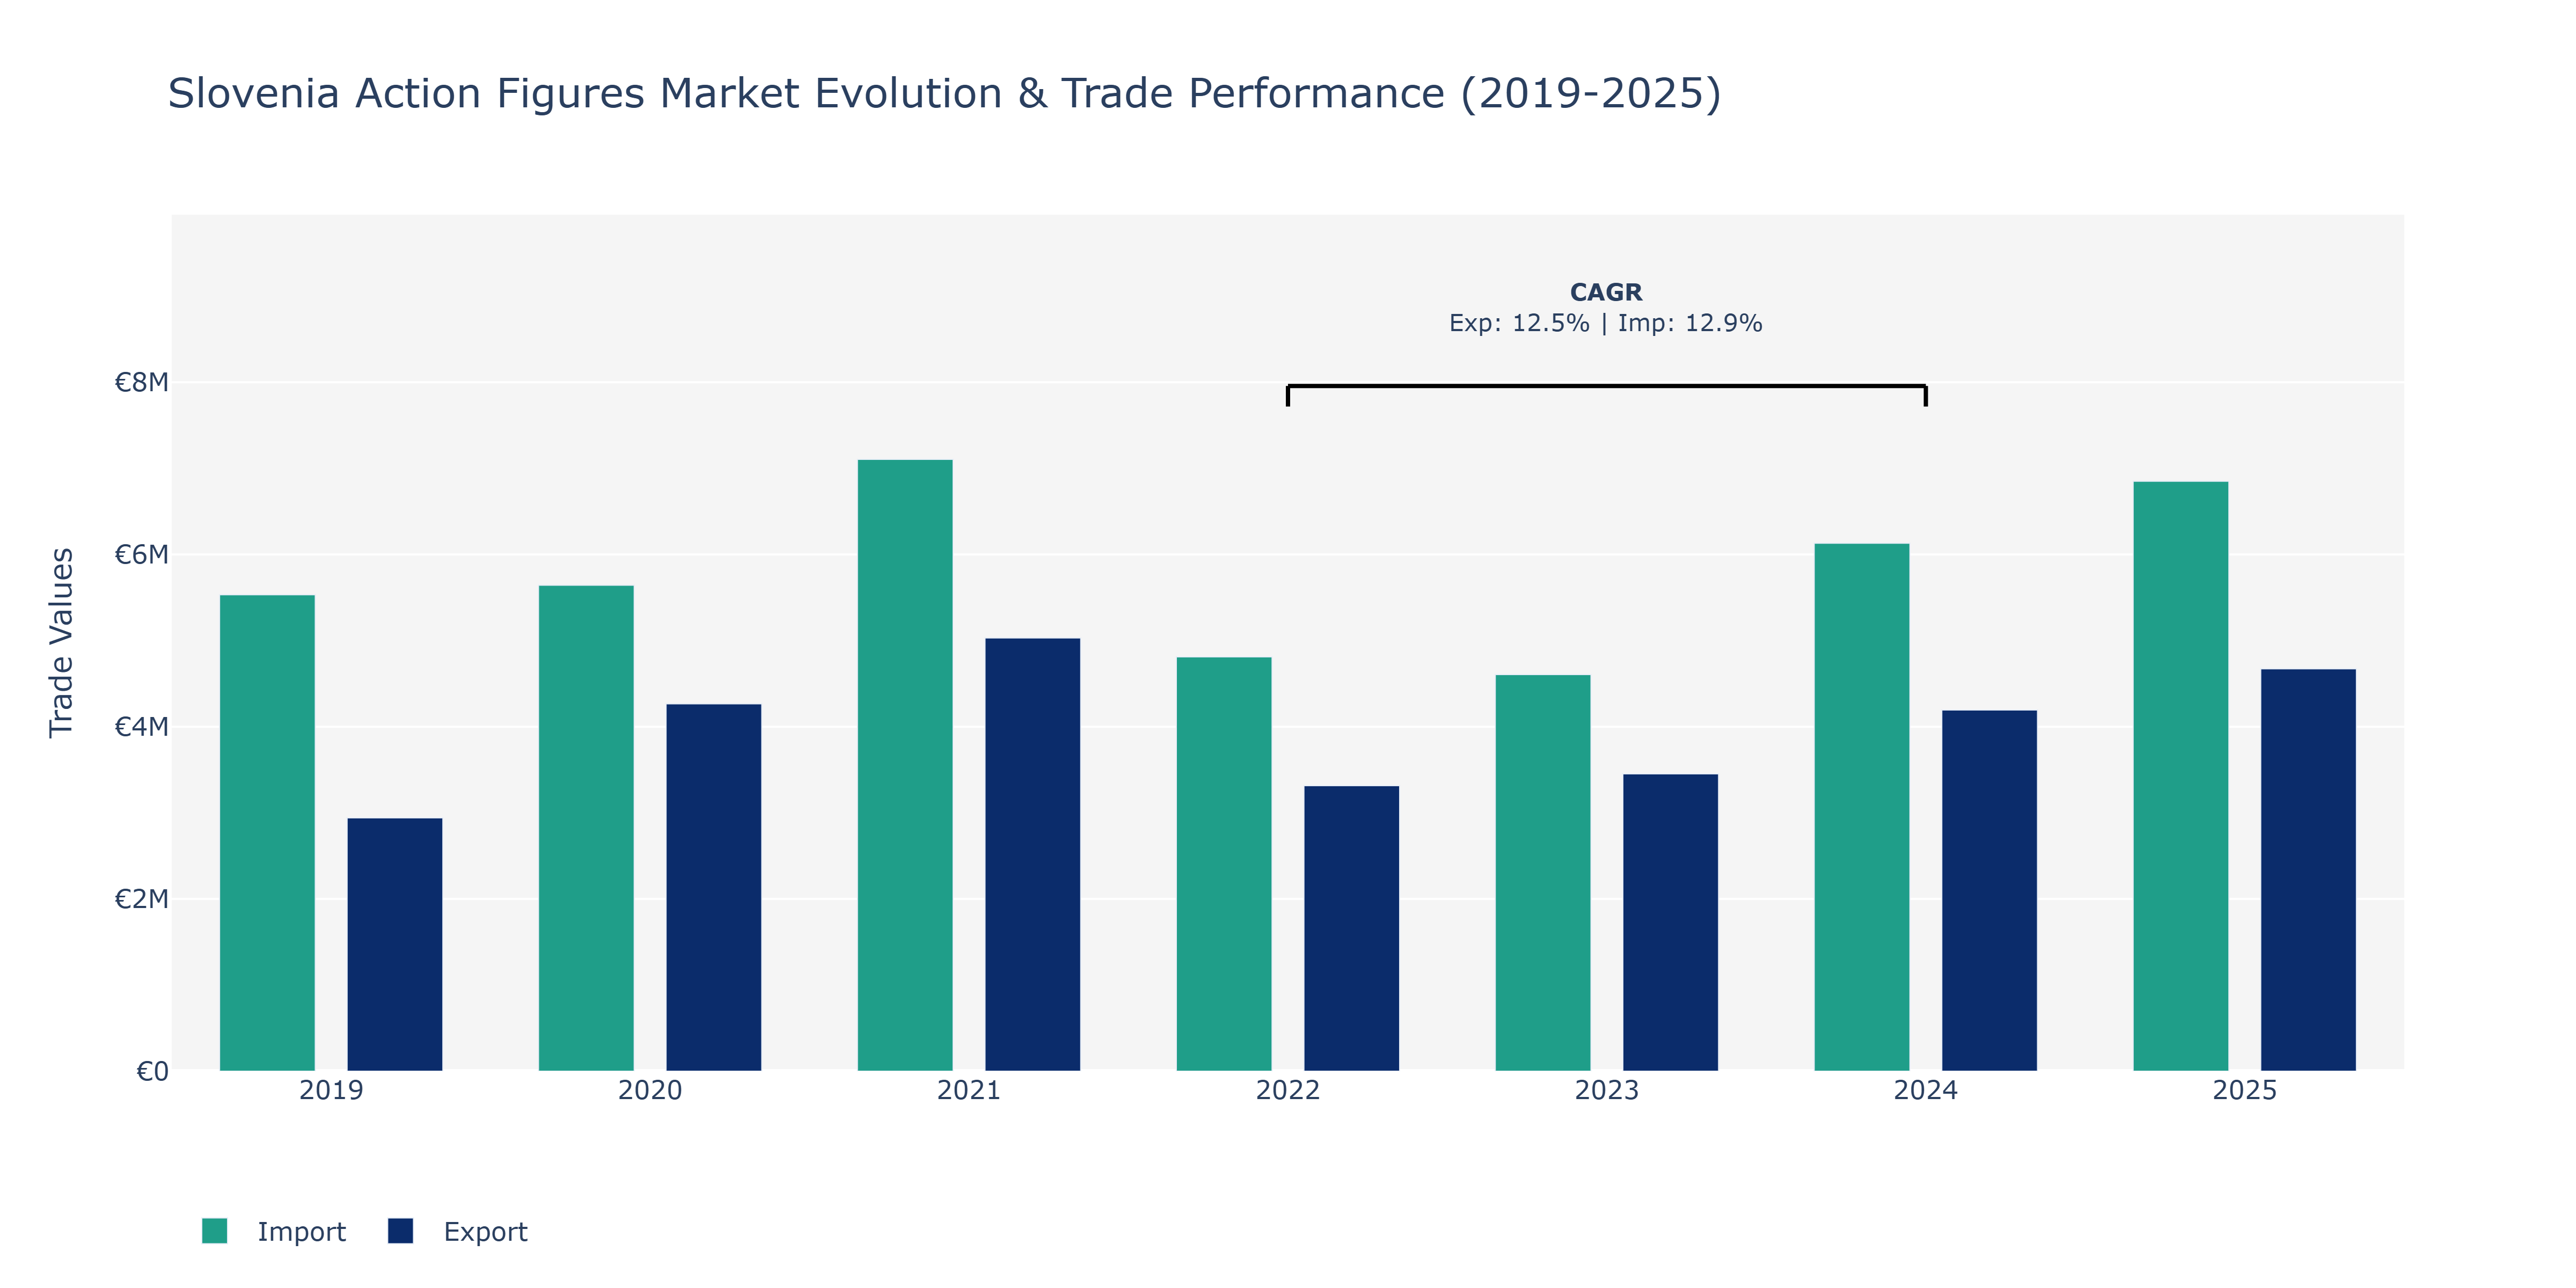
In the Slovenia Action Figures Market, exports saw a notable increase from €2.94 million in 2019 to €4.67 million in 2025, with a peak of €5.03 million in 2021. This growth trend was interrupted in 2022 when exports decreased to €3.32 million but rebounded in 2024 to reach €4.19 million. Imports followed a similar pattern, rising steadily from €5.53 million in 2019 to peak at €7.1 million in 2021 before declining slightly to €6.85 million in 2025. The market experienced fluctuations possibly due to changes in consumer preferences, economic conditions, or global trade dynamics. Factors such as the popularity of specific action figures among Slovenian consumers, currency exchange rates, and trade agreements could have influenced these trends. The growth in exports and imports could also be linked to the market's efforts to expand its product offerings and reach new international markets, driving both outbound and inbound shipments.
Key Highlights of the Report:
- Slovenia Action Figures Market Outlook
- Market Size of Slovenia Action Figures Market, 2025
- Forecast of Slovenia Action Figures Market, 2032
- Historical Data and Forecast of Slovenia Action Figures Revenues & Volume for the Period 2022-2032F
- Slovenia Action Figures Market Trend Evolution
- Slovenia Action Figures Market Drivers and Challenges
- Slovenia Action Figures Price Trends
- Slovenia Action Figures Porter's Five Forces
- Slovenia Action Figures Industry Life Cycle
- Historical Data and Forecast of Slovenia Action Figures Market Revenues & Volume By Type for the Period 2022-2032F
- Historical Data and Forecast of Slovenia Action Figures Market Revenues & Volume By Superheroes for the Period 2022-2032F
- Historical Data and Forecast of Slovenia Action Figures Market Revenues & Volume By Anime Characters for the Period 2022-2032F
- Historical Data and Forecast of Slovenia Action Figures Market Revenues & Volume By Movie Characters for the Period 2022-2032F
- Historical Data and Forecast of Slovenia Action Figures Market Revenues & Volume By Distribution Channel for the Period 2022-2032F
- Historical Data and Forecast of Slovenia Action Figures Market Revenues & Volume By Online for the Period 2022-2032F
- Historical Data and Forecast of Slovenia Action Figures Market Revenues & Volume By Offline for the Period 2022-2032F
- Historical Data and Forecast of Slovenia Action Figures Market Revenues & Volume By End Users for the Period 2022-2032F
- Historical Data and Forecast of Slovenia Action Figures Market Revenues & Volume By Up to 8 years for the Period 2022-2032F
- Historical Data and Forecast of Slovenia Action Figures Market Revenues & Volume By 9-15 years for the Period 2022-2032F
- Historical Data and Forecast of Slovenia Action Figures Market Revenues & Volume By 15 years and Above for the Period 2022-2032F
- Slovenia Action Figures Import Export Trade Statistics
- Market Opportunity Assessment By Type
- Market Opportunity Assessment By Distribution Channel
- Market Opportunity Assessment By End Users
- Slovenia Action Figures Top Companies Market Share
- Slovenia Action Figures Competitive Benchmarking By Technical and Operational Parameters
- Slovenia Action Figures Company Profiles
- Slovenia Action Figures Key Strategic Recommendations
Frequently Asked Questions About the Market Study (FAQs):
6Wresearch actively monitors the Slovenia Action Figures Market and publishes its comprehensive annual report, highlighting emerging trends, growth drivers, revenue analysis, and forecast outlook. Our insights help businesses to make data-backed strategic decisions with ongoing market dynamics. Our analysts track relevent industries related to the Slovenia Action Figures Market, allowing our clients with actionable intelligence and reliable forecasts tailored to emerging regional needs.
Yes, we provide customisation as per your requirements. To learn more, feel free to contact us on sales@6wresearch.com
1 Executive Summary |
2 Introduction |
2.1 Key Highlights of the Report |
2.2 Report Description |
2.3 Market Scope & Segmentation |
2.4 Research Methodology |
2.5 Assumptions |
3 Slovenia Action Figures Market Overview |
3.1 Slovenia Country Macro Economic Indicators |
3.2 Slovenia Action Figures Market Revenues & Volume, 2022 & 2032F |
3.3 Slovenia Action Figures Market - Industry Life Cycle |
3.4 Slovenia Action Figures Market - Porter's Five Forces |
3.5 Slovenia Action Figures Market Revenues & Volume Share, By Type, 2022 & 2032F |
3.6 Slovenia Action Figures Market Revenues & Volume Share, By Distribution Channel, 2022 & 2032F |
3.7 Slovenia Action Figures Market Revenues & Volume Share, By End Users, 2022 & 2032F |
4 Slovenia Action Figures Market Dynamics |
4.1 Impact Analysis |
4.2 Market Drivers |
4.2.1 Growing popularity of action figures among children and adults in Slovenia |
4.2.2 Increase in demand for action figures based on popular movies, TV shows, and video games |
4.2.3 Growing disposable income of consumers in Slovenia |
4.3 Market Restraints |
4.3.1 Competition from other toy categories such as electronic gadgets and educational toys |
4.3.2 Economic uncertainty impacting consumer spending on non-essential items |
5 Slovenia Action Figures Market Trends |
6 Slovenia Action Figures Market, By Types |
6.1 Slovenia Action Figures Market, By Type |
6.1.1 Overview and Analysis |
6.1.2 Slovenia Action Figures Market Revenues & Volume, By Type, 2022-2032F |
6.1.3 Slovenia Action Figures Market Revenues & Volume, By Superheroes, 2022-2032F |
6.1.4 Slovenia Action Figures Market Revenues & Volume, By Anime Characters, 2022-2032F |
6.1.5 Slovenia Action Figures Market Revenues & Volume, By Movie Characters, 2022-2032F |
6.2 Slovenia Action Figures Market, By Distribution Channel |
6.2.1 Overview and Analysis |
6.2.2 Slovenia Action Figures Market Revenues & Volume, By Online, 2022-2032F |
6.2.3 Slovenia Action Figures Market Revenues & Volume, By Offline, 2022-2032F |
6.3 Slovenia Action Figures Market, By End Users |
6.3.1 Overview and Analysis |
6.3.2 Slovenia Action Figures Market Revenues & Volume, By Up to 8 years, 2022-2032F |
6.3.3 Slovenia Action Figures Market Revenues & Volume, By 9-15 years, 2022-2032F |
6.3.4 Slovenia Action Figures Market Revenues & Volume, By 15 years and Above, 2022-2032F |
7 Slovenia Action Figures Market Import-Export Trade Statistics |
7.1 Slovenia Action Figures Market Export to Major Countries |
7.2 Slovenia Action Figures Market Imports from Major Countries |
8 Slovenia Action Figures Market Key Performance Indicators |
8.1 Number of new action figure releases in the Slovenian market |
8.2 Social media engagement and buzz around upcoming action figure launches |
8.3 Attendance at toy fairs and conventions featuring action figures in Slovenia |
9 Slovenia Action Figures Market - Opportunity Assessment |
9.1 Slovenia Action Figures Market Opportunity Assessment, By Type, 2022 & 2032F |
9.2 Slovenia Action Figures Market Opportunity Assessment, By Distribution Channel, 2022 & 2032F |
9.3 Slovenia Action Figures Market Opportunity Assessment, By End Users, 2022 & 2032F |
10 Slovenia Action Figures Market - Competitive Landscape |
10.1 Slovenia Action Figures Market Revenue Share, By Companies, 2025 |
10.2 Slovenia Action Figures Market Competitive Benchmarking, By Operating and Technical Parameters |
11 Company Profiles |
12 Recommendations |
13 Disclaimer |
Global Go To Market Strategy - 2030
Export potential enables firms to identify high-growth global markets with greater confidence by combining advanced trade intelligence with a structured quantitative methodology. The framework analyzes emerging demand trends and country-level import patterns while integrating macroeconomic and trade datasets such as GDP and population forecasts, bilateral import–export flows, tariff structures, elasticity differentials between developed and developing economies, geographic distance, and import demand projections. Using weighted trade values from 2020–2024 as the base period to project country-to-country export potential for 2030, these inputs are operationalized through calculated drivers such as gravity model parameters, tariff impact factors, and projected GDP per-capita growth. Through an analysis of hidden potentials, demand hotspots, and market conditions that are most favorable to success, this method enables firms to focus on target countries, maximize returns, and global expansion with data, backed by accuracy.
By factoring in the projected importer demand gap that is currently unmet and could be potential opportunity, it identifies the potential for the Exporter (Country) among 190 countries, against the general trade analysis, which identifies the biggest importer or exporter.
To discover high-growth global markets and optimize your business strategy:
Click Here
Pricing
- Single User License$ 1,995
- Department License$ 2,400
- Site License$ 3,120
- Global License$ 3,795

Leadership Perspectives from Industry Events
Search
Thought Leadership and Analyst Meet


Our Clients
6WResearch In News
- India Air Conditioner Market Set for Strong Rebound in 2026 After Weather-Led Correction and GST-Driven Recovery: 6Wresearch
- ADAS in India: How Automatic Emergency Braking, Blind Spot Detection & Driver Monitoring are Transforming Road Safety
- Doha a strategic location for EV manufacturing hub: IPA Qatar
- Demand for luxury TVs surging in the GCC, says Samsung
- Empowering Growth: The Thriving Journey of Bangladesh’s Cable Industry
- Demand for luxury TVs surging in the GCC, says Samsung
Latest Reports
- Poland Fire Protection Systems Market (2026-2032)
- Cape Verde Portable Hand-Thrown Extinguisher Market (2026-2032)
- Canada Portable Hand-Thrown Extinguisher Market (2026-2032)
- Cameroon Portable Hand-Thrown Extinguisher Market (2026-2032)
- Burundi Portable Hand-Thrown Extinguisher Market (2026-2032)
- Burkina Faso Portable Hand-Thrown Extinguisher Market (2026-2032)
- Bulgaria Portable Hand-Thrown Extinguisher Market (2026-2032)
- Brunei Portable Hand-Thrown Extinguisher Market (2026-2032)
- Botswana Portable Hand-Thrown Extinguisher Market (2026-2032)
- Bosnia and Herzegovina Portable Hand-Thrown Extinguisher Market (2026-2032)
Industry Events and Analyst Meet

HIMTEX 2026

India Refining Summit 2026

India EV Show 2026

EV tech India Expo 2026

Auto Tech Asia 2026
Whitepaper
- Middle East & Africa Commercial Security Market Click here to view more.
- Middle East & Africa Fire Safety Systems & Equipment Market Click here to view more.
- GCC Drone Market Click here to view more.
- Middle East Lighting Fixture Market Click here to view more.
- GCC Physical & Perimeter Security Market Click here to view more.