Slovenia Bio Hazard Bags Market (2026-2032) | Strategy, Companies, Investment Trends, Value, Outlook, Segments, Share, Trends, Growth, Consumer Insights, Supply, Size, Pricing Analysis, Analysis, Competition, Drivers, Segmentation, Forecast, Revenue, Opportunities, Demand, Restraints, Industry, Challenges, Strategic Insights, Competitive
Market Forecast By Product Type (High-Density Bags, Low-Density Bags, Compostable Bags), By Application (Medical Waste, Contaminated Materials, Biodegradable Waste), By End User (Hospitals, Clinics, Laboratories), By Source (Polymer, Plastic, Plant-Based), By Safety Factor (Leak-Proof, Durable, Eco-Friendly) And Competitive Landscape
| Product Code: ETC11463012 | Publication Date: Apr 2025 | Updated Date: Feb 2026 | Product Type: Market Research Report | |
| Publisher: 6Wresearch | No. of Pages: 65 | No. of Figures: 34 | No. of Tables: 19 | |
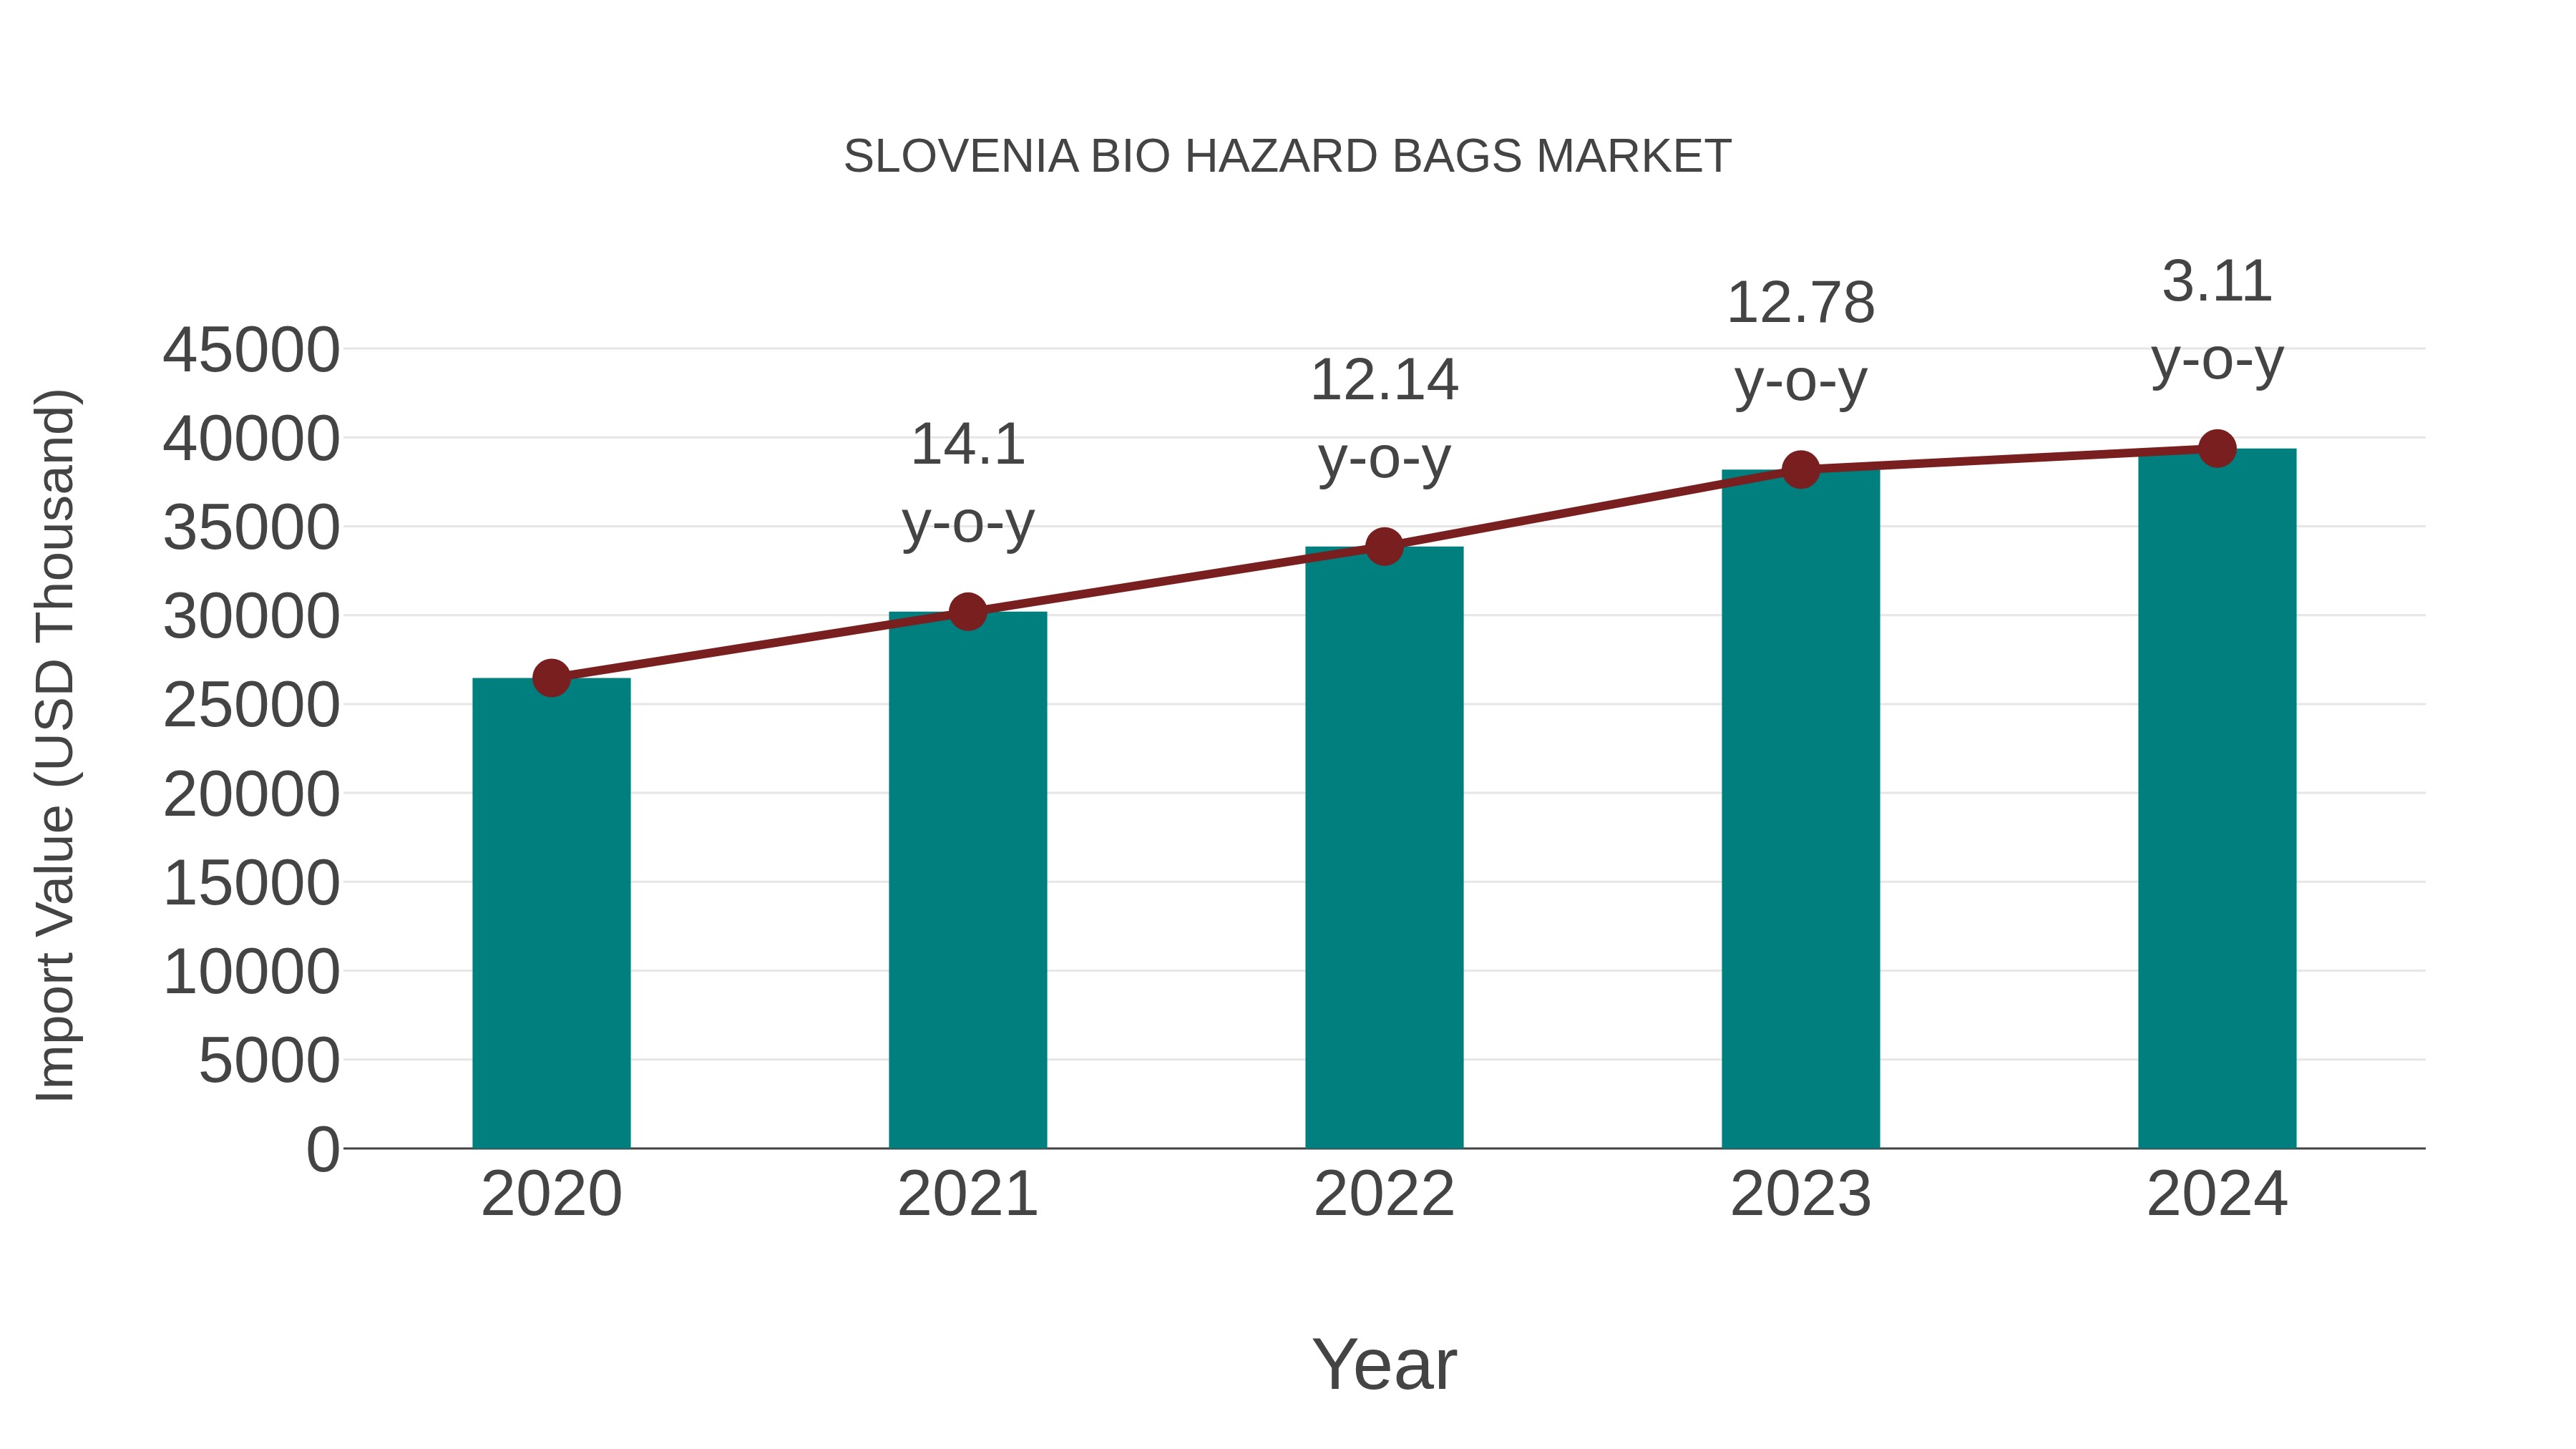
Slovenia Bio Hazard Bags Market: Import Trend Analysis
Slovenia import trend for biohazard bags in 2024 displayed a growth rate of 3.11% compared to the previous year, with a compound annual growth rate (CAGR) of 10.44% from 2020 to 2024. This indicates a steady import momentum driven by increasing demand for biohazard bags in response to heightened safety regulations and growing healthcare industry requirements.
Key Highlights of the Report:
- Slovenia Bio Hazard Bags Market Outlook
- Market Size of Slovenia Bio Hazard Bags Market, 2025
- Forecast of Slovenia Bio Hazard Bags Market, 2032
- Historical Data and Forecast of Slovenia Bio Hazard Bags Revenues & Volume for the Period 2022-2032F
- Slovenia Bio Hazard Bags Market Trend Evolution
- Slovenia Bio Hazard Bags Market Drivers and Challenges
- Slovenia Bio Hazard Bags Price Trends
- Slovenia Bio Hazard Bags Porter's Five Forces
- Slovenia Bio Hazard Bags Industry Life Cycle
- Historical Data and Forecast of Slovenia Bio Hazard Bags Market Revenues & Volume By Product Type for the Period 2022-2032F
- Historical Data and Forecast of Slovenia Bio Hazard Bags Market Revenues & Volume By High-Density Bags for the Period 2022-2032F
- Historical Data and Forecast of Slovenia Bio Hazard Bags Market Revenues & Volume By Low-Density Bags for the Period 2022-2032F
- Historical Data and Forecast of Slovenia Bio Hazard Bags Market Revenues & Volume By Compostable Bags for the Period 2022-2032F
- Historical Data and Forecast of Slovenia Bio Hazard Bags Market Revenues & Volume By Application for the Period 2022-2032F
- Historical Data and Forecast of Slovenia Bio Hazard Bags Market Revenues & Volume By Medical Waste for the Period 2022-2032F
- Historical Data and Forecast of Slovenia Bio Hazard Bags Market Revenues & Volume By Contaminated Materials for the Period 2022-2032F
- Historical Data and Forecast of Slovenia Bio Hazard Bags Market Revenues & Volume By Biodegradable Waste for the Period 2022-2032F
- Historical Data and Forecast of Slovenia Bio Hazard Bags Market Revenues & Volume By End User for the Period 2022-2032F
- Historical Data and Forecast of Slovenia Bio Hazard Bags Market Revenues & Volume By Hospitals for the Period 2022-2032F
- Historical Data and Forecast of Slovenia Bio Hazard Bags Market Revenues & Volume By Clinics for the Period 2022-2032F
- Historical Data and Forecast of Slovenia Bio Hazard Bags Market Revenues & Volume By Laboratories for the Period 2022-2032F
- Historical Data and Forecast of Slovenia Bio Hazard Bags Market Revenues & Volume By Source for the Period 2022-2032F
- Historical Data and Forecast of Slovenia Bio Hazard Bags Market Revenues & Volume By Polymer for the Period 2022-2032F
- Historical Data and Forecast of Slovenia Bio Hazard Bags Market Revenues & Volume By Plastic for the Period 2022-2032F
- Historical Data and Forecast of Slovenia Bio Hazard Bags Market Revenues & Volume By Plant-Based for the Period 2022-2032F
- Historical Data and Forecast of Slovenia Bio Hazard Bags Market Revenues & Volume By Safety Factor for the Period 2022-2032F
- Historical Data and Forecast of Slovenia Bio Hazard Bags Market Revenues & Volume By Leak-Proof for the Period 2022-2032F
- Historical Data and Forecast of Slovenia Bio Hazard Bags Market Revenues & Volume By Durable for the Period 2022-2032F
- Historical Data and Forecast of Slovenia Bio Hazard Bags Market Revenues & Volume By Eco-Friendly for the Period 2022-2032F
- Slovenia Bio Hazard Bags Import Export Trade Statistics
- Market Opportunity Assessment By Product Type
- Market Opportunity Assessment By Application
- Market Opportunity Assessment By End User
- Market Opportunity Assessment By Source
- Market Opportunity Assessment By Safety Factor
- Slovenia Bio Hazard Bags Top Companies Market Share
- Slovenia Bio Hazard Bags Competitive Benchmarking By Technical and Operational Parameters
- Slovenia Bio Hazard Bags Company Profiles
- Slovenia Bio Hazard Bags Key Strategic Recommendations
Frequently Asked Questions About the Market Study (FAQs):
6Wresearch actively monitors the Slovenia Bio Hazard Bags Market and publishes its comprehensive annual report, highlighting emerging trends, growth drivers, revenue analysis, and forecast outlook. Our insights help businesses to make data-backed strategic decisions with ongoing market dynamics. Our analysts track relevent industries related to the Slovenia Bio Hazard Bags Market, allowing our clients with actionable intelligence and reliable forecasts tailored to emerging regional needs.
Yes, we provide customisation as per your requirements. To learn more, feel free to contact us on sales@6wresearch.com
1 Executive Summary |
2 Introduction |
2.1 Key Highlights of the Report |
2.2 Report Description |
2.3 Market Scope & Segmentation |
2.4 Research Methodology |
2.5 Assumptions |
3 Slovenia Bio Hazard Bags Market Overview |
3.1 Slovenia Country Macro Economic Indicators |
3.2 Slovenia Bio Hazard Bags Market Revenues & Volume, 2022 & 2032F |
3.3 Slovenia Bio Hazard Bags Market - Industry Life Cycle |
3.4 Slovenia Bio Hazard Bags Market - Porter's Five Forces |
3.5 Slovenia Bio Hazard Bags Market Revenues & Volume Share, By Product Type, 2022 & 2032F |
3.6 Slovenia Bio Hazard Bags Market Revenues & Volume Share, By Application, 2022 & 2032F |
3.7 Slovenia Bio Hazard Bags Market Revenues & Volume Share, By End User, 2022 & 2032F |
3.8 Slovenia Bio Hazard Bags Market Revenues & Volume Share, By Source, 2022 & 2032F |
3.9 Slovenia Bio Hazard Bags Market Revenues & Volume Share, By Safety Factor, 2022 & 2032F |
4 Slovenia Bio Hazard Bags Market Dynamics |
4.1 Impact Analysis |
4.2 Market Drivers |
4.2.1 Increasing awareness about proper waste disposal and biohazard management practices |
4.2.2 Stringent regulations and guidelines for biohazard waste disposal in healthcare facilities |
4.2.3 Growing focus on infection control and prevention measures in various industries |
4.3 Market Restraints |
4.3.1 High initial costs associated with implementing proper biohazard waste management systems |
4.3.2 Limited availability of specialized facilities for proper disposal and treatment of biohazard waste |
4.3.3 Lack of standardized practices across different sectors leading to inconsistent waste management approaches |
5 Slovenia Bio Hazard Bags Market Trends |
6 Slovenia Bio Hazard Bags Market, By Types |
6.1 Slovenia Bio Hazard Bags Market, By Product Type |
6.1.1 Overview and Analysis |
6.1.2 Slovenia Bio Hazard Bags Market Revenues & Volume, By Product Type, 2022 - 2032F |
6.1.3 Slovenia Bio Hazard Bags Market Revenues & Volume, By High-Density Bags, 2022 - 2032F |
6.1.4 Slovenia Bio Hazard Bags Market Revenues & Volume, By Low-Density Bags, 2022 - 2032F |
6.1.5 Slovenia Bio Hazard Bags Market Revenues & Volume, By Compostable Bags, 2022 - 2032F |
6.2 Slovenia Bio Hazard Bags Market, By Application |
6.2.1 Overview and Analysis |
6.2.2 Slovenia Bio Hazard Bags Market Revenues & Volume, By Medical Waste, 2022 - 2032F |
6.2.3 Slovenia Bio Hazard Bags Market Revenues & Volume, By Contaminated Materials, 2022 - 2032F |
6.2.4 Slovenia Bio Hazard Bags Market Revenues & Volume, By Biodegradable Waste, 2022 - 2032F |
6.3 Slovenia Bio Hazard Bags Market, By End User |
6.3.1 Overview and Analysis |
6.3.2 Slovenia Bio Hazard Bags Market Revenues & Volume, By Hospitals, 2022 - 2032F |
6.3.3 Slovenia Bio Hazard Bags Market Revenues & Volume, By Clinics, 2022 - 2032F |
6.3.4 Slovenia Bio Hazard Bags Market Revenues & Volume, By Laboratories, 2022 - 2032F |
6.4 Slovenia Bio Hazard Bags Market, By Source |
6.4.1 Overview and Analysis |
6.4.2 Slovenia Bio Hazard Bags Market Revenues & Volume, By Polymer, 2022 - 2032F |
6.4.3 Slovenia Bio Hazard Bags Market Revenues & Volume, By Plastic, 2022 - 2032F |
6.4.4 Slovenia Bio Hazard Bags Market Revenues & Volume, By Plant-Based, 2022 - 2032F |
6.5 Slovenia Bio Hazard Bags Market, By Safety Factor |
6.5.1 Overview and Analysis |
6.5.2 Slovenia Bio Hazard Bags Market Revenues & Volume, By Leak-Proof, 2022 - 2032F |
6.5.3 Slovenia Bio Hazard Bags Market Revenues & Volume, By Durable, 2022 - 2032F |
6.5.4 Slovenia Bio Hazard Bags Market Revenues & Volume, By Eco-Friendly, 2022 - 2032F |
7 Slovenia Bio Hazard Bags Market Import-Export Trade Statistics |
7.1 Slovenia Bio Hazard Bags Market Export to Major Countries |
7.2 Slovenia Bio Hazard Bags Market Imports from Major Countries |
8 Slovenia Bio Hazard Bags Market Key Performance Indicators |
8.1 Compliance rate with biohazard waste disposal regulations |
8.2 Adoption rate of biohazard waste management systems in healthcare facilities |
8.3 Number of reported biohazard incidents due to improper waste disposal practices |
9 Slovenia Bio Hazard Bags Market - Opportunity Assessment |
9.1 Slovenia Bio Hazard Bags Market Opportunity Assessment, By Product Type, 2022 & 2032F |
9.2 Slovenia Bio Hazard Bags Market Opportunity Assessment, By Application, 2022 & 2032F |
9.3 Slovenia Bio Hazard Bags Market Opportunity Assessment, By End User, 2022 & 2032F |
9.4 Slovenia Bio Hazard Bags Market Opportunity Assessment, By Source, 2022 & 2032F |
9.5 Slovenia Bio Hazard Bags Market Opportunity Assessment, By Safety Factor, 2022 & 2032F |
10 Slovenia Bio Hazard Bags Market - Competitive Landscape |
10.1 Slovenia Bio Hazard Bags Market Revenue Share, By Companies, 2025 |
10.2 Slovenia Bio Hazard Bags Market Competitive Benchmarking, By Operating and Technical Parameters |
11 Company Profiles |
12 Recommendations |
13 Disclaimer |
Export potential assessment - trade Analytics for 2030
Export potential enables firms to identify high-growth global markets with greater confidence by combining advanced trade intelligence with a structured quantitative methodology. The framework analyzes emerging demand trends and country-level import patterns while integrating macroeconomic and trade datasets such as GDP and population forecasts, bilateral import–export flows, tariff structures, elasticity differentials between developed and developing economies, geographic distance, and import demand projections. Using weighted trade values from 2020–2024 as the base period to project country-to-country export potential for 2030, these inputs are operationalized through calculated drivers such as gravity model parameters, tariff impact factors, and projected GDP per-capita growth. Through an analysis of hidden potentials, demand hotspots, and market conditions that are most favorable to success, this method enables firms to focus on target countries, maximize returns, and global expansion with data, backed by accuracy.
By factoring in the projected importer demand gap that is currently unmet and could be potential opportunity, it identifies the potential for the Exporter (Country) among 190 countries, against the general trade analysis, which identifies the biggest importer or exporter.
To discover high-growth global markets and optimize your business strategy:
Click Here
Pricing
- Single User License$ 1,995
- Department License$ 2,400
- Site License$ 3,120
- Global License$ 3,795

Search
Thought Leadership and Analyst Meet


Our Clients
Latest Reports
- China Electric Appliance Rental Market (2026-2032) | Trends, Revenue, Growth, Challenges, Size, Value, Outlook, Pricing, Strategy, Insights, Restraints, segmentation, Companies, Investment Opportunities, Analysis, Demand, Drivers, Competition, Forecast, Share
- Chile Electric Appliance Rental Market (2026-2032) | Outlook, Competition, Drivers, Strategy, Revenue, Analysis, Value, Pricing, Restraints, Size, Demand, Share, Growth, Forecast, Challenges, Insights, Investment Opportunities, Companies, Trends, segmentation
- Cambodia Electric Appliance Rental Market (2026-2032) | Companies, Analysis, Restraints, Pricing, Insights, Challenges, Outlook, Strategy, Forecast, Trends, Competition, Value, Revenue, Investment Opportunities, segmentation, Drivers, Size, Demand, Growth, Share
- Brazil Electric Appliance Rental Market (2026-2032) | Revenue, Strategy, Forecast, Companies, segmentation, Competition, Size, Investment Opportunities, Pricing, Restraints, Outlook, Challenges, Analysis, Drivers, Value, Demand, Insights, Trends, Growth, Share
- Bangladesh Electric Appliance Rental Market (2026-2032) | Drivers, Forecast, Investment Opportunities, Strategy, Insights, Demand, Challenges, Outlook, Trends, Competition, Value, Revenue, Size, Pricing, Analysis, Companies, Restraints, segmentation, Share, Growth
- Bahrain Electric Appliance Rental Market (2026-2032) | Outlook, Size, Competition, Restraints, Drivers, Value, Trends, Investment Opportunities, Insights, Forecast, Revenue, Strategy, Growth, Share, Demand, Analysis, Challenges, Companies, segmentation, Pricing
- Azerbaijan Electric Appliance Rental Market (2026-2032) | Trends, Investment Opportunities, Restraints, Insights, Strategy, Competition, Value, Growth, Demand, Drivers, Analysis, Forecast, Size, Share, Outlook, segmentation, Pricing, Challenges, Revenue, Companies
- Australia Electric Appliance Rental Market (2026-2032) | Challenges, Restraints, Forecast, Demand, Size, Competition, Pricing, Investment Opportunities, Revenue, Trends, Drivers, Growth, Outlook, Analysis, Strategy, Value, segmentation, Insights, Companies, Share
- Argentina Electric Appliance Rental Market (2026-2032) | Growth, Trends, Insights, Outlook, Forecast, Size, Drivers, Analysis, Restraints, Challenges, Share, Revenue, Investment Opportunities, Strategy, Demand, Value, Companies, segmentation, Competition, Pricing
- Algeria Electric Appliance Rental Market (2026-2032) | Share, Size, Value, Strategy, Competition, Outlook, Challenges, Companies, Trends, Pricing, Insights, Forecast, Investment Opportunities, Revenue, Growth, Restraints, segmentation, Analysis, Demand, Drivers
Industry Events and Analyst Meet

HIMTEX 2026

India Refining Summit 2026

India EV Show 2026

EV tech India Expo 2026

Auto Tech Asia 2026
Whitepaper
- Middle East & Africa Commercial Security Market Click here to view more.
- Middle East & Africa Fire Safety Systems & Equipment Market Click here to view more.
- GCC Drone Market Click here to view more.
- Middle East Lighting Fixture Market Click here to view more.
- GCC Physical & Perimeter Security Market Click here to view more.
6WResearch In News
- Doha a strategic location for EV manufacturing hub: IPA Qatar
- Demand for luxury TVs surging in the GCC, says Samsung
- Empowering Growth: The Thriving Journey of Bangladesh’s Cable Industry
- Demand for luxury TVs surging in the GCC, says Samsung
- Video call with a traditional healer? Once unthinkable, it’s now common in South Africa
- Intelligent Buildings To Smooth GCC’s Path To Net Zero