Slovenia Black Board Market (2026-2032) | Industry, Share, Segmentation, Trends, Analysis, Size, Companies, Growth, Outlook, Revenue, Value & Forecast
Market Forecast By Product Type (Wall-mounted Board, Mobile Board, Others), By Application (Schools, Office, Family, Others) And Competitive Landscape
| Product Code: ETC5249212 | Publication Date: Nov 2023 | Updated Date: Apr 2026 | Product Type: Market Research Report | |
| Publisher: 6Wresearch | Author: Shubham Padhi | No. of Pages: 60 | No. of Figures: 30 | No. of Tables: 5 |
Slovenia Black Board Market Size (2020-2030)
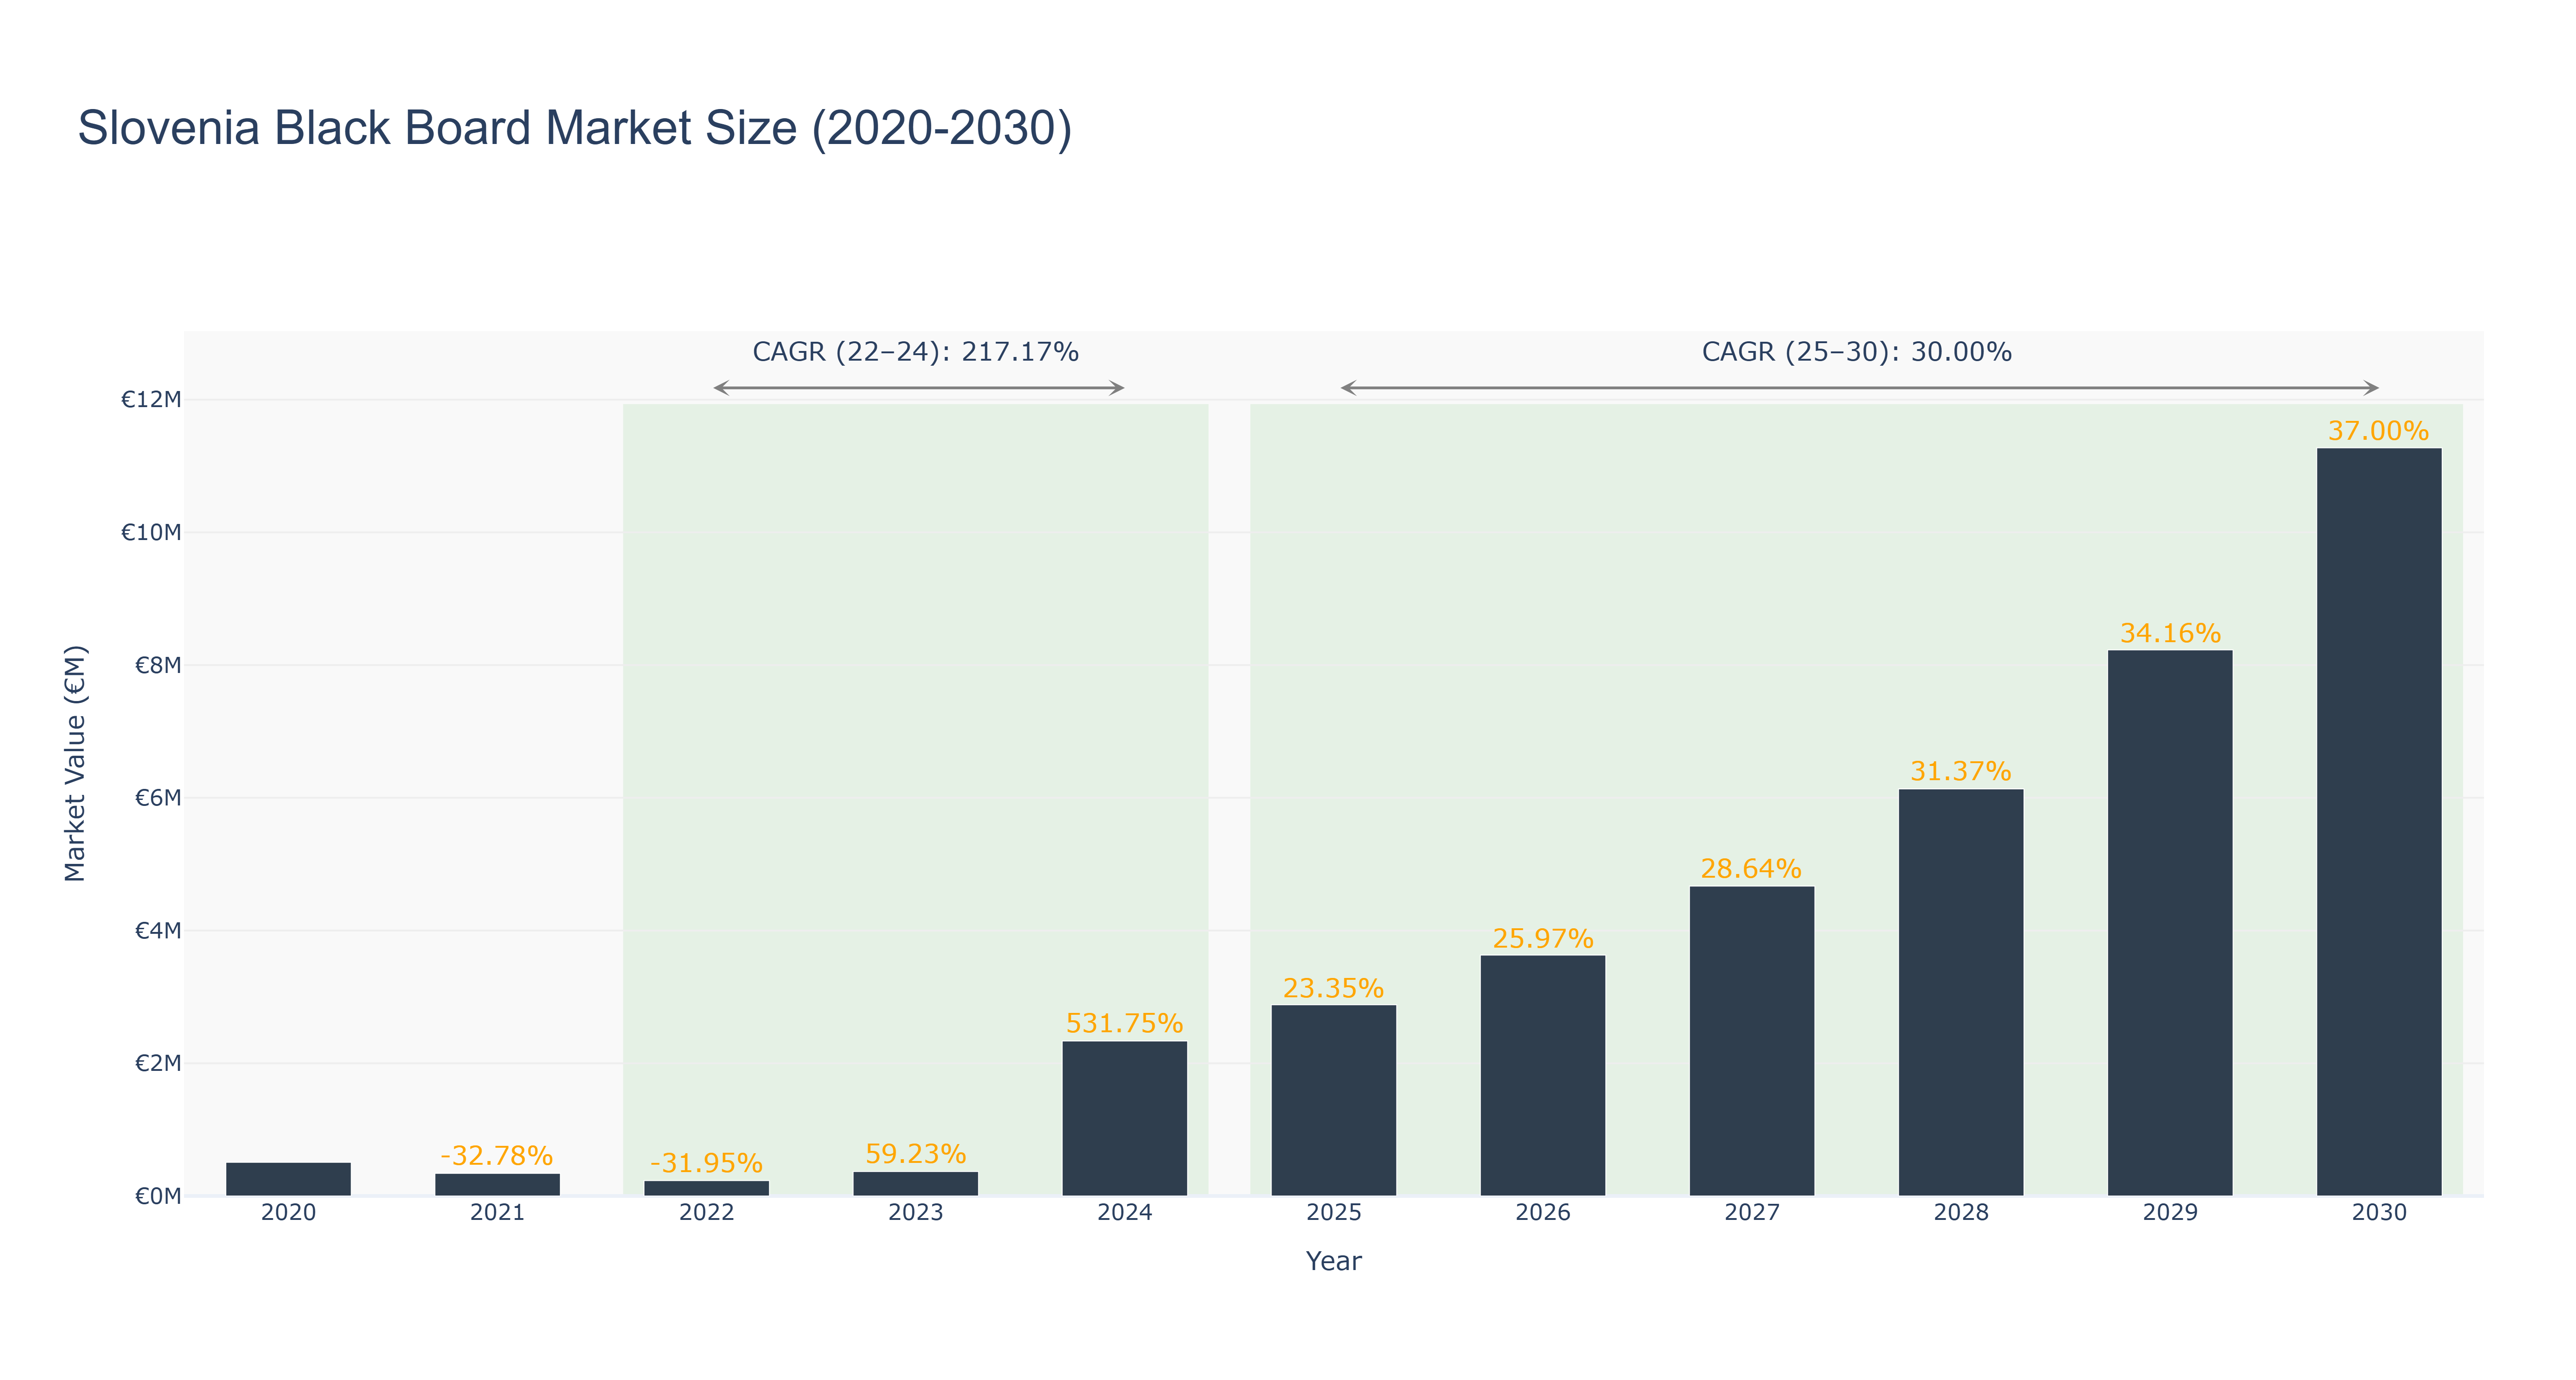
The Slovenia Black Board Market experienced significant fluctuations between 2020 and 2024, with a peak market size of €507.59 thousand in 2020, followed by a decline to €232.18 thousand in 2022, representing a steep growth decline of -31.95%. However, a remarkable recovery occurred in 2023, with the market rebounding to €369.71 thousand and a growth rate of 59.23%. The market is projected to surge dramatically, reaching €2.34 million in 2024, reflecting a staggering CAGR of 217.17% from 2022 to 2024. Looking ahead, the forecasted period from 2025 to 2030 anticipates steady growth, with the market expected to reach €11.27 million by 2030, translating to a CAGR of 30.00%. This growth is driven by increasing demand for educational tools and interactive learning environments. As Slovenia enhances its educational infrastructure, the blackboard market is poised for robust expansion, supported by broader trends in digitization and innovative teaching methodologies.
Slovenia Black Board Market: Production & Trade Performance (2019-2025)
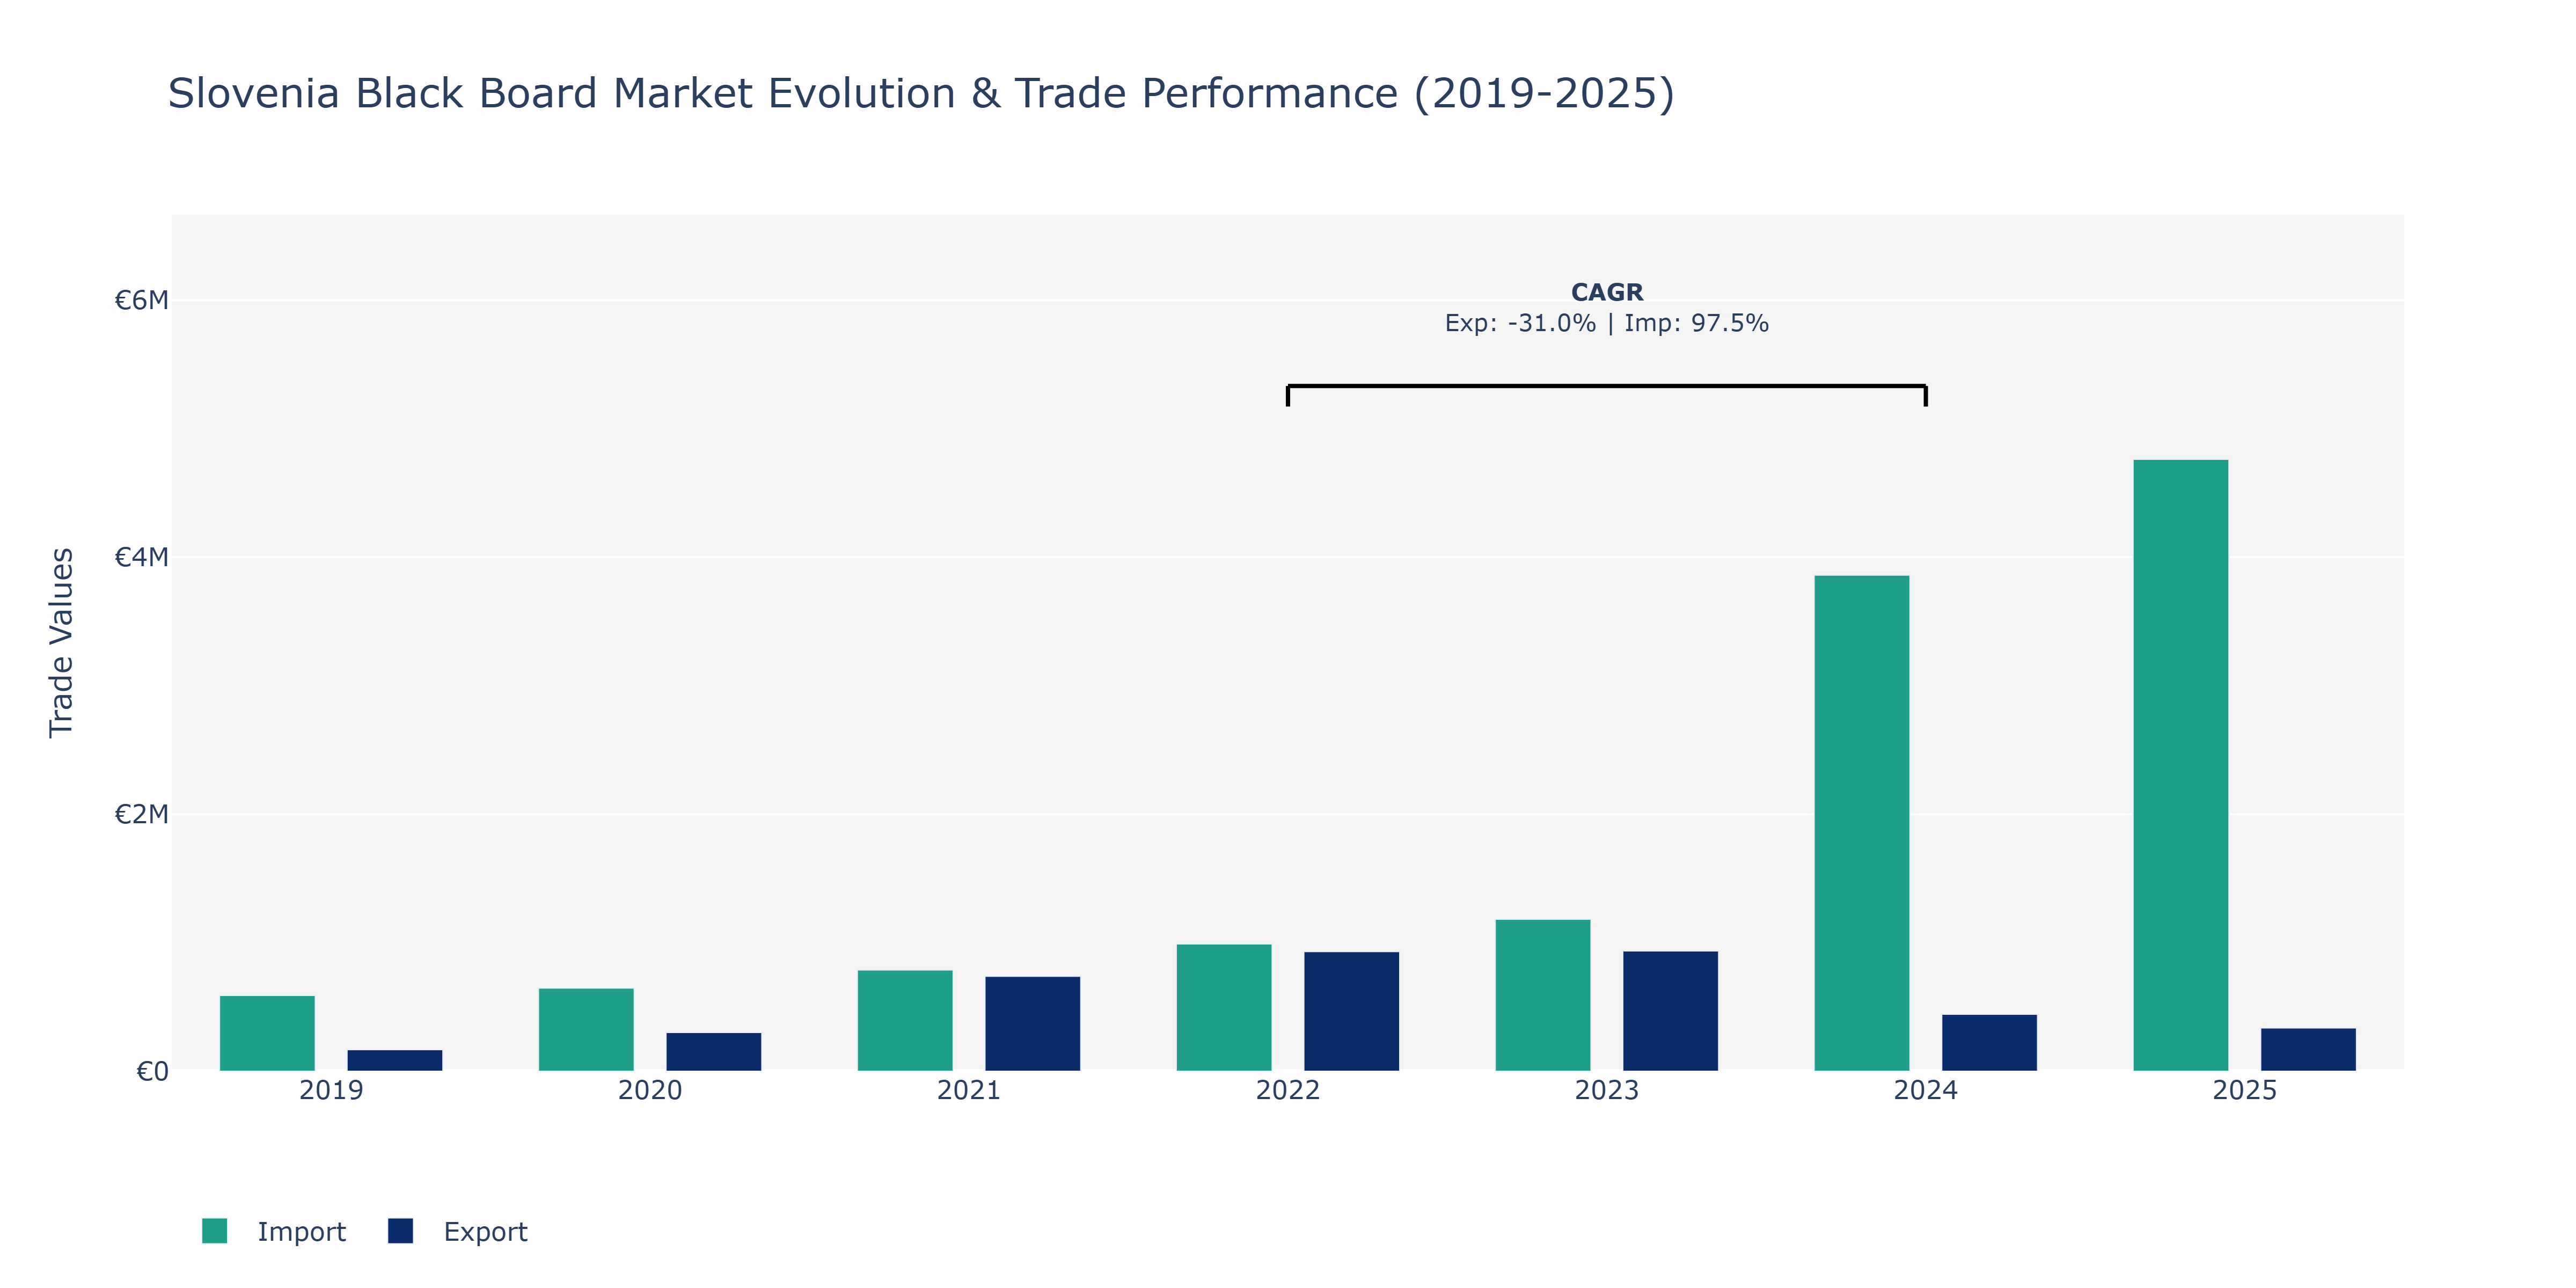
In the Slovenia Black Board Market, exports saw a fluctuating trend from 2019 to 2025. Starting at €167.19 thousand in 2019, exports surged to €930.75 thousand in 2022, representing a substantial increase. However, there was a sharp decline to €442.93 thousand in 2024 before a partial recovery to €336.71 thousand in 2025. On the other hand, imports showed steady growth over the same period, rising from €589.31 thousand in 2019 to €4.76 million in 2024. This substantial increase in imports could be attributed to a rising demand for foreign products or materials to support the blackboard market in Slovenia. The surge in imports by 97.47% from 2022 to 2024 could signify the market's increasing reliance on international suppliers for raw materials or finished products. Such a trend could be influenced by factors like changes in consumer preferences, global supply chain dynamics, or trade agreements impacting Slovenia's market.
Key Highlights of the Report:
- Slovenia Black Board Market Outlook
- Market Size of Slovenia Black Board Market, 2025
- Forecast of Slovenia Black Board Market, 2032
- Historical Data and Forecast of Slovenia Black Board Revenues & Volume for the Period 2022-2032F
- Slovenia Black Board Market Trend Evolution
- Slovenia Black Board Market Drivers and Challenges
- Slovenia Black Board Price Trends
- Slovenia Black Board Porter`s Five Forces
- Slovenia Black Board Industry Life Cycle
- Historical Data and Forecast of Slovenia Black Board Market Revenues & Volume By Product Type for the Period 2022-2032F
- Historical Data and Forecast of Slovenia Black Board Market Revenues & Volume By Wall-mounted Board for the Period 2022-2032F
- Historical Data and Forecast of Slovenia Black Board Market Revenues & Volume By Mobile Board for the Period 2022-2032F
- Historical Data and Forecast of Slovenia Black Board Market Revenues & Volume By Others for the Period 2022-2032F
- Historical Data and Forecast of Slovenia Black Board Market Revenues & Volume By Application for the Period 2022-2032F
- Historical Data and Forecast of Slovenia Black Board Market Revenues & Volume By Schools for the Period 2022-2032F
- Historical Data and Forecast of Slovenia Black Board Market Revenues & Volume By Office for the Period 2022-2032F
- Historical Data and Forecast of Slovenia Black Board Market Revenues & Volume By Family for the Period 2022-2032F
- Historical Data and Forecast of Slovenia Black Board Market Revenues & Volume By Others for the Period 2022-2032F
- Slovenia Black Board Import Export Trade Statistics
- Market Opportunity Assessment By Product Type
- Market Opportunity Assessment By Application
- Slovenia Black Board Top Companies Market Share
- Slovenia Black Board Competitive Benchmarking By Technical and Operational Parameters
- Slovenia Black Board Company Profiles
- Slovenia Black Board Key Strategic Recommendations
Frequently Asked Questions About the Market Study (FAQs):
6Wresearch actively monitors the Slovenia Black Board Market and publishes its comprehensive annual report, highlighting emerging trends, growth drivers, revenue analysis, and forecast outlook. Our insights help businesses to make data-backed strategic decisions with ongoing market dynamics. Our analysts track relevent industries related to the Slovenia Black Board Market, allowing our clients with actionable intelligence and reliable forecasts tailored to emerging regional needs.
Yes, we provide customisation as per your requirements. To learn more, feel free to contact us on sales@6wresearch.com
1 Executive Summary |
2 Introduction |
2.1 Key Highlights of the Report |
2.2 Report Description |
2.3 Market Scope & Segmentation |
2.4 Research Methodology |
2.5 Assumptions |
3 Slovenia Black Board Market Overview |
3.1 Slovenia Country Macro Economic Indicators |
3.2 Slovenia Black Board Market Revenues & Volume, 2022 & 2032F |
3.3 Slovenia Black Board Market - Industry Life Cycle |
3.4 Slovenia Black Board Market - Porter's Five Forces |
3.5 Slovenia Black Board Market Revenues & Volume Share, By Product Type, 2022 & 2032F |
3.6 Slovenia Black Board Market Revenues & Volume Share, By Application, 2022 & 2032F |
4 Slovenia Black Board Market Dynamics |
4.1 Impact Analysis |
4.2 Market Drivers |
4.2.1 Increasing demand for interactive and digital learning tools in educational institutions |
4.2.2 Growth in the corporate sector leading to higher demand for presentation tools in meetings and conferences |
4.2.3 Government initiatives promoting the adoption of digital technologies in schools and businesses |
4.3 Market Restraints |
4.3.1 High initial investment costs for advanced black board technologies |
4.3.2 Limited awareness and reluctance to switch from traditional blackboards to digital solutions |
4.3.3 Lack of skilled professionals for implementing and maintaining digital blackboard systems |
5 Slovenia Black Board Market Trends |
6 Slovenia Black Board Market Segmentations |
6.1 Slovenia Black Board Market, By Product Type |
6.1.1 Overview and Analysis |
6.1.2 Slovenia Black Board Market Revenues & Volume, By Wall-mounted Board, 2022-2032F |
6.1.3 Slovenia Black Board Market Revenues & Volume, By Mobile Board, 2022-2032F |
6.1.4 Slovenia Black Board Market Revenues & Volume, By Others, 2022-2032F |
6.2 Slovenia Black Board Market, By Application |
6.2.1 Overview and Analysis |
6.2.2 Slovenia Black Board Market Revenues & Volume, By Schools, 2022-2032F |
6.2.3 Slovenia Black Board Market Revenues & Volume, By Office, 2022-2032F |
6.2.4 Slovenia Black Board Market Revenues & Volume, By Family, 2022-2032F |
6.2.5 Slovenia Black Board Market Revenues & Volume, By Others, 2022-2032F |
7 Slovenia Black Board Market Import-Export Trade Statistics |
7.1 Slovenia Black Board Market Export to Major Countries |
7.2 Slovenia Black Board Market Imports from Major Countries |
8 Slovenia Black Board Market Key Performance Indicators |
8.1 Adoption rate of digital blackboard solutions in educational institutions and corporate settings |
8.2 Average time taken for the return on investment in digital blackboard technologies |
8.3 Number of government initiatives supporting the digitalization of educational and corporate sectors |
9 Slovenia Black Board Market - Opportunity Assessment |
9.1 Slovenia Black Board Market Opportunity Assessment, By Product Type, 2022 & 2032F |
9.2 Slovenia Black Board Market Opportunity Assessment, By Application, 2022 & 2032F |
10 Slovenia Black Board Market - Competitive Landscape |
10.1 Slovenia Black Board Market Revenue Share, By Companies, 2025 |
10.2 Slovenia Black Board Market Competitive Benchmarking, By Operating and Technical Parameters |
11 Company Profiles |
12 Recommendations | 13 Disclaimer |
Export potential assessment - trade Analytics for 2030
Export potential enables firms to identify high-growth global markets with greater confidence by combining advanced trade intelligence with a structured quantitative methodology. The framework analyzes emerging demand trends and country-level import patterns while integrating macroeconomic and trade datasets such as GDP and population forecasts, bilateral import–export flows, tariff structures, elasticity differentials between developed and developing economies, geographic distance, and import demand projections. Using weighted trade values from 2020–2024 as the base period to project country-to-country export potential for 2030, these inputs are operationalized through calculated drivers such as gravity model parameters, tariff impact factors, and projected GDP per-capita growth. Through an analysis of hidden potentials, demand hotspots, and market conditions that are most favorable to success, this method enables firms to focus on target countries, maximize returns, and global expansion with data, backed by accuracy.
By factoring in the projected importer demand gap that is currently unmet and could be potential opportunity, it identifies the potential for the Exporter (Country) among 190 countries, against the general trade analysis, which identifies the biggest importer or exporter.
To discover high-growth global markets and optimize your business strategy:
Click Here
Pricing
- Single User License$ 1,995
- Department License$ 2,400
- Site License$ 3,120
- Global License$ 3,795

Search
Thought Leadership and Analyst Meet


Our Clients
Latest Reports
- Philippines Polyhydroxybutyrate-co-Hydroxyvalerate Market (2026-2032) | Trends, Insights, Challenges, Restraints, Competition, Size, Value, Forecast, Pricing, Share, Outlook, Revenue, Investment Opportunities, Strategy, Drivers, Demand, Growth, segmentation, Analysis, Companies
- Peru Polyhydroxybutyrate-co-Hydroxyvalerate Market (2026-2032) | Growth, Demand, Challenges, Share, Trends, Analysis, Pricing, Investment Opportunities, Drivers, Value, Forecast, Competition, Size, Companies, Insights, Outlook, Restraints, segmentation, Revenue, Strategy
- Pakistan Polyhydroxybutyrate-co-Hydroxyvalerate Market (2026-2032) | Restraints, segmentation, Pricing, Forecast, Share, Strategy, Competition, Trends, Insights, Drivers, Challenges, Growth, Revenue, Outlook, Value, Investment Opportunities, Companies, Size, Analysis, Demand
- Oman Polyhydroxybutyrate-co-Hydroxyvalerate Market (2026-2032) | Drivers, segmentation, Insights, Competition, Pricing, Outlook, Size, Revenue, Challenges, Forecast, Analysis, Growth, Value, Share, Trends, Investment Opportunities, Strategy, Restraints, Companies, Demand
- Nigeria Polyhydroxybutyrate-co-Hydroxyvalerate Market (2026-2032) | Value, Investment Opportunities, Analysis, Revenue, Restraints, Pricing, Outlook, Competition, Demand, Growth, Forecast, Companies, Trends, Challenges, segmentation, Drivers, Insights, Share, Size, Strategy
- Nepal Polyhydroxybutyrate-co-Hydroxyvalerate Market (2026-2032) | Insights, Analysis, Drivers, Share, Revenue, Demand, segmentation, Investment Opportunities, Competition, Forecast, Growth, Pricing, Companies, Strategy, Trends, Restraints, Challenges, Outlook, Size, Value
- Myanmar Polyhydroxybutyrate-co-Hydroxyvalerate Market (2026-2032) | Outlook, Revenue, Strategy, Restraints, Drivers, segmentation, Share, Forecast, Competition, Insights, Growth, Pricing, Size, Demand, Value, Companies, Trends, Challenges, Investment Opportunities, Analysis
- Morocco Polyhydroxybutyrate-co-Hydroxyvalerate Market (2026-2032) | Outlook, Investment Opportunities, Restraints, Strategy, Forecast, Challenges, Drivers, Growth, Companies, segmentation, Trends, Size, Competition, Revenue, Demand, Insights, Share, Analysis, Value, Pricing
- Mexico Polyhydroxybutyrate-co-Hydroxyvalerate Market (2026-2032) | Size, Drivers, Outlook, Share, Strategy, Growth, Pricing, Challenges, Companies, Demand, Value, Investment Opportunities, Restraints, Trends, Forecast, segmentation, Analysis, Insights, Competition, Revenue
- Malaysia Polyhydroxybutyrate-co-Hydroxyvalerate Market (2026-2032) | Share, segmentation, Size, Companies, Analysis, Insights, Forecast, Value, Revenue, Drivers, Restraints, Challenges, Investment Opportunities, Trends, Competition, Strategy, Demand, Growth, Outlook, Pricing
Industry Events and Analyst Meet

HIMTEX 2026

India Refining Summit 2026

India EV Show 2026

EV tech India Expo 2026

Auto Tech Asia 2026
Whitepaper
- Middle East & Africa Commercial Security Market Click here to view more.
- Middle East & Africa Fire Safety Systems & Equipment Market Click here to view more.
- GCC Drone Market Click here to view more.
- Middle East Lighting Fixture Market Click here to view more.
- GCC Physical & Perimeter Security Market Click here to view more.
6WResearch In News
- Doha a strategic location for EV manufacturing hub: IPA Qatar
- Demand for luxury TVs surging in the GCC, says Samsung
- Empowering Growth: The Thriving Journey of Bangladesh’s Cable Industry
- Demand for luxury TVs surging in the GCC, says Samsung
- Video call with a traditional healer? Once unthinkable, it’s now common in South Africa
- Intelligent Buildings To Smooth GCC’s Path To Net Zero