Slovenia Cetane Improver Additives Market (2026-2032) | Segmentation, Value, Trends, Analysis, Companies, Growth, Share, Size & Revenue, Industry, Forecast, Competitive Landscape, Outlook
Market Forecast By Type (2-Ethylhexyl Nitrate, Di-Tertiary Butyl Peroxide, Others), By Diesel Type (Petroleum, Diesel, Bio-Diesel), By Distribution Channel (Online Sales, Direct Sales/B2B Sales, Retail Stores, Others), By Application (Direct Market, After Market), By End Use (Transportation, Agriculture, Power Generation, Mining, Construction, Industrial, Others) And Competitive Landscape
| Product Code: ETC9313300 | Publication Date: Sep 2024 | Updated Date: Apr 2026 | Product Type: Market Research Report | |
| Publisher: 6Wresearch | Author: Sumit Sagar | No. of Pages: 75 | No. of Figures: 35 | No. of Tables: 20 |
Slovenia Cetane Improver Additives Market Size (2020-2030)
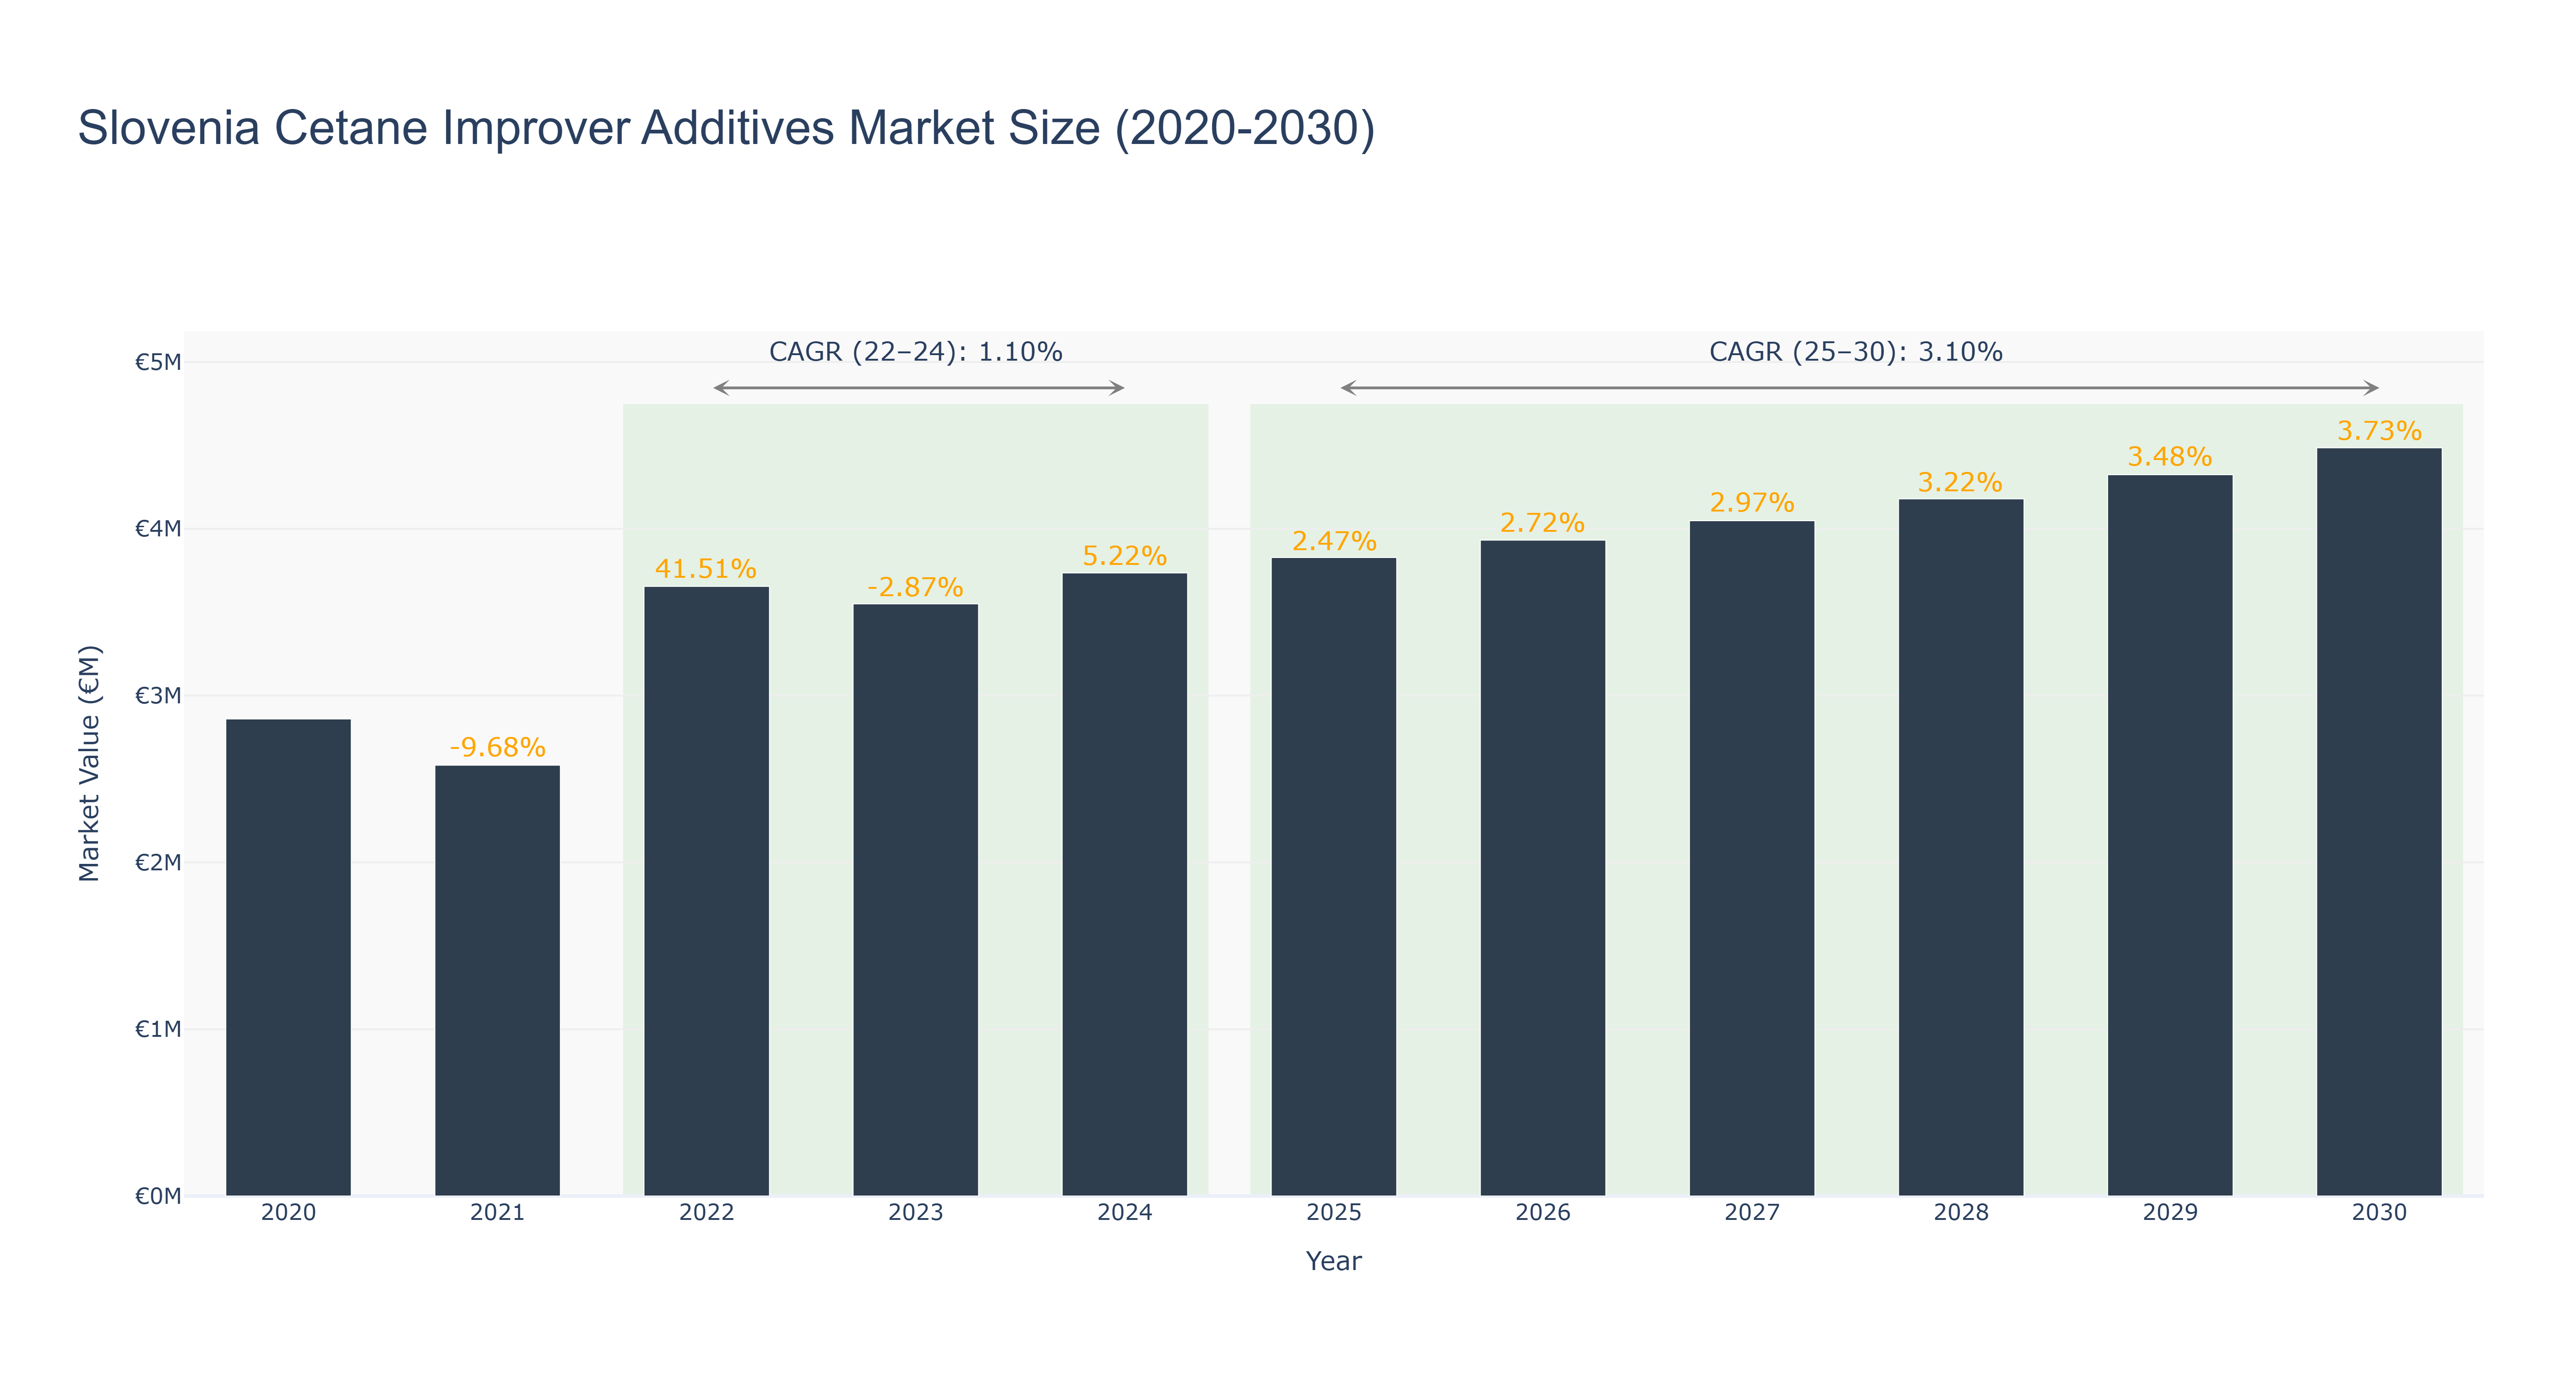
Slovenia's Cetane Improver Additives Market has shown a notable growth trajectory over the years. The peak market size of €4.49 million is projected for 2030, with a steady increase from €2.86 million in 2020 to €3.74 million in 2024. The forecasted growth from 2025 to 2030 indicates a promising CAGR of 3.10%. The market experienced a significant spike in 2022, attributed to increased demand for cetane improver additives in the automotive sector. The subsequent downturn in 2023 was likely influenced by market saturation and economic fluctuations. Looking ahead, Slovenia's market is set to benefit from ongoing infrastructure developments aimed at enhancing the country's energy efficiency standards, driving further demand for cetane improver additives. Industry drivers include the rising focus on environmental sustainability and the continuous advancements in automotive technologies, fueling the demand for high-quality additives. Future developments in Slovenia's market may include collaborations with international manufacturers to introduce innovative additive solutions tailored to meet stringent environmental regulations.
Slovenia Cetane Improver Additives Market: Production & Trade Performance (2019-2025)
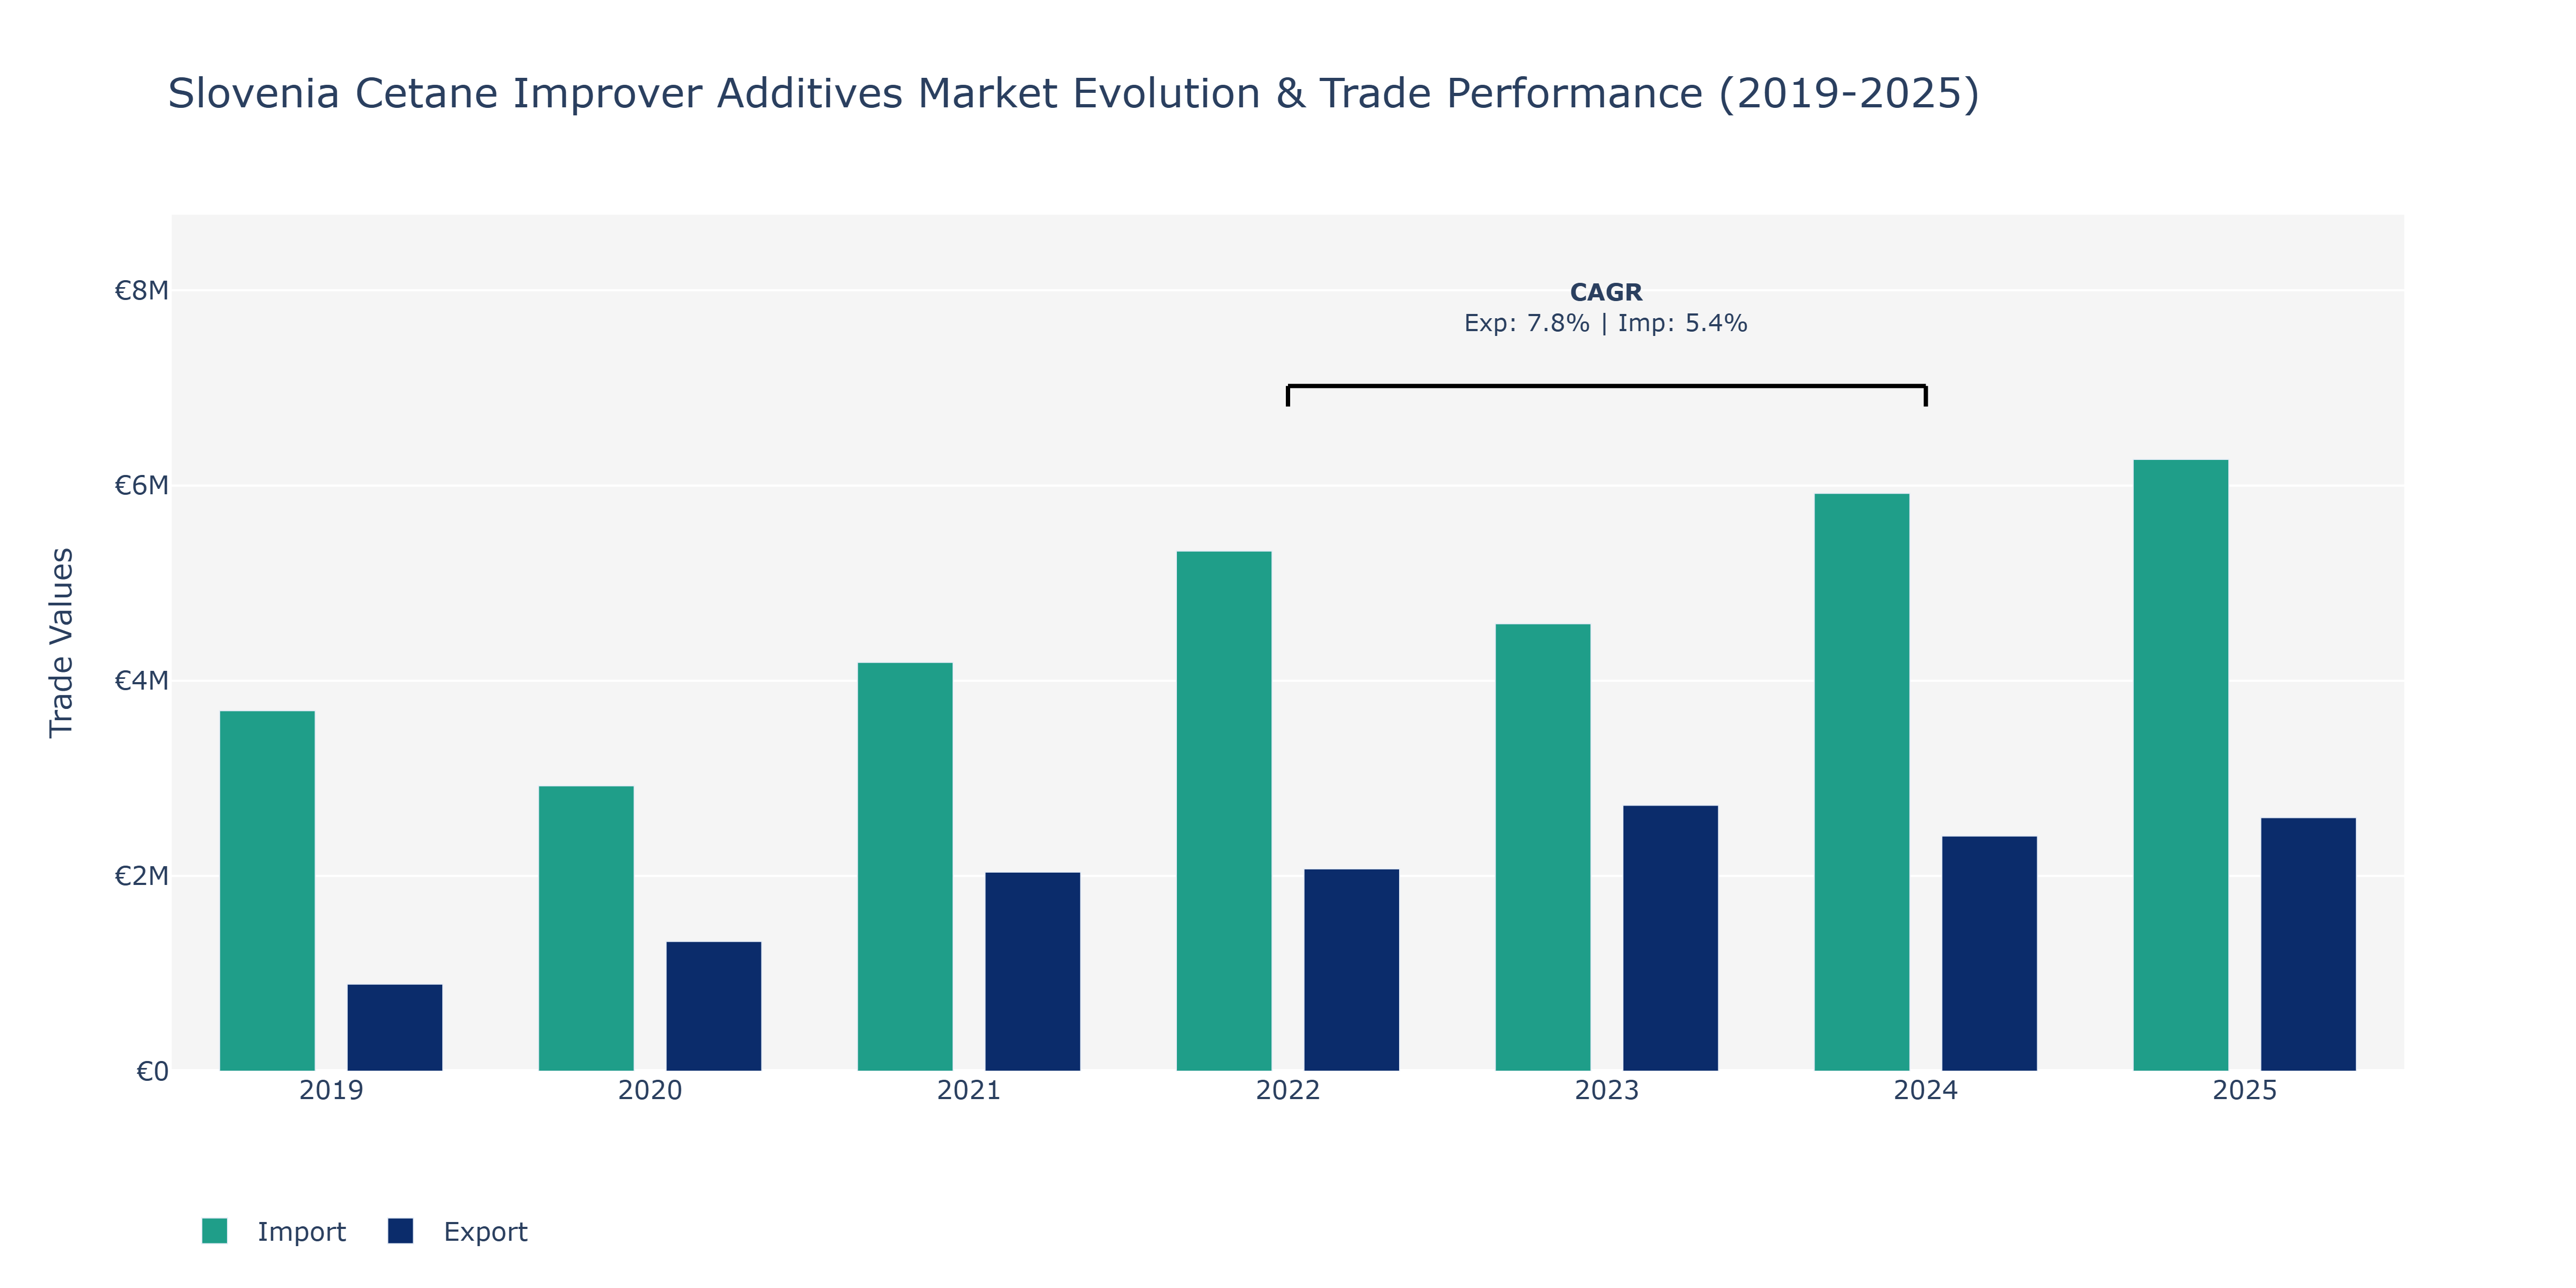
In the Slovenia Cetane Improver Additives Market, exports exhibited a consistent growth trajectory from 2019 to 2025, with a substantial increase from €891.84 thousand in 2019 to €2.6 million in 2025. This upward trend can be attributed to the rising demand for cetane improver additives in the global market, driven by the increasing focus on improving fuel efficiency and reducing emissions. On the other hand, imports followed a fluctuating pattern, reaching a peak of €6.27 million in 2025 after experiencing fluctuations in the preceding years. The surge in imports could stem from the need to meet the escalating domestic demand for advanced cetane improver additives, indicating a robust market for such products in Slovenia. The CAGR for exports and imports in the years 2022 to 2024 further underscores the market's growth potential, reflecting positively on the country's trade dynamics within the cetane improver additives sector.
Key Highlights of the Report:
- Slovenia Cetane Improver Additives Market Outlook
- Market Size of Slovenia Cetane Improver Additives Market, 2025
- Forecast of Slovenia Cetane Improver Additives Market, 2032
- Historical Data and Forecast of Slovenia Cetane Improver Additives Revenues & Volume for the Period 2022-2032F
- Slovenia Cetane Improver Additives Market Trend Evolution
- Slovenia Cetane Improver Additives Market Drivers and Challenges
- Slovenia Cetane Improver Additives Price Trends
- Slovenia Cetane Improver Additives Porter's Five Forces
- Slovenia Cetane Improver Additives Industry Life Cycle
- Historical Data and Forecast of Slovenia Cetane Improver Additives Market Revenues & Volume By Type for the Period 2022-2032F
- Historical Data and Forecast of Slovenia Cetane Improver Additives Market Revenues & Volume By 2-Ethylhexyl Nitrate for the Period 2022-2032F
- Historical Data and Forecast of Slovenia Cetane Improver Additives Market Revenues & Volume By Di-Tertiary Butyl Peroxide for the Period 2022-2032F
- Historical Data and Forecast of Slovenia Cetane Improver Additives Market Revenues & Volume By Others for the Period 2022-2032F
- Historical Data and Forecast of Slovenia Cetane Improver Additives Market Revenues & Volume By Diesel Type for the Period 2022-2032F
- Historical Data and Forecast of Slovenia Cetane Improver Additives Market Revenues & Volume By Petroleum for the Period 2022-2032F
- Historical Data and Forecast of Slovenia Cetane Improver Additives Market Revenues & Volume By Diesel for the Period 2022-2032F
- Historical Data and Forecast of Slovenia Cetane Improver Additives Market Revenues & Volume By Bio-Diesel for the Period 2022-2032F
- Historical Data and Forecast of Slovenia Cetane Improver Additives Market Revenues & Volume By Distribution Channel for the Period 2022-2032F
- Historical Data and Forecast of Slovenia Cetane Improver Additives Market Revenues & Volume By Online Sales for the Period 2022-2032F
- Historical Data and Forecast of Slovenia Cetane Improver Additives Market Revenues & Volume By Direct Sales/B2B Sales for the Period 2022-2032F
- Historical Data and Forecast of Slovenia Cetane Improver Additives Market Revenues & Volume By Retail Stores for the Period 2022-2032F
- Historical Data and Forecast of Slovenia Cetane Improver Additives Market Revenues & Volume By Others for the Period 2022-2032F
- Historical Data and Forecast of Slovenia Cetane Improver Additives Market Revenues & Volume By Application for the Period 2022-2032F
- Historical Data and Forecast of Slovenia Cetane Improver Additives Market Revenues & Volume By Direct Market for the Period 2022-2032F
- Historical Data and Forecast of Slovenia Cetane Improver Additives Market Revenues & Volume By After Market for the Period 2022-2032F
- Historical Data and Forecast of Slovenia Cetane Improver Additives Market Revenues & Volume By End Use for the Period 2022-2032F
- Historical Data and Forecast of Slovenia Cetane Improver Additives Market Revenues & Volume By Transportation for the Period 2022-2032F
- Historical Data and Forecast of Slovenia Cetane Improver Additives Market Revenues & Volume By Agriculture for the Period 2022-2032F
- Historical Data and Forecast of Slovenia Cetane Improver Additives Market Revenues & Volume By Power Generation for the Period 2022-2032F
- Historical Data and Forecast of Slovenia Cetane Improver Additives Market Revenues & Volume By Mining for the Period 2022-2032F
- Historical Data and Forecast of Slovenia Cetane Improver Additives Market Revenues & Volume By Construction for the Period 2022-2032F
- Historical Data and Forecast of Slovenia Cetane Improver Additives Market Revenues & Volume By Industrial for the Period 2022-2032F
- Historical Data and Forecast of Slovenia Cetane Improver Additives Market Revenues & Volume By Others for the Period 2022-2032F
- Slovenia Cetane Improver Additives Import Export Trade Statistics
- Market Opportunity Assessment By Type
- Market Opportunity Assessment By Diesel Type
- Market Opportunity Assessment By Distribution Channel
- Market Opportunity Assessment By Application
- Market Opportunity Assessment By End Use
- Slovenia Cetane Improver Additives Top Companies Market Share
- Slovenia Cetane Improver Additives Competitive Benchmarking By Technical and Operational Parameters
- Slovenia Cetane Improver Additives Company Profiles
- Slovenia Cetane Improver Additives Key Strategic Recommendations
Frequently Asked Questions About the Market Study (FAQs):
6Wresearch actively monitors the Slovenia Cetane Improver Additives Market and publishes its comprehensive annual report, highlighting emerging trends, growth drivers, revenue analysis, and forecast outlook. Our insights help businesses to make data-backed strategic decisions with ongoing market dynamics. Our analysts track relevent industries related to the Slovenia Cetane Improver Additives Market, allowing our clients with actionable intelligence and reliable forecasts tailored to emerging regional needs.
Yes, we provide customisation as per your requirements. To learn more, feel free to contact us on sales@6wresearch.com
1 Executive Summary |
2 Introduction |
2.1 Key Highlights of the Report |
2.2 Report Description |
2.3 Market Scope & Segmentation |
2.4 Research Methodology |
2.5 Assumptions |
3 Slovenia Cetane Improver Additives Market Overview |
3.1 Slovenia Country Macro Economic Indicators |
3.2 Slovenia Cetane Improver Additives Market Revenues & Volume, 2022 & 2032F |
3.3 Slovenia Cetane Improver Additives Market - Industry Life Cycle |
3.4 Slovenia Cetane Improver Additives Market - Porter's Five Forces |
3.5 Slovenia Cetane Improver Additives Market Revenues & Volume Share, By Type, 2022 & 2032F |
3.6 Slovenia Cetane Improver Additives Market Revenues & Volume Share, By Diesel Type, 2022 & 2032F |
3.7 Slovenia Cetane Improver Additives Market Revenues & Volume Share, By Distribution Channel, 2022 & 2032F |
3.8 Slovenia Cetane Improver Additives Market Revenues & Volume Share, By Application, 2022 & 2032F |
3.9 Slovenia Cetane Improver Additives Market Revenues & Volume Share, By End Use, 2022 & 2032F |
4 Slovenia Cetane Improver Additives Market Dynamics |
4.1 Impact Analysis |
4.2 Market Drivers |
4.2.1 Increasing demand for high-quality diesel fuel in Slovenia |
4.2.2 Stringent government regulations mandating improved fuel quality standards |
4.2.3 Growing awareness among consumers about the benefits of cetane improver additives |
4.3 Market Restraints |
4.3.1 Fluctuating crude oil prices impacting the cost of production for cetane improver additives |
4.3.2 Limited availability of raw materials for manufacturing cetane improver additives |
4.3.3 Competition from alternative fuel additives in the market |
5 Slovenia Cetane Improver Additives Market Trends |
6 Slovenia Cetane Improver Additives Market, By Types |
6.1 Slovenia Cetane Improver Additives Market, By Type |
6.1.1 Overview and Analysis |
6.1.2 Slovenia Cetane Improver Additives Market Revenues & Volume, By Type, 2022-2032F |
6.1.3 Slovenia Cetane Improver Additives Market Revenues & Volume, By 2-Ethylhexyl Nitrate, 2022-2032F |
6.1.4 Slovenia Cetane Improver Additives Market Revenues & Volume, By Di-Tertiary Butyl Peroxide, 2022-2032F |
6.1.5 Slovenia Cetane Improver Additives Market Revenues & Volume, By Others, 2022-2032F |
6.2 Slovenia Cetane Improver Additives Market, By Diesel Type |
6.2.1 Overview and Analysis |
6.2.2 Slovenia Cetane Improver Additives Market Revenues & Volume, By Petroleum, 2022-2032F |
6.2.3 Slovenia Cetane Improver Additives Market Revenues & Volume, By Diesel, 2022-2032F |
6.2.4 Slovenia Cetane Improver Additives Market Revenues & Volume, By Bio-Diesel, 2022-2032F |
6.3 Slovenia Cetane Improver Additives Market, By Distribution Channel |
6.3.1 Overview and Analysis |
6.3.2 Slovenia Cetane Improver Additives Market Revenues & Volume, By Online Sales, 2022-2032F |
6.3.3 Slovenia Cetane Improver Additives Market Revenues & Volume, By Direct Sales/B2B Sales, 2022-2032F |
6.3.4 Slovenia Cetane Improver Additives Market Revenues & Volume, By Retail Stores, 2022-2032F |
6.3.5 Slovenia Cetane Improver Additives Market Revenues & Volume, By Others, 2022-2032F |
6.4 Slovenia Cetane Improver Additives Market, By Application |
6.4.1 Overview and Analysis |
6.4.2 Slovenia Cetane Improver Additives Market Revenues & Volume, By Direct Market, 2022-2032F |
6.4.3 Slovenia Cetane Improver Additives Market Revenues & Volume, By After Market, 2022-2032F |
6.5 Slovenia Cetane Improver Additives Market, By End Use |
6.5.1 Overview and Analysis |
6.5.2 Slovenia Cetane Improver Additives Market Revenues & Volume, By Transportation, 2022-2032F |
6.5.3 Slovenia Cetane Improver Additives Market Revenues & Volume, By Agriculture, 2022-2032F |
6.5.4 Slovenia Cetane Improver Additives Market Revenues & Volume, By Power Generation, 2022-2032F |
6.5.5 Slovenia Cetane Improver Additives Market Revenues & Volume, By Mining, 2022-2032F |
6.5.6 Slovenia Cetane Improver Additives Market Revenues & Volume, By Construction, 2022-2032F |
6.5.7 Slovenia Cetane Improver Additives Market Revenues & Volume, By Industrial, 2022-2032F |
7 Slovenia Cetane Improver Additives Market Import-Export Trade Statistics |
7.1 Slovenia Cetane Improver Additives Market Export to Major Countries |
7.2 Slovenia Cetane Improver Additives Market Imports from Major Countries |
8 Slovenia Cetane Improver Additives Market Key Performance Indicators |
8.1 Average cetane number of diesel fuel in Slovenia |
8.2 Number of vehicles using diesel fuel with cetane improver additives |
8.3 Percentage increase in adoption of cetane improver additives in the Slovenian market |
9 Slovenia Cetane Improver Additives Market - Opportunity Assessment |
9.1 Slovenia Cetane Improver Additives Market Opportunity Assessment, By Type, 2022 & 2032F |
9.2 Slovenia Cetane Improver Additives Market Opportunity Assessment, By Diesel Type, 2022 & 2032F |
9.3 Slovenia Cetane Improver Additives Market Opportunity Assessment, By Distribution Channel, 2022 & 2032F |
9.4 Slovenia Cetane Improver Additives Market Opportunity Assessment, By Application, 2022 & 2032F |
9.5 Slovenia Cetane Improver Additives Market Opportunity Assessment, By End Use, 2022 & 2032F |
10 Slovenia Cetane Improver Additives Market - Competitive Landscape |
10.1 Slovenia Cetane Improver Additives Market Revenue Share, By Companies, 2025 |
10.2 Slovenia Cetane Improver Additives Market Competitive Benchmarking, By Operating and Technical Parameters |
11 Company Profiles |
12 Recommendations |
13 Disclaimer |
Export potential assessment - trade Analytics for 2030
Export potential enables firms to identify high-growth global markets with greater confidence by combining advanced trade intelligence with a structured quantitative methodology. The framework analyzes emerging demand trends and country-level import patterns while integrating macroeconomic and trade datasets such as GDP and population forecasts, bilateral import–export flows, tariff structures, elasticity differentials between developed and developing economies, geographic distance, and import demand projections. Using weighted trade values from 2020–2024 as the base period to project country-to-country export potential for 2030, these inputs are operationalized through calculated drivers such as gravity model parameters, tariff impact factors, and projected GDP per-capita growth. Through an analysis of hidden potentials, demand hotspots, and market conditions that are most favorable to success, this method enables firms to focus on target countries, maximize returns, and global expansion with data, backed by accuracy.
By factoring in the projected importer demand gap that is currently unmet and could be potential opportunity, it identifies the potential for the Exporter (Country) among 190 countries, against the general trade analysis, which identifies the biggest importer or exporter.
To discover high-growth global markets and optimize your business strategy:
Click Here
Pricing
- Single User License$ 1,995
- Department License$ 2,400
- Site License$ 3,120
- Global License$ 3,795

Search
Thought Leadership and Analyst Meet


Our Clients
Latest Reports
- Philippines Polyhydroxybutyrate-co-Hydroxyvalerate Market (2026-2032) | Trends, Insights, Challenges, Restraints, Competition, Size, Value, Forecast, Pricing, Share, Outlook, Revenue, Investment Opportunities, Strategy, Drivers, Demand, Growth, segmentation, Analysis, Companies
- Peru Polyhydroxybutyrate-co-Hydroxyvalerate Market (2026-2032) | Growth, Demand, Challenges, Share, Trends, Analysis, Pricing, Investment Opportunities, Drivers, Value, Forecast, Competition, Size, Companies, Insights, Outlook, Restraints, segmentation, Revenue, Strategy
- Pakistan Polyhydroxybutyrate-co-Hydroxyvalerate Market (2026-2032) | Restraints, segmentation, Pricing, Forecast, Share, Strategy, Competition, Trends, Insights, Drivers, Challenges, Growth, Revenue, Outlook, Value, Investment Opportunities, Companies, Size, Analysis, Demand
- Oman Polyhydroxybutyrate-co-Hydroxyvalerate Market (2026-2032) | Drivers, segmentation, Insights, Competition, Pricing, Outlook, Size, Revenue, Challenges, Forecast, Analysis, Growth, Value, Share, Trends, Investment Opportunities, Strategy, Restraints, Companies, Demand
- Nigeria Polyhydroxybutyrate-co-Hydroxyvalerate Market (2026-2032) | Value, Investment Opportunities, Analysis, Revenue, Restraints, Pricing, Outlook, Competition, Demand, Growth, Forecast, Companies, Trends, Challenges, segmentation, Drivers, Insights, Share, Size, Strategy
- Nepal Polyhydroxybutyrate-co-Hydroxyvalerate Market (2026-2032) | Insights, Analysis, Drivers, Share, Revenue, Demand, segmentation, Investment Opportunities, Competition, Forecast, Growth, Pricing, Companies, Strategy, Trends, Restraints, Challenges, Outlook, Size, Value
- Myanmar Polyhydroxybutyrate-co-Hydroxyvalerate Market (2026-2032) | Outlook, Revenue, Strategy, Restraints, Drivers, segmentation, Share, Forecast, Competition, Insights, Growth, Pricing, Size, Demand, Value, Companies, Trends, Challenges, Investment Opportunities, Analysis
- Morocco Polyhydroxybutyrate-co-Hydroxyvalerate Market (2026-2032) | Outlook, Investment Opportunities, Restraints, Strategy, Forecast, Challenges, Drivers, Growth, Companies, segmentation, Trends, Size, Competition, Revenue, Demand, Insights, Share, Analysis, Value, Pricing
- Mexico Polyhydroxybutyrate-co-Hydroxyvalerate Market (2026-2032) | Size, Drivers, Outlook, Share, Strategy, Growth, Pricing, Challenges, Companies, Demand, Value, Investment Opportunities, Restraints, Trends, Forecast, segmentation, Analysis, Insights, Competition, Revenue
- Malaysia Polyhydroxybutyrate-co-Hydroxyvalerate Market (2026-2032) | Share, segmentation, Size, Companies, Analysis, Insights, Forecast, Value, Revenue, Drivers, Restraints, Challenges, Investment Opportunities, Trends, Competition, Strategy, Demand, Growth, Outlook, Pricing
Industry Events and Analyst Meet

HIMTEX 2026

India Refining Summit 2026

India EV Show 2026

EV tech India Expo 2026

Auto Tech Asia 2026
Whitepaper
- Middle East & Africa Commercial Security Market Click here to view more.
- Middle East & Africa Fire Safety Systems & Equipment Market Click here to view more.
- GCC Drone Market Click here to view more.
- Middle East Lighting Fixture Market Click here to view more.
- GCC Physical & Perimeter Security Market Click here to view more.
6WResearch In News
- Doha a strategic location for EV manufacturing hub: IPA Qatar
- Demand for luxury TVs surging in the GCC, says Samsung
- Empowering Growth: The Thriving Journey of Bangladesh’s Cable Industry
- Demand for luxury TVs surging in the GCC, says Samsung
- Video call with a traditional healer? Once unthinkable, it’s now common in South Africa
- Intelligent Buildings To Smooth GCC’s Path To Net Zero