Slovenia Marine Ingredients Market (2026-2032) | Competition, Opportunities, Value, Strategic Insights, Restraints, Demand, Share, Industry, Segments, Challenges, Strategy, Revenue, Competitive, Drivers, Forecast, Companies, Pricing Analysis, Supply, Segmentation, Investment Trends, Size, Trends, Outlook, Growth, Analysis, Consumer Insights
Market Forecast By Type (Fish Protein, Omega-3 Oils, Marine Collagen), By Source (Fish, Marine Algae, Shellfish), By Application (Supplements, Pharmaceuticals, Cosmetics), By End User (Food Industry, Healthcare, Beauty & Personal Care) And Competitive Landscape
| Product Code: ETC12919140 | Publication Date: Apr 2025 | Updated Date: Apr 2026 | Product Type: Market Research Report | |
| Publisher: 6Wresearch | Author: Sachin Kumar Rai | No. of Pages: 65 | No. of Figures: 34 | No. of Tables: 19 |
Slovenia Marine Ingredients Market Size (2020-2030)
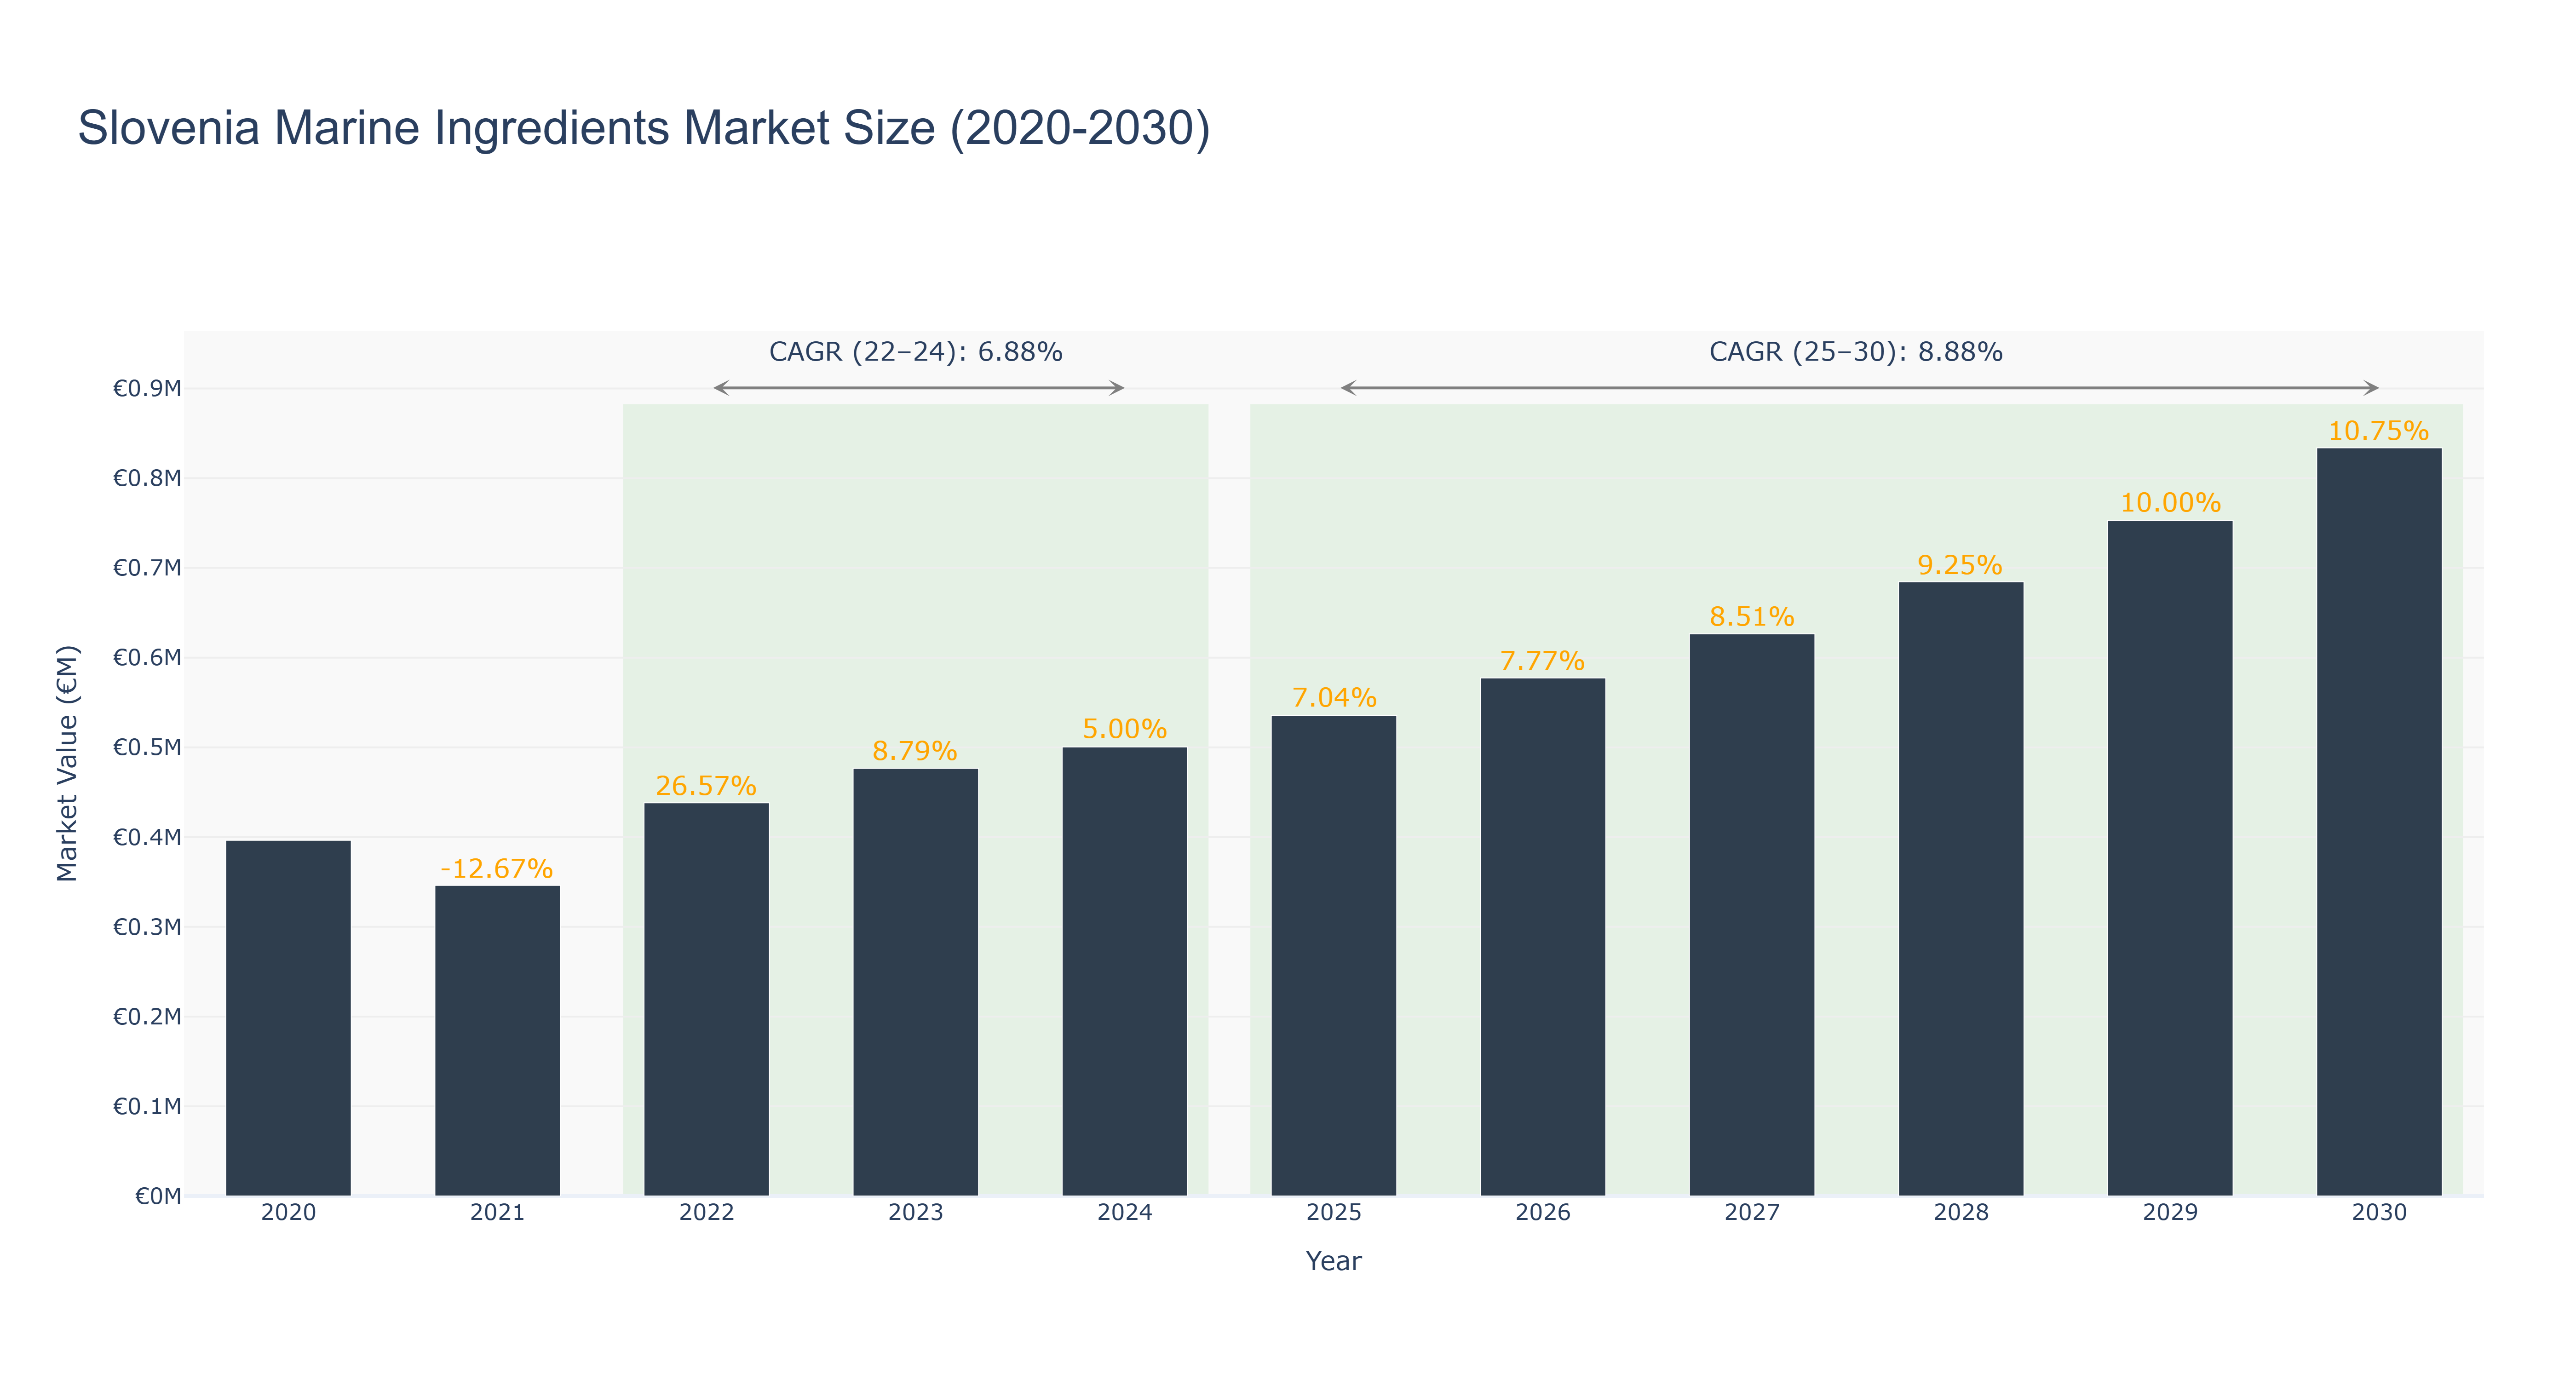
The Slovenia Marine Ingredients Market has shown a steady growth trajectory over the years. The peak market size of €0.83 million is projected for 2030, with a consistent upward trend in market size from €0.40 million in 2020 to €0.50 million in 2024. The forecasted market size is expected to reach €0.75 million by 2029 and peak at €0.83 million in 2030. The CAGR values for the periods 2022-24 and 2025-30 stand at 6.88% and 8.88% respectively. The market's growth can be attributed to increasing consumer awareness about marine ingredients' health benefits and the growing demand for natural products in the food and pharmaceutical industries. Looking ahead, Slovenia is set to launch a national campaign promoting sustainable fishing practices and marine conservation efforts to further boost the marine ingredients market.
Slovenia Marine Ingredients Market: Production & Trade Performance (2019-2025)
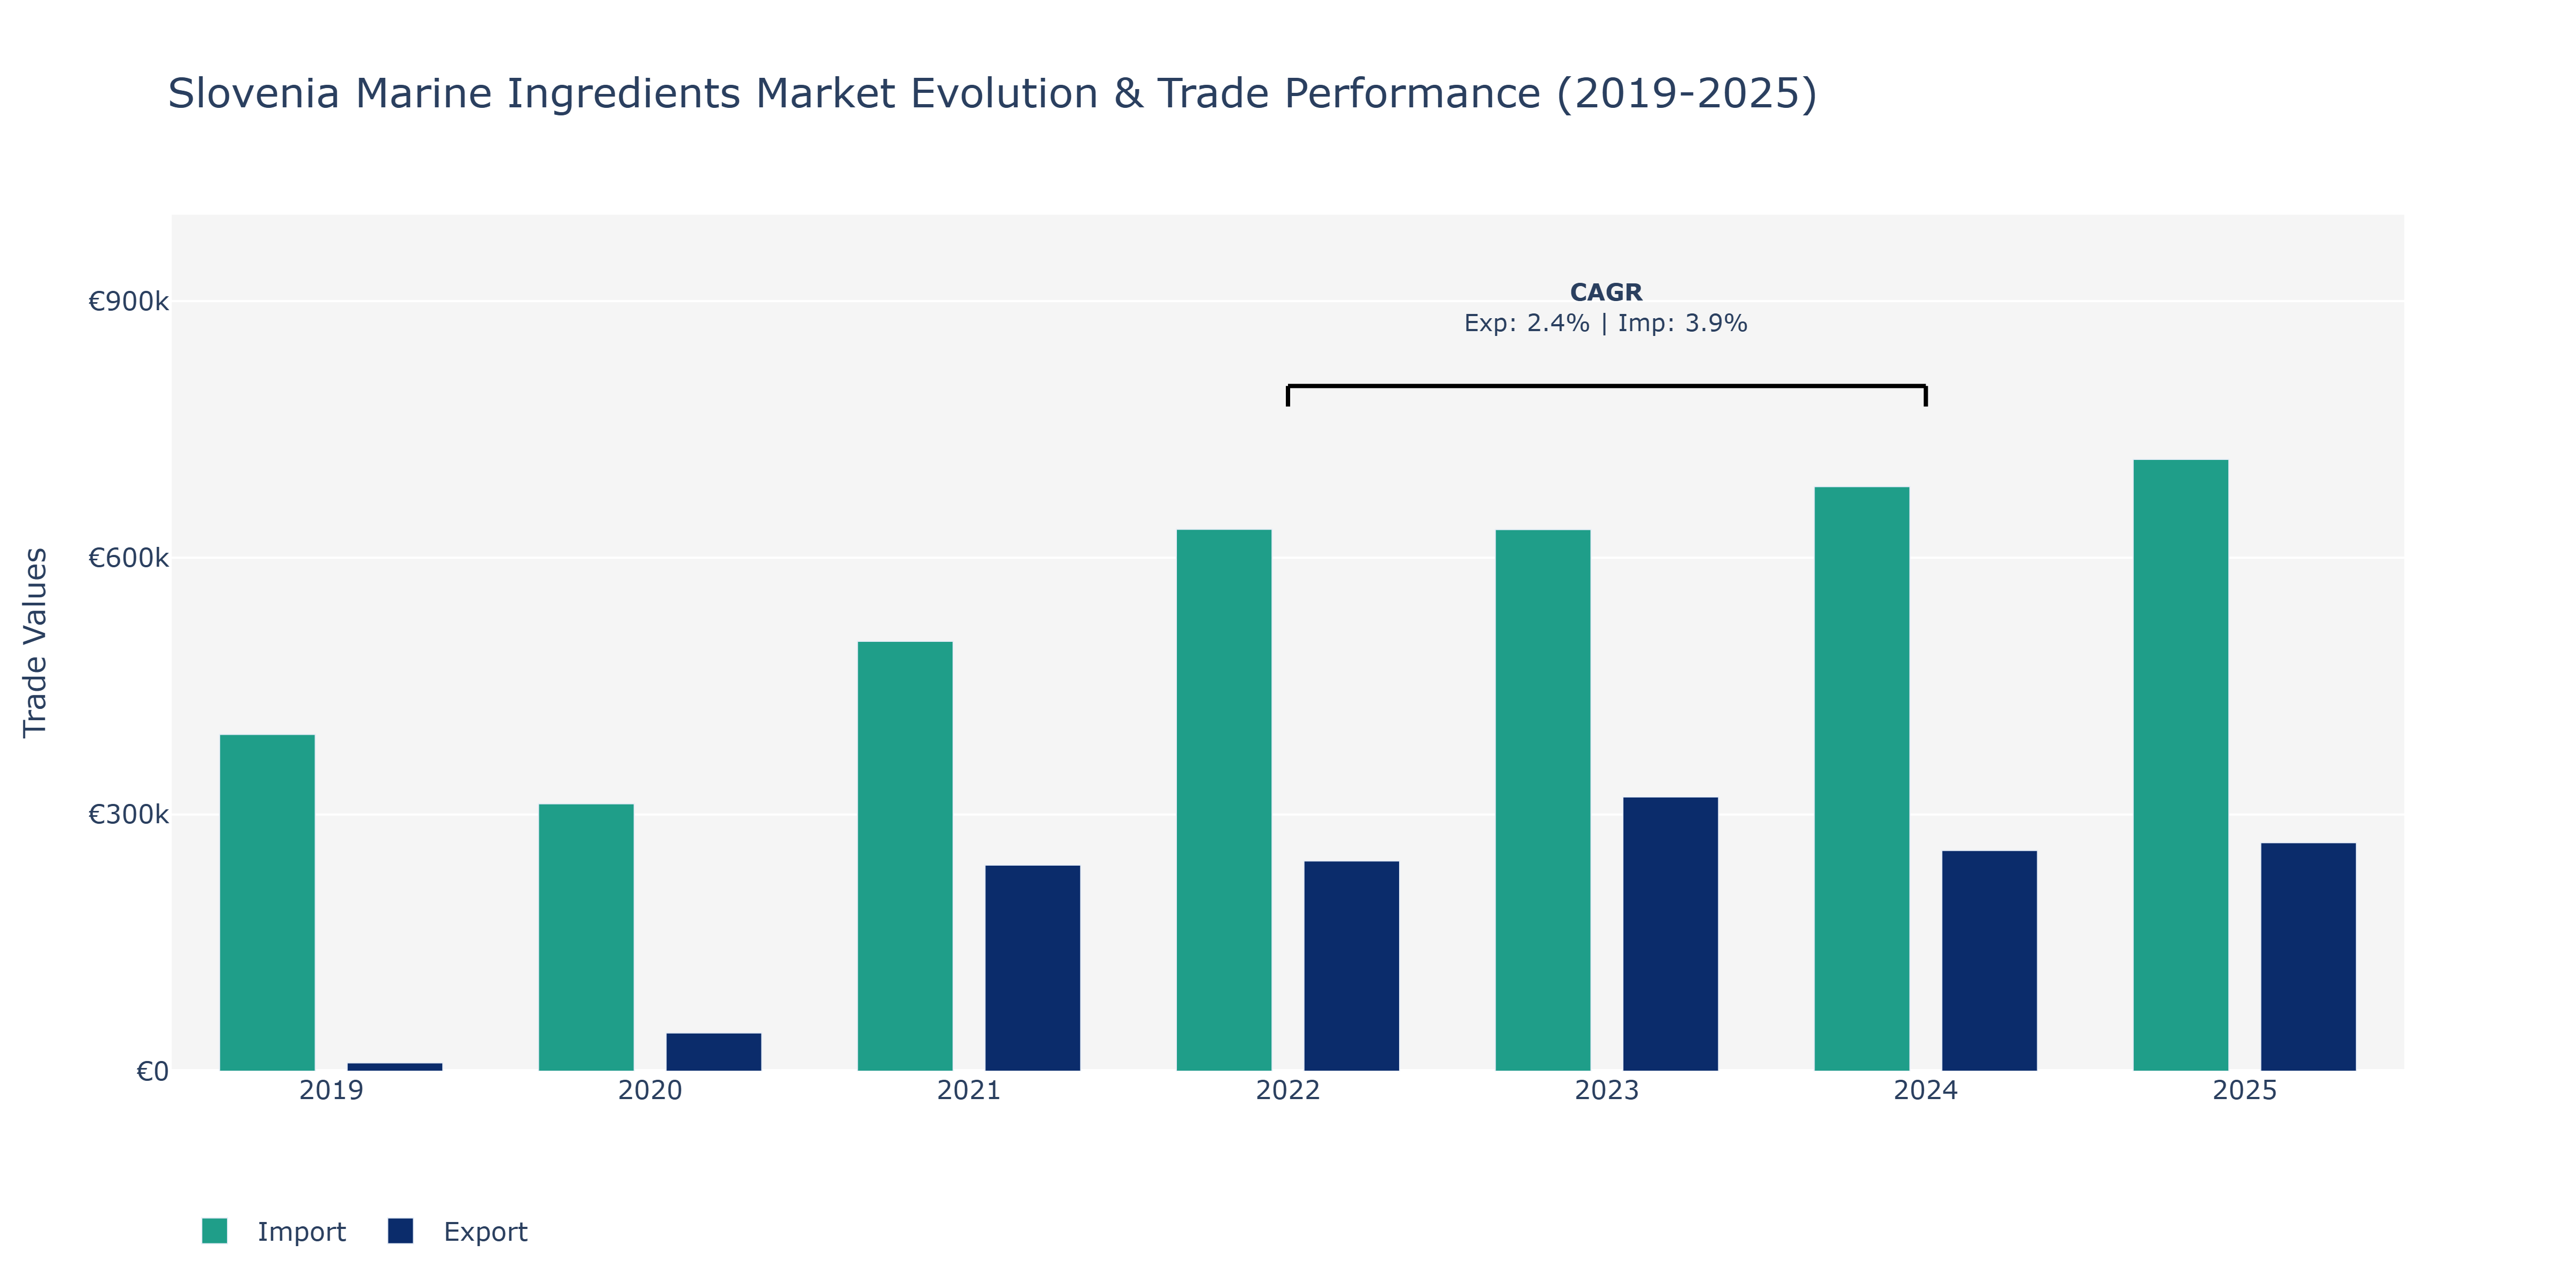
Between 2019 and 2025, Slovenia's Marine Ingredients Market witnessed notable shifts in both exports and imports. Exports surged from €9.69 thousand in 2019 to around €266.99 thousand in 2025, showcasing a fluctuating pattern with peaks observed in 2021 and 2023. Conversely, imports displayed a different trajectory, starting at €393.52 thousand in 2019, dipping to €312.44 thousand in 2020, then steadily increasing to €714.95 thousand in 2025, marking consistent growth year on year. The rise in exports could be attributed to Slovenia's increased focus on promoting its marine products globally, potentially driven by rising demand for high-quality seafood ingredients. On the other hand, the escalating imports signify the country's growing appetite for foreign marine ingredients to meet domestic demand or support local production. The CAGRs of 2.44% for exports and 3.86% for imports during 2022-2024 indicate a modest growth rate for both segments, supporting the market's overall positive momentum. This trend aligns with global predictions pointing towards the seafood industry's expanding market size and value due to evolving consumer preferences and the industry's emphasis on sustainability and innovation.
Key Highlights of the Report:
- Slovenia Marine Ingredients Market Outlook
- Market Size of Slovenia Marine Ingredients Market, 2025
- Forecast of Slovenia Marine Ingredients Market, 2032
- Historical Data and Forecast of Slovenia Marine Ingredients Revenues & Volume for the Period 2022-2032F
- Slovenia Marine Ingredients Market Trend Evolution
- Slovenia Marine Ingredients Market Drivers and Challenges
- Slovenia Marine Ingredients Price Trends
- Slovenia Marine Ingredients Porter's Five Forces
- Slovenia Marine Ingredients Industry Life Cycle
- Historical Data and Forecast of Slovenia Marine Ingredients Market Revenues & Volume By Type for the Period 2022-2032F
- Historical Data and Forecast of Slovenia Marine Ingredients Market Revenues & Volume By Fish Protein for the Period 2022-2032F
- Historical Data and Forecast of Slovenia Marine Ingredients Market Revenues & Volume By Omega-3 Oils for the Period 2022-2032F
- Historical Data and Forecast of Slovenia Marine Ingredients Market Revenues & Volume By Marine Collagen for the Period 2022-2032F
- Historical Data and Forecast of Slovenia Marine Ingredients Market Revenues & Volume By Source for the Period 2022-2032F
- Historical Data and Forecast of Slovenia Marine Ingredients Market Revenues & Volume By Fish for the Period 2022-2032F
- Historical Data and Forecast of Slovenia Marine Ingredients Market Revenues & Volume By Marine Algae for the Period 2022-2032F
- Historical Data and Forecast of Slovenia Marine Ingredients Market Revenues & Volume By Shellfish for the Period 2022-2032F
- Historical Data and Forecast of Slovenia Marine Ingredients Market Revenues & Volume By Application for the Period 2022-2032F
- Historical Data and Forecast of Slovenia Marine Ingredients Market Revenues & Volume By Supplements for the Period 2022-2032F
- Historical Data and Forecast of Slovenia Marine Ingredients Market Revenues & Volume By Pharmaceuticals for the Period 2022-2032F
- Historical Data and Forecast of Slovenia Marine Ingredients Market Revenues & Volume By Cosmetics for the Period 2022-2032F
- Historical Data and Forecast of Slovenia Marine Ingredients Market Revenues & Volume By End User for the Period 2022-2032F
- Historical Data and Forecast of Slovenia Marine Ingredients Market Revenues & Volume By Food Industry for the Period 2022-2032F
- Historical Data and Forecast of Slovenia Marine Ingredients Market Revenues & Volume By Healthcare for the Period 2022-2032F
- Historical Data and Forecast of Slovenia Marine Ingredients Market Revenues & Volume By Beauty & Personal Care for the Period 2022-2032F
- Slovenia Marine Ingredients Import Export Trade Statistics
- Market Opportunity Assessment By Type
- Market Opportunity Assessment By Source
- Market Opportunity Assessment By Application
- Market Opportunity Assessment By End User
- Slovenia Marine Ingredients Top Companies Market Share
- Slovenia Marine Ingredients Competitive Benchmarking By Technical and Operational Parameters
- Slovenia Marine Ingredients Company Profiles
- Slovenia Marine Ingredients Key Strategic Recommendations
Frequently Asked Questions About the Market Study (FAQs):
6Wresearch actively monitors the Slovenia Marine Ingredients Market and publishes its comprehensive annual report, highlighting emerging trends, growth drivers, revenue analysis, and forecast outlook. Our insights help businesses to make data-backed strategic decisions with ongoing market dynamics. Our analysts track relevent industries related to the Slovenia Marine Ingredients Market, allowing our clients with actionable intelligence and reliable forecasts tailored to emerging regional needs.
Yes, we provide customisation as per your requirements. To learn more, feel free to contact us on sales@6wresearch.com
1 Executive Summary |
2 Introduction |
2.1 Key Highlights of the Report |
2.2 Report Description |
2.3 Market Scope & Segmentation |
2.4 Research Methodology |
2.5 Assumptions |
3 Slovenia Marine Ingredients Market Overview |
3.1 Slovenia Country Macro Economic Indicators |
3.2 Slovenia Marine Ingredients Market Revenues & Volume, 2022 & 2032F |
3.3 Slovenia Marine Ingredients Market - Industry Life Cycle |
3.4 Slovenia Marine Ingredients Market - Porter's Five Forces |
3.5 Slovenia Marine Ingredients Market Revenues & Volume Share, By Type, 2022 & 2032F |
3.6 Slovenia Marine Ingredients Market Revenues & Volume Share, By Source, 2022 & 2032F |
3.7 Slovenia Marine Ingredients Market Revenues & Volume Share, By Application, 2022 & 2032F |
3.8 Slovenia Marine Ingredients Market Revenues & Volume Share, By End User, 2022 & 2032F |
4 Slovenia Marine Ingredients Market Dynamics |
4.1 Impact Analysis |
4.2 Market Drivers |
4.2.1 Increasing consumer awareness about the health benefits of marine ingredients |
4.2.2 Growing demand for natural and sustainable ingredients in the food and beverage industry |
4.2.3 Rising popularity of seafood-based cuisine and products in Slovenia |
4.3 Market Restraints |
4.3.1 Seasonal availability and environmental factors affecting marine ingredient supply |
4.3.2 Regulatory challenges and compliance requirements for sourcing and utilizing marine ingredients |
5 Slovenia Marine Ingredients Market Trends |
6 Slovenia Marine Ingredients Market, By Types |
6.1 Slovenia Marine Ingredients Market, By Type |
6.1.1 Overview and Analysis |
6.1.2 Slovenia Marine Ingredients Market Revenues & Volume, By Type, 2022 - 2032F |
6.1.3 Slovenia Marine Ingredients Market Revenues & Volume, By Fish Protein, 2022 - 2032F |
6.1.4 Slovenia Marine Ingredients Market Revenues & Volume, By Omega-3 Oils, 2022 - 2032F |
6.1.5 Slovenia Marine Ingredients Market Revenues & Volume, By Marine Collagen, 2022 - 2032F |
6.2 Slovenia Marine Ingredients Market, By Source |
6.2.1 Overview and Analysis |
6.2.2 Slovenia Marine Ingredients Market Revenues & Volume, By Fish, 2022 - 2032F |
6.2.3 Slovenia Marine Ingredients Market Revenues & Volume, By Marine Algae, 2022 - 2032F |
6.2.4 Slovenia Marine Ingredients Market Revenues & Volume, By Shellfish, 2022 - 2032F |
6.3 Slovenia Marine Ingredients Market, By Application |
6.3.1 Overview and Analysis |
6.3.2 Slovenia Marine Ingredients Market Revenues & Volume, By Supplements, 2022 - 2032F |
6.3.3 Slovenia Marine Ingredients Market Revenues & Volume, By Pharmaceuticals, 2022 - 2032F |
6.3.4 Slovenia Marine Ingredients Market Revenues & Volume, By Cosmetics, 2022 - 2032F |
6.4 Slovenia Marine Ingredients Market, By End User |
6.4.1 Overview and Analysis |
6.4.2 Slovenia Marine Ingredients Market Revenues & Volume, By Food Industry, 2022 - 2032F |
6.4.3 Slovenia Marine Ingredients Market Revenues & Volume, By Healthcare, 2022 - 2032F |
6.4.4 Slovenia Marine Ingredients Market Revenues & Volume, By Beauty & Personal Care, 2022 - 2032F |
7 Slovenia Marine Ingredients Market Import-Export Trade Statistics |
7.1 Slovenia Marine Ingredients Market Export to Major Countries |
7.2 Slovenia Marine Ingredients Market Imports from Major Countries |
8 Slovenia Marine Ingredients Market Key Performance Indicators |
8.1 Sustainability metrics such as percentage of marine ingredients sourced from certified sustainable fisheries |
8.2 Consumer acceptance and adoption rates of new marine ingredient products |
8.3 Research and development investment in innovative marine ingredient technologies and products |
9 Slovenia Marine Ingredients Market - Opportunity Assessment |
9.1 Slovenia Marine Ingredients Market Opportunity Assessment, By Type, 2022 & 2032F |
9.2 Slovenia Marine Ingredients Market Opportunity Assessment, By Source, 2022 & 2032F |
9.3 Slovenia Marine Ingredients Market Opportunity Assessment, By Application, 2022 & 2032F |
9.4 Slovenia Marine Ingredients Market Opportunity Assessment, By End User, 2022 & 2032F |
10 Slovenia Marine Ingredients Market - Competitive Landscape |
10.1 Slovenia Marine Ingredients Market Revenue Share, By Companies, 2025 |
10.2 Slovenia Marine Ingredients Market Competitive Benchmarking, By Operating and Technical Parameters |
11 Company Profiles |
12 Recommendations |
13 Disclaimer |
Export potential assessment - trade Analytics for 2030
Export potential enables firms to identify high-growth global markets with greater confidence by combining advanced trade intelligence with a structured quantitative methodology. The framework analyzes emerging demand trends and country-level import patterns while integrating macroeconomic and trade datasets such as GDP and population forecasts, bilateral import–export flows, tariff structures, elasticity differentials between developed and developing economies, geographic distance, and import demand projections. Using weighted trade values from 2020–2024 as the base period to project country-to-country export potential for 2030, these inputs are operationalized through calculated drivers such as gravity model parameters, tariff impact factors, and projected GDP per-capita growth. Through an analysis of hidden potentials, demand hotspots, and market conditions that are most favorable to success, this method enables firms to focus on target countries, maximize returns, and global expansion with data, backed by accuracy.
By factoring in the projected importer demand gap that is currently unmet and could be potential opportunity, it identifies the potential for the Exporter (Country) among 190 countries, against the general trade analysis, which identifies the biggest importer or exporter.
To discover high-growth global markets and optimize your business strategy:
Click Here
Pricing
- Single User License$ 1,995
- Department License$ 2,400
- Site License$ 3,120
- Global License$ 3,795

Search
Thought Leadership and Analyst Meet


Our Clients
Latest Reports
- France Thermally Conductive Filler Dispersants Market (2026-2032) | Challenges, Restraints, Value, Share, Size, segmentation, Analysis, Trends, Investment Opportunities, Outlook, Pricing, Demand, Forecast, Revenue, Companies, Growth, Drivers, Strategy, Insights, Competition
- Egypt Thermally Conductive Filler Dispersants Market (2026-2032) | Competition, Forecast, Strategy, Value, Insights, Outlook, Investment Opportunities, Pricing, Demand, Share, segmentation, Drivers, Size, Companies, Restraints, Growth, Trends, Revenue, Challenges, Analysis
- Czech Republic Thermally Conductive Filler Dispersants Market (2026-2032) | Forecast, Pricing, Analysis, Drivers, Insights, Size, Demand, Growth, Challenges, segmentation, Competition, Outlook, Trends, Investment Opportunities, Companies, Strategy, Revenue, Share, Value, Restraints
- Colombia Thermally Conductive Filler Dispersants Market (2026-2032) | segmentation, Trends, Share, Drivers, Strategy, Companies, Demand, Insights, Size, Challenges, Value, Competition, Analysis, Growth, Revenue, Restraints, Forecast, Pricing, Outlook, Investment Opportunities
- China Thermally Conductive Filler Dispersants Market (2026-2032) | Restraints, Investment Opportunities, Pricing, Companies, Share, Size, Challenges, Trends, Outlook, Value, Analysis, Competition, Revenue, Drivers, Forecast, Demand, Insights, Growth, Strategy, segmentation
- Chile Thermally Conductive Filler Dispersants Market (2026-2032) | Investment Opportunities, Trends, Value, Restraints, Share, Companies, Forecast, segmentation, Pricing, Challenges, Demand, Size, Analysis, Drivers, Outlook, Growth, Competition, Strategy, Revenue, Insights
- Cambodia Thermally Conductive Filler Dispersants Market (2026-2032) | Analysis, Share, Outlook, Strategy, Pricing, Demand, Size, Growth, segmentation, Insights, Revenue, Forecast, Challenges, Competition, Companies, Investment Opportunities, Trends, Restraints, Value, Drivers
- Brazil Thermally Conductive Filler Dispersants Market (2026-2032) | Restraints, Forecast, Competition, Size, Revenue, Value, Investment Opportunities, Trends, Insights, Outlook, Growth, Analysis, Drivers, segmentation, Pricing, Challenges, Strategy, Share, Companies, Demand
- Bangladesh Thermally Conductive Filler Dispersants Market (2026-2032) | Restraints, Trends, Analysis, Competition, Insights, Forecast, Value, Investment Opportunities, Pricing, Share, Demand, Outlook, Revenue, segmentation, Companies, Drivers, Growth, Size, Challenges, Strategy
- Bahrain Thermally Conductive Filler Dispersants Market (2026-2032) | Trends, Outlook, Pricing, Demand, Value, Competition, Forecast, Growth, segmentation, Revenue, Companies, Analysis, Insights, Size, Drivers, Challenges, Strategy, Investment Opportunities, Share, Restraints
Industry Events and Analyst Meet

HIMTEX 2026

India Refining Summit 2026

India EV Show 2026

EV tech India Expo 2026

Auto Tech Asia 2026
Whitepaper
- Middle East & Africa Commercial Security Market Click here to view more.
- Middle East & Africa Fire Safety Systems & Equipment Market Click here to view more.
- GCC Drone Market Click here to view more.
- Middle East Lighting Fixture Market Click here to view more.
- GCC Physical & Perimeter Security Market Click here to view more.
6WResearch In News
- Doha a strategic location for EV manufacturing hub: IPA Qatar
- Demand for luxury TVs surging in the GCC, says Samsung
- Empowering Growth: The Thriving Journey of Bangladesh’s Cable Industry
- Demand for luxury TVs surging in the GCC, says Samsung
- Video call with a traditional healer? Once unthinkable, it’s now common in South Africa
- Intelligent Buildings To Smooth GCC’s Path To Net Zero