Slovenia Mixed Flow Pump Market (2026-2032) | Trends, Value, Competitive Landscape, Share, Forecast, Segmentation, Companies, Industry, Analysis, Growth, Outlook, Size & Revenue
Market Forecast By Configuration (Single-stage, Multi-stage), By End-use (Agriculture, Construction & Building Services, Water & Wastewater, Power Generation, Oil & Gas, Chemical) And Competitive Landscape
| Product Code: ETC9321721 | Publication Date: Sep 2024 | Updated Date: Apr 2026 | Product Type: Market Research Report | |
| Publisher: 6Wresearch | Author: Dhaval Chaurasia | No. of Pages: 75 | No. of Figures: 35 | No. of Tables: 20 |
Slovenia Mixed Flow Pump Market Size (2020-2030)
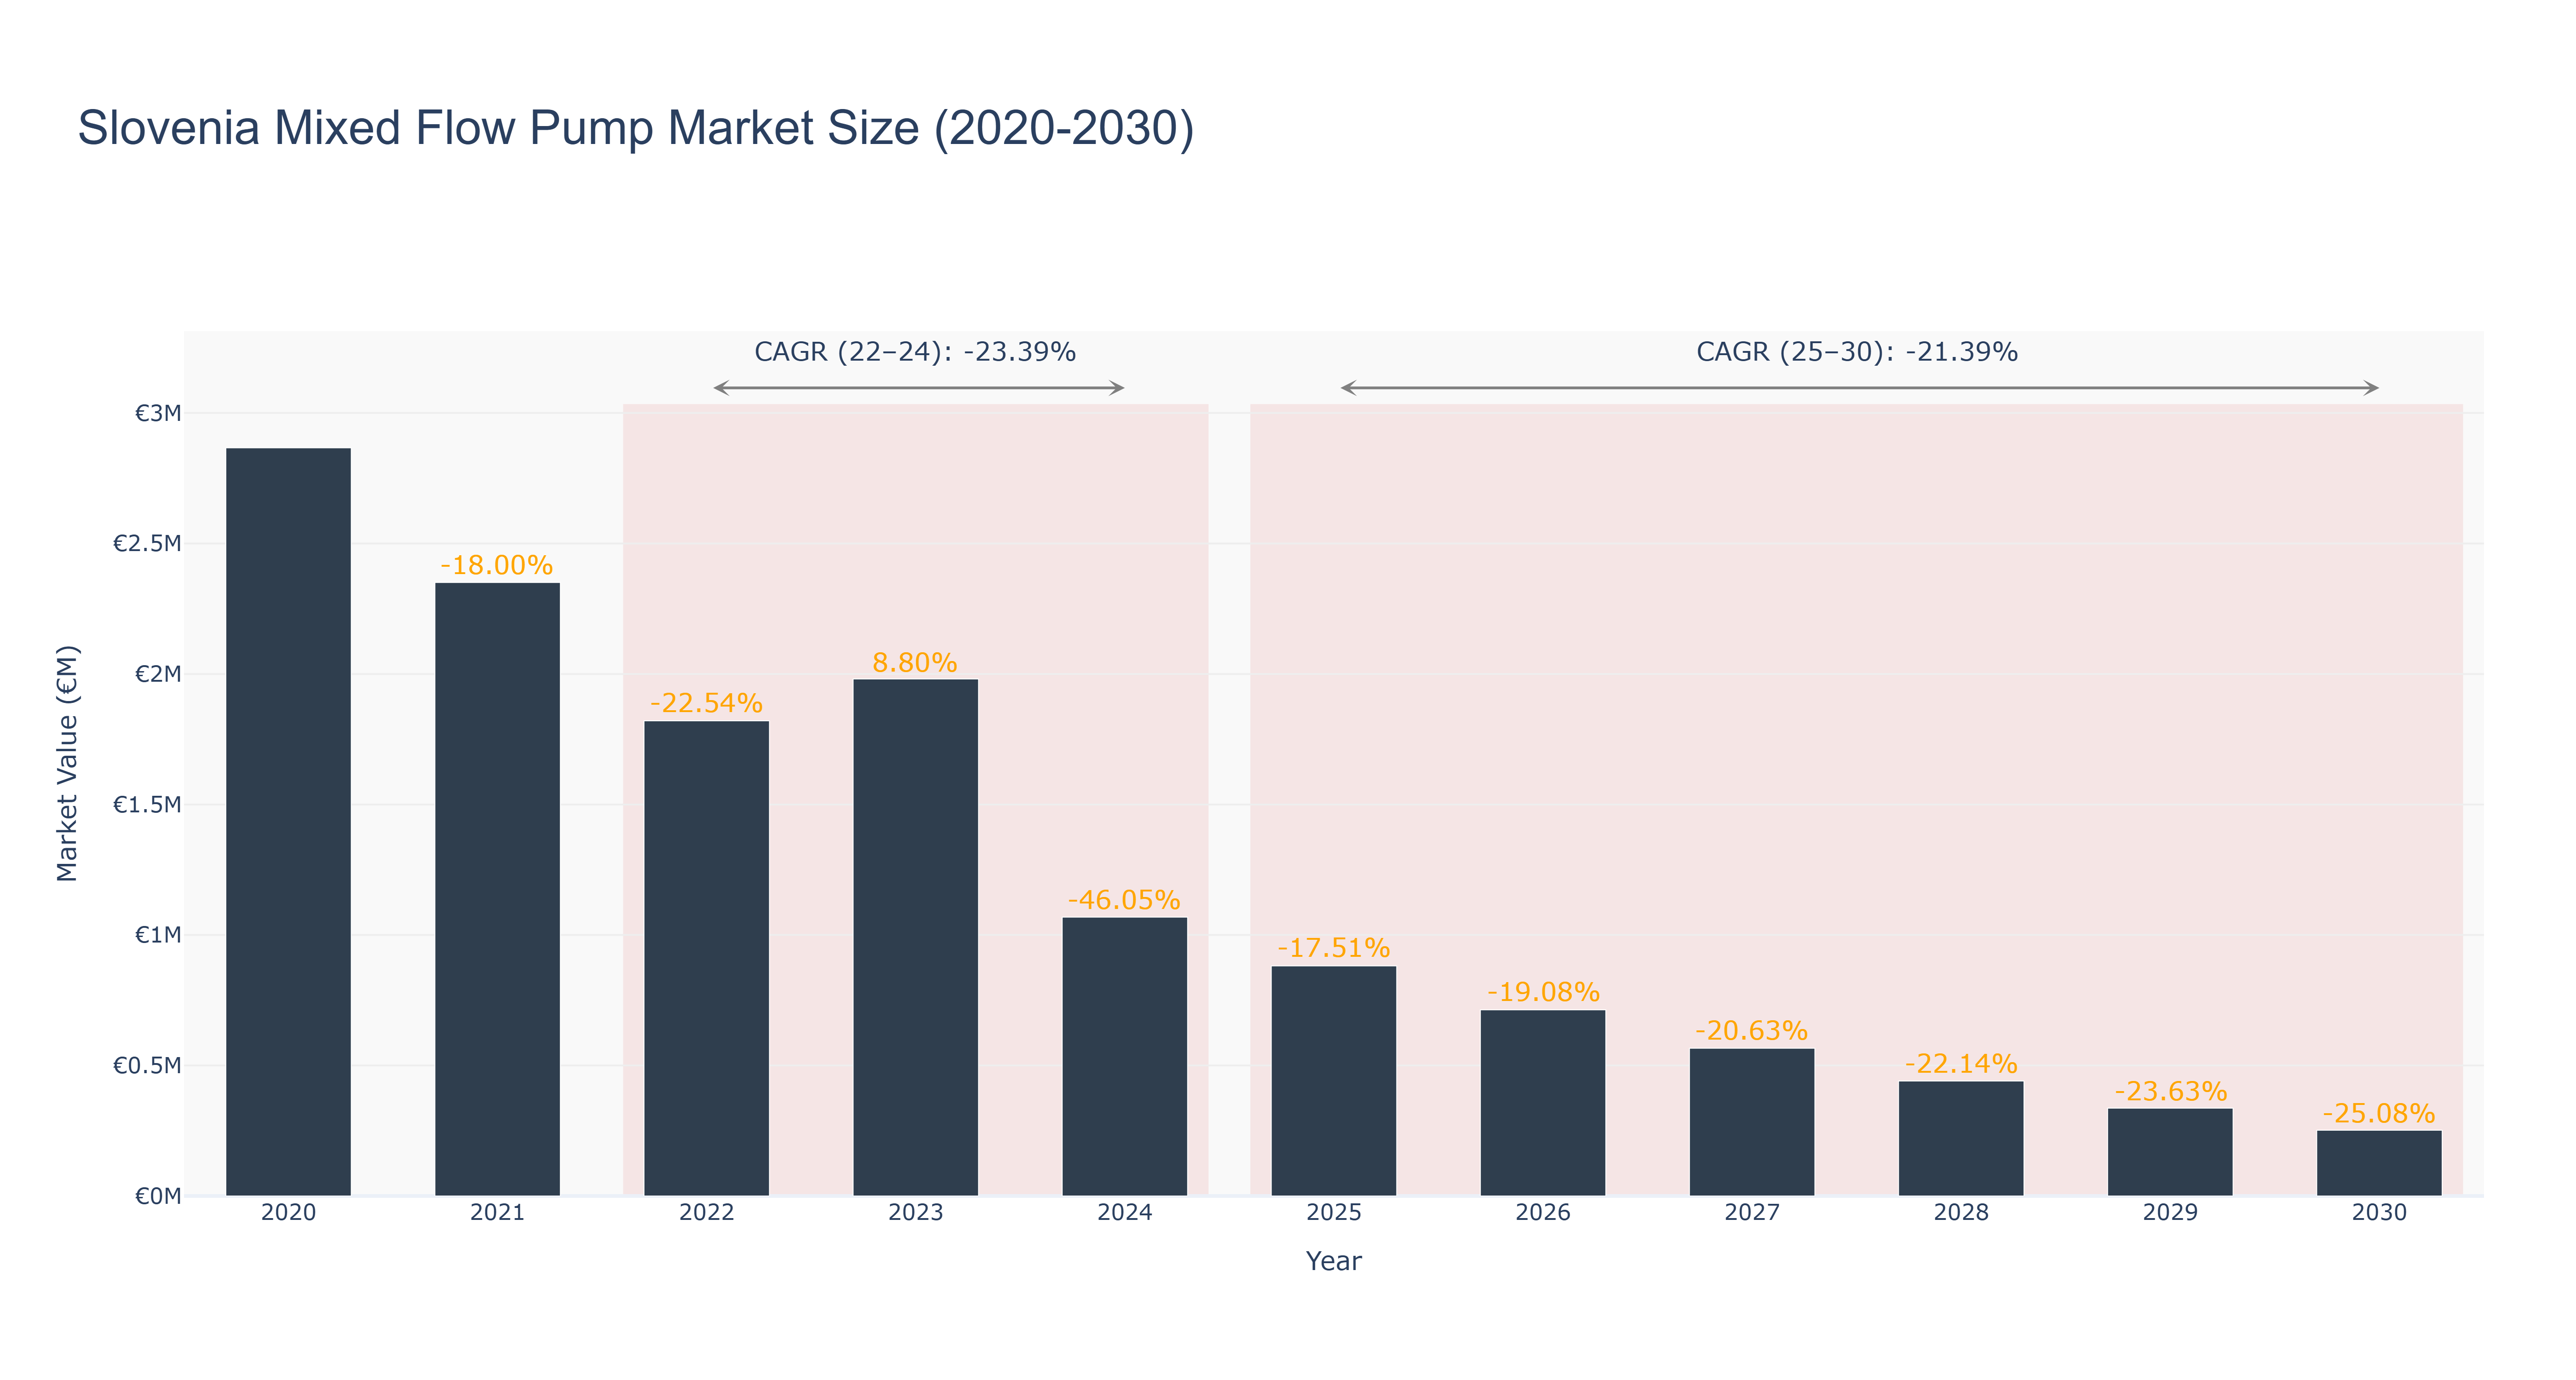
The Slovenia Mixed Flow Pump Market experienced a peak market size of €2.87 million in 2020, followed by a steady decline in subsequent years. The actual market size decreased to €1.07 million in 2024, with a negative growth rate of -46.05%. Forecasted market size continues to decrease, reaching €0.25 million in 2030, with a CAGR of -25.08% from 2025 to 2030. The market's downward trend can be attributed to factors such as economic slowdown, technological advancements leading to more efficient pump systems, and changing consumer preferences. Despite the challenging market conditions, upcoming infrastructure projects in Slovenia, such as the modernization of water supply systems, offer opportunities for growth in the mixed flow pump market. Industry drivers for the Slovenia Mixed Flow Pump Market include increasing focus on sustainability, government initiatives promoting energy-efficient solutions, and the need for reliable water infrastructure. Moving forward, companies in the market should prioritize innovation and sustainability to capitalize on emerging opportunities and stay competitive in the evolving landscape.
Slovenia Mixed Flow Pump Market: Production & Trade Performance (2019-2025)
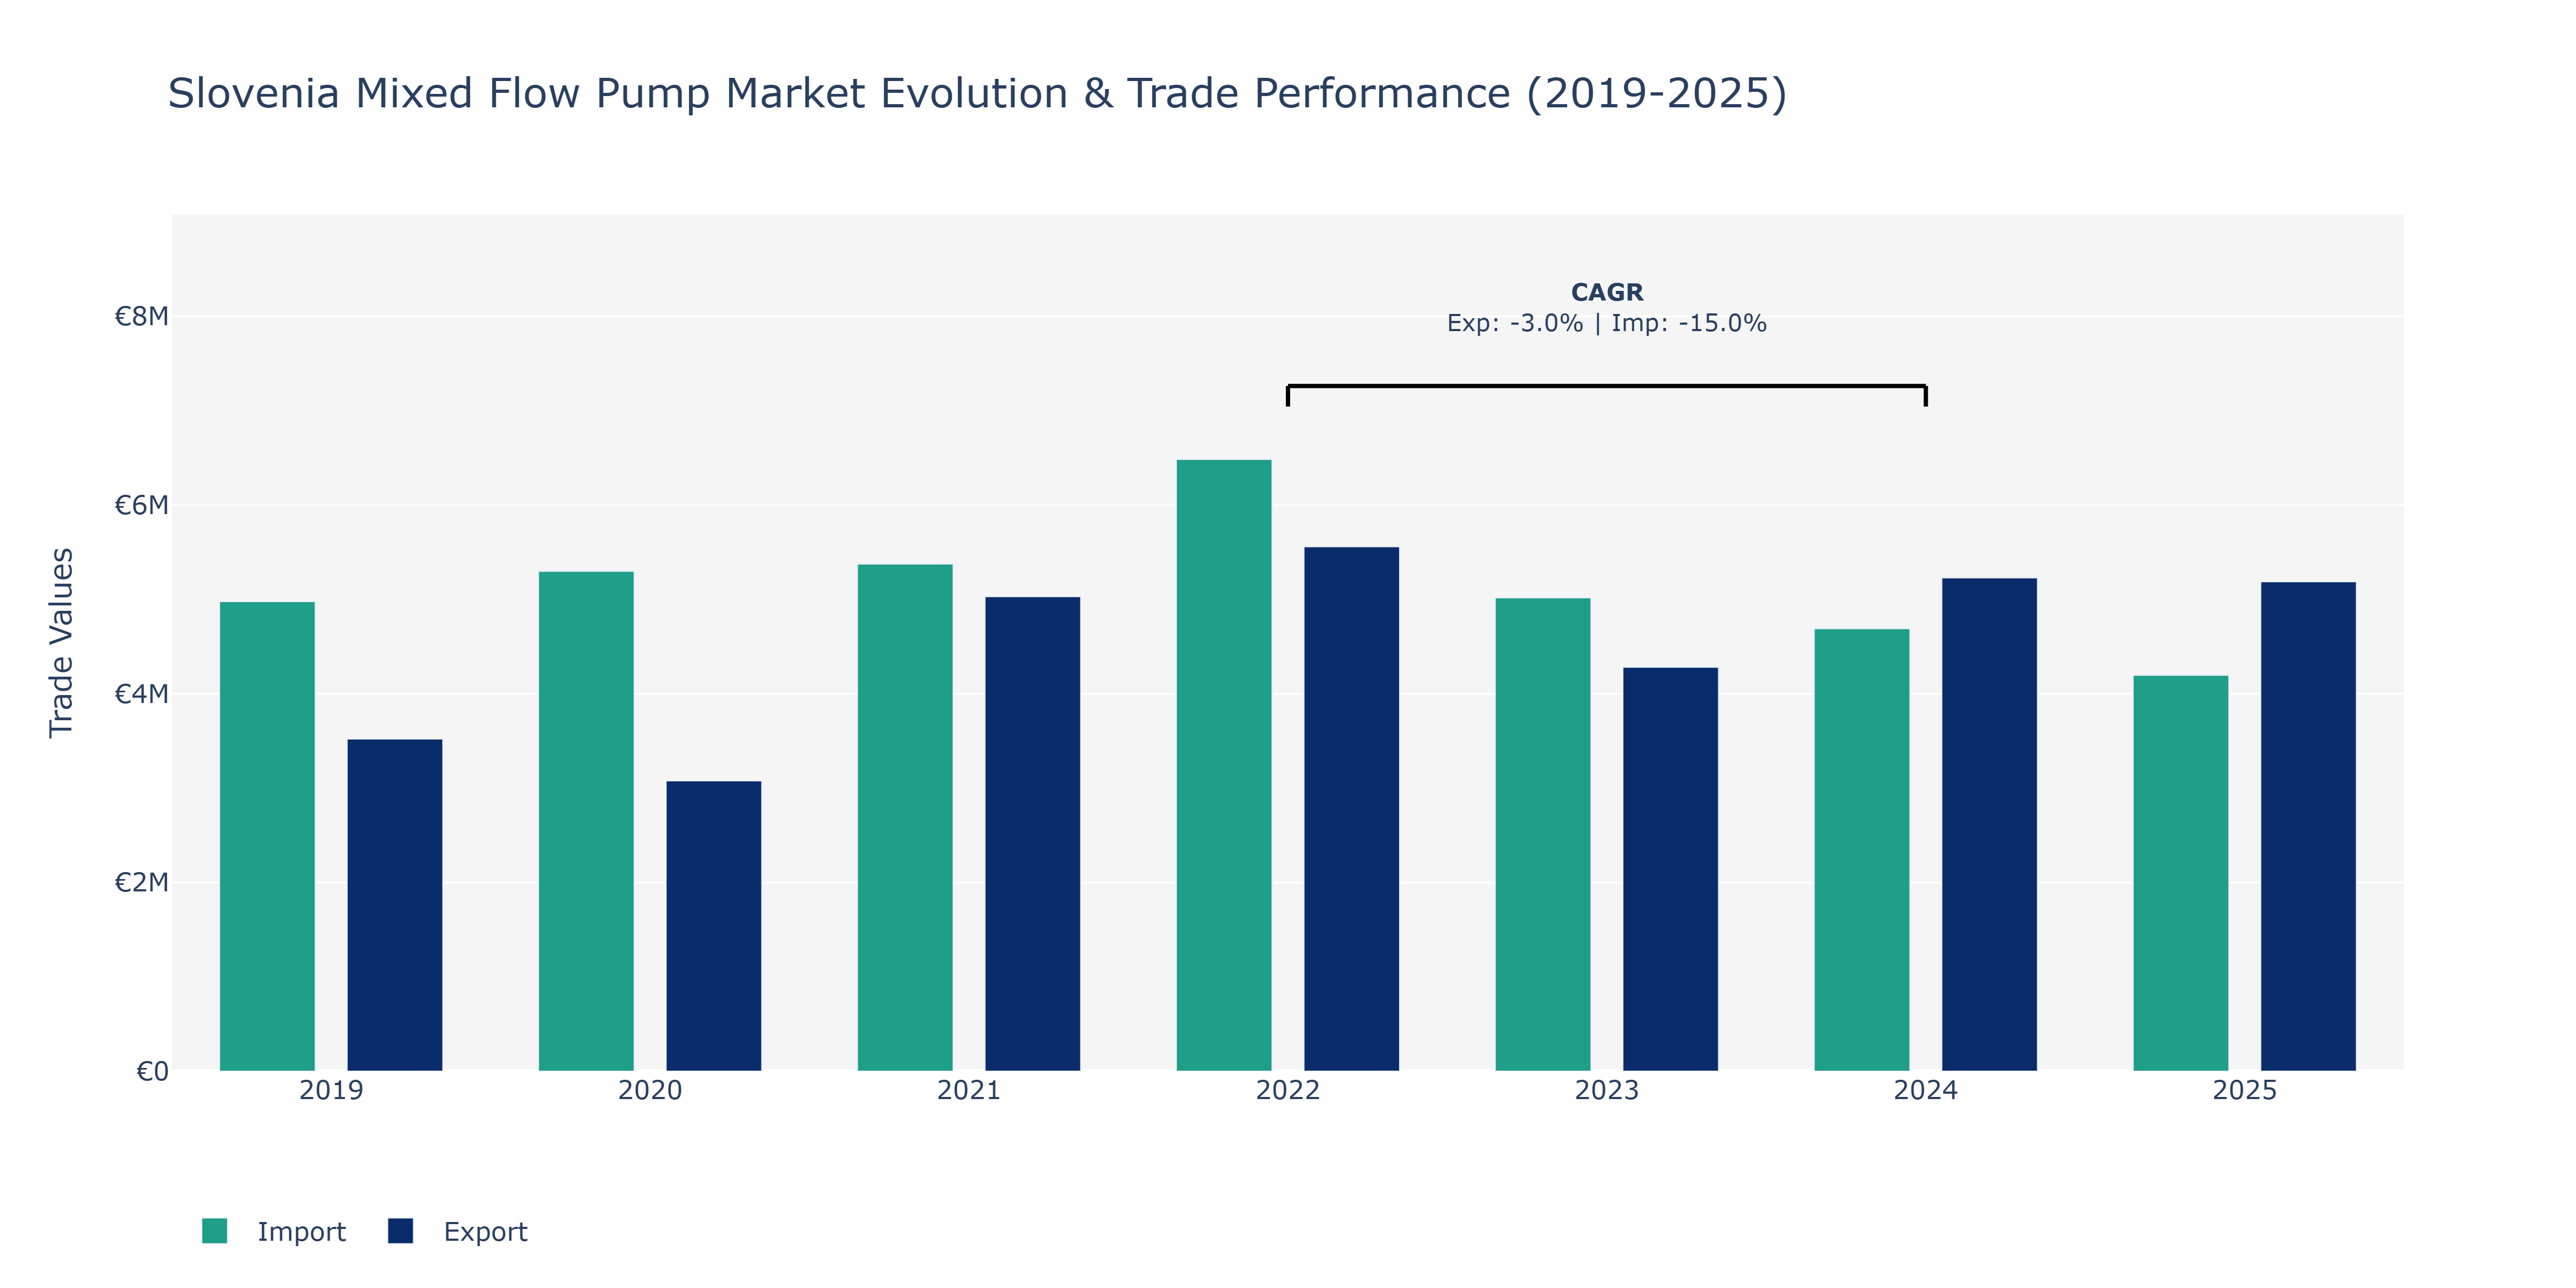
Between 2019 and 2025, Slovenia's Mixed Flow Pump Market witnessed fluctuations in both exports and imports. In 2021, exports peaked at €5.03 million, showcasing a substantial increase from the previous year. Meanwhile, imports also saw a growth trend during this period, reaching €5.37 million in the same year. However, a decline in exports occurred in 2023, dropping to €4.28 million, followed by a partial recovery the next year. Imports, on the other hand, experienced a decline in 2025 to around €4.2 million, indicating a downward trend. The market's performance can be attributed to various factors such as changes in global demand, shifts in supply chain dynamics, and economic conditions impacting trade flows. For instance, economic recovery efforts post-pandemic may have influenced import levels, while export fluctuations could be linked to competitive pressures or regulatory changes affecting market competitiveness.
Key Highlights of the Report:
- Slovenia Mixed Flow Pump Market Outlook
- Market Size of Slovenia Mixed Flow Pump Market, 2025
- Forecast of Slovenia Mixed Flow Pump Market, 2032
- Historical Data and Forecast of Slovenia Mixed Flow Pump Revenues & Volume for the Period 2022-2032F
- Slovenia Mixed Flow Pump Market Trend Evolution
- Slovenia Mixed Flow Pump Market Drivers and Challenges
- Slovenia Mixed Flow Pump Price Trends
- Slovenia Mixed Flow Pump Porter's Five Forces
- Slovenia Mixed Flow Pump Industry Life Cycle
- Historical Data and Forecast of Slovenia Mixed Flow Pump Market Revenues & Volume By Configuration for the Period 2022-2032F
- Historical Data and Forecast of Slovenia Mixed Flow Pump Market Revenues & Volume By Single-stage for the Period 2022-2032F
- Historical Data and Forecast of Slovenia Mixed Flow Pump Market Revenues & Volume By Multi-stage for the Period 2022-2032F
- Historical Data and Forecast of Slovenia Mixed Flow Pump Market Revenues & Volume By End-use for the Period 2022-2032F
- Historical Data and Forecast of Slovenia Mixed Flow Pump Market Revenues & Volume By Agriculture for the Period 2022-2032F
- Historical Data and Forecast of Slovenia Mixed Flow Pump Market Revenues & Volume By Construction & Building Services for the Period 2022-2032F
- Historical Data and Forecast of Slovenia Mixed Flow Pump Market Revenues & Volume By Water & Wastewater for the Period 2022-2032F
- Historical Data and Forecast of Slovenia Mixed Flow Pump Market Revenues & Volume By Power Generation for the Period 2022-2032F
- Historical Data and Forecast of Slovenia Mixed Flow Pump Market Revenues & Volume By Oil & Gas for the Period 2022-2032F
- Historical Data and Forecast of Slovenia Mixed Flow Pump Market Revenues & Volume By Chemical for the Period 2022-2032F
- Slovenia Mixed Flow Pump Import Export Trade Statistics
- Market Opportunity Assessment By Configuration
- Market Opportunity Assessment By End-use
- Slovenia Mixed Flow Pump Top Companies Market Share
- Slovenia Mixed Flow Pump Competitive Benchmarking By Technical and Operational Parameters
- Slovenia Mixed Flow Pump Company Profiles
- Slovenia Mixed Flow Pump Key Strategic Recommendations
Frequently Asked Questions About the Market Study (FAQs):
6Wresearch actively monitors the Slovenia Mixed Flow Pump Market and publishes its comprehensive annual report, highlighting emerging trends, growth drivers, revenue analysis, and forecast outlook. Our insights help businesses to make data-backed strategic decisions with ongoing market dynamics. Our analysts track relevent industries related to the Slovenia Mixed Flow Pump Market, allowing our clients with actionable intelligence and reliable forecasts tailored to emerging regional needs.
Yes, we provide customisation as per your requirements. To learn more, feel free to contact us on sales@6wresearch.com
1 Executive Summary |
2 Introduction |
2.1 Key Highlights of the Report |
2.2 Report Description |
2.3 Market Scope & Segmentation |
2.4 Research Methodology |
2.5 Assumptions |
3 Slovenia Mixed Flow Pump Market Overview |
3.1 Slovenia Country Macro Economic Indicators |
3.2 Slovenia Mixed Flow Pump Market Revenues & Volume, 2022 & 2032F |
3.3 Slovenia Mixed Flow Pump Market - Industry Life Cycle |
3.4 Slovenia Mixed Flow Pump Market - Porter's Five Forces |
3.5 Slovenia Mixed Flow Pump Market Revenues & Volume Share, By Configuration, 2022 & 2032F |
3.6 Slovenia Mixed Flow Pump Market Revenues & Volume Share, By End-use, 2022 & 2032F |
4 Slovenia Mixed Flow Pump Market Dynamics |
4.1 Impact Analysis |
4.2 Market Drivers |
4.2.1 Increasing demand for efficient water management systems in Slovenia |
4.2.2 Growth in the agriculture sector leading to higher demand for irrigation systems |
4.2.3 Government initiatives promoting the use of energy-efficient pumps in various industries |
4.3 Market Restraints |
4.3.1 High initial investment costs associated with mixed flow pumps |
4.3.2 Competition from alternative pumping technologies like centrifugal pumps |
4.3.3 Fluctuations in raw material prices impacting the overall cost of production |
5 Slovenia Mixed Flow Pump Market Trends |
6 Slovenia Mixed Flow Pump Market, By Types |
6.1 Slovenia Mixed Flow Pump Market, By Configuration |
6.1.1 Overview and Analysis |
6.1.2 Slovenia Mixed Flow Pump Market Revenues & Volume, By Configuration, 2022-2032F |
6.1.3 Slovenia Mixed Flow Pump Market Revenues & Volume, By Single-stage, 2022-2032F |
6.1.4 Slovenia Mixed Flow Pump Market Revenues & Volume, By Multi-stage, 2022-2032F |
6.2 Slovenia Mixed Flow Pump Market, By End-use |
6.2.1 Overview and Analysis |
6.2.2 Slovenia Mixed Flow Pump Market Revenues & Volume, By Agriculture, 2022-2032F |
6.2.3 Slovenia Mixed Flow Pump Market Revenues & Volume, By Construction & Building Services, 2022-2032F |
6.2.4 Slovenia Mixed Flow Pump Market Revenues & Volume, By Water & Wastewater, 2022-2032F |
6.2.5 Slovenia Mixed Flow Pump Market Revenues & Volume, By Power Generation, 2022-2032F |
6.2.6 Slovenia Mixed Flow Pump Market Revenues & Volume, By Oil & Gas, 2022-2032F |
6.2.7 Slovenia Mixed Flow Pump Market Revenues & Volume, By Chemical, 2022-2032F |
7 Slovenia Mixed Flow Pump Market Import-Export Trade Statistics |
7.1 Slovenia Mixed Flow Pump Market Export to Major Countries |
7.2 Slovenia Mixed Flow Pump Market Imports from Major Countries |
8 Slovenia Mixed Flow Pump Market Key Performance Indicators |
8.1 Energy efficiency rating of mixed flow pumps in the market |
8.2 Number of government tenders or projects involving the use of mixed flow pumps |
8.3 Adoption rate of smart pump technologies in Slovenia |
9 Slovenia Mixed Flow Pump Market - Opportunity Assessment |
9.1 Slovenia Mixed Flow Pump Market Opportunity Assessment, By Configuration, 2022 & 2032F |
9.2 Slovenia Mixed Flow Pump Market Opportunity Assessment, By End-use, 2022 & 2032F |
10 Slovenia Mixed Flow Pump Market - Competitive Landscape |
10.1 Slovenia Mixed Flow Pump Market Revenue Share, By Companies, 2025 |
10.2 Slovenia Mixed Flow Pump Market Competitive Benchmarking, By Operating and Technical Parameters |
11 Company Profiles |
12 Recommendations |
13 Disclaimer |
Export potential assessment - trade Analytics for 2030
Export potential enables firms to identify high-growth global markets with greater confidence by combining advanced trade intelligence with a structured quantitative methodology. The framework analyzes emerging demand trends and country-level import patterns while integrating macroeconomic and trade datasets such as GDP and population forecasts, bilateral import–export flows, tariff structures, elasticity differentials between developed and developing economies, geographic distance, and import demand projections. Using weighted trade values from 2020–2024 as the base period to project country-to-country export potential for 2030, these inputs are operationalized through calculated drivers such as gravity model parameters, tariff impact factors, and projected GDP per-capita growth. Through an analysis of hidden potentials, demand hotspots, and market conditions that are most favorable to success, this method enables firms to focus on target countries, maximize returns, and global expansion with data, backed by accuracy.
By factoring in the projected importer demand gap that is currently unmet and could be potential opportunity, it identifies the potential for the Exporter (Country) among 190 countries, against the general trade analysis, which identifies the biggest importer or exporter.
To discover high-growth global markets and optimize your business strategy:
Click Here
Pricing
- Single User License$ 1,995
- Department License$ 2,400
- Site License$ 3,120
- Global License$ 3,795

Search
Thought Leadership and Analyst Meet


Our Clients
Latest Reports
- France Thermally Conductive Filler Dispersants Market (2026-2032) | Challenges, Restraints, Value, Share, Size, segmentation, Analysis, Trends, Investment Opportunities, Outlook, Pricing, Demand, Forecast, Revenue, Companies, Growth, Drivers, Strategy, Insights, Competition
- Egypt Thermally Conductive Filler Dispersants Market (2026-2032) | Competition, Forecast, Strategy, Value, Insights, Outlook, Investment Opportunities, Pricing, Demand, Share, segmentation, Drivers, Size, Companies, Restraints, Growth, Trends, Revenue, Challenges, Analysis
- Czech Republic Thermally Conductive Filler Dispersants Market (2026-2032) | Forecast, Pricing, Analysis, Drivers, Insights, Size, Demand, Growth, Challenges, segmentation, Competition, Outlook, Trends, Investment Opportunities, Companies, Strategy, Revenue, Share, Value, Restraints
- Colombia Thermally Conductive Filler Dispersants Market (2026-2032) | segmentation, Trends, Share, Drivers, Strategy, Companies, Demand, Insights, Size, Challenges, Value, Competition, Analysis, Growth, Revenue, Restraints, Forecast, Pricing, Outlook, Investment Opportunities
- China Thermally Conductive Filler Dispersants Market (2026-2032) | Restraints, Investment Opportunities, Pricing, Companies, Share, Size, Challenges, Trends, Outlook, Value, Analysis, Competition, Revenue, Drivers, Forecast, Demand, Insights, Growth, Strategy, segmentation
- Chile Thermally Conductive Filler Dispersants Market (2026-2032) | Investment Opportunities, Trends, Value, Restraints, Share, Companies, Forecast, segmentation, Pricing, Challenges, Demand, Size, Analysis, Drivers, Outlook, Growth, Competition, Strategy, Revenue, Insights
- Cambodia Thermally Conductive Filler Dispersants Market (2026-2032) | Analysis, Share, Outlook, Strategy, Pricing, Demand, Size, Growth, segmentation, Insights, Revenue, Forecast, Challenges, Competition, Companies, Investment Opportunities, Trends, Restraints, Value, Drivers
- Brazil Thermally Conductive Filler Dispersants Market (2026-2032) | Restraints, Forecast, Competition, Size, Revenue, Value, Investment Opportunities, Trends, Insights, Outlook, Growth, Analysis, Drivers, segmentation, Pricing, Challenges, Strategy, Share, Companies, Demand
- Bangladesh Thermally Conductive Filler Dispersants Market (2026-2032) | Restraints, Trends, Analysis, Competition, Insights, Forecast, Value, Investment Opportunities, Pricing, Share, Demand, Outlook, Revenue, segmentation, Companies, Drivers, Growth, Size, Challenges, Strategy
- Bahrain Thermally Conductive Filler Dispersants Market (2026-2032) | Trends, Outlook, Pricing, Demand, Value, Competition, Forecast, Growth, segmentation, Revenue, Companies, Analysis, Insights, Size, Drivers, Challenges, Strategy, Investment Opportunities, Share, Restraints
Industry Events and Analyst Meet

HIMTEX 2026

India Refining Summit 2026

India EV Show 2026

EV tech India Expo 2026

Auto Tech Asia 2026
Whitepaper
- Middle East & Africa Commercial Security Market Click here to view more.
- Middle East & Africa Fire Safety Systems & Equipment Market Click here to view more.
- GCC Drone Market Click here to view more.
- Middle East Lighting Fixture Market Click here to view more.
- GCC Physical & Perimeter Security Market Click here to view more.
6WResearch In News
- Doha a strategic location for EV manufacturing hub: IPA Qatar
- Demand for luxury TVs surging in the GCC, says Samsung
- Empowering Growth: The Thriving Journey of Bangladesh’s Cable Industry
- Demand for luxury TVs surging in the GCC, says Samsung
- Video call with a traditional healer? Once unthinkable, it’s now common in South Africa
- Intelligent Buildings To Smooth GCC’s Path To Net Zero