Slovenia Table linen Market (2026-2032) | Outlook, Segmentation, Value, Growth, Forecast, Trends, Industry, Size, Share, Companies, Revenue & Analysis
Market Forecast By Material (Cotton, Artificial Fibers, Linen Silk, Others), By Application (Residential, Commercial), By Distribution Channel (Hypermarket/Supermarket, Specialty Stores, Online) And Competitive Landscape
| Product Code: ETC5524237 | Publication Date: Nov 2023 | Updated Date: Apr 2026 | Product Type: Market Research Report | |
| Publisher: 6Wresearch | Author: Ravi Bhandari | No. of Pages: 60 | No. of Figures: 30 | No. of Tables: 5 |
Slovenia Table Linen Market Size (2020-2030)
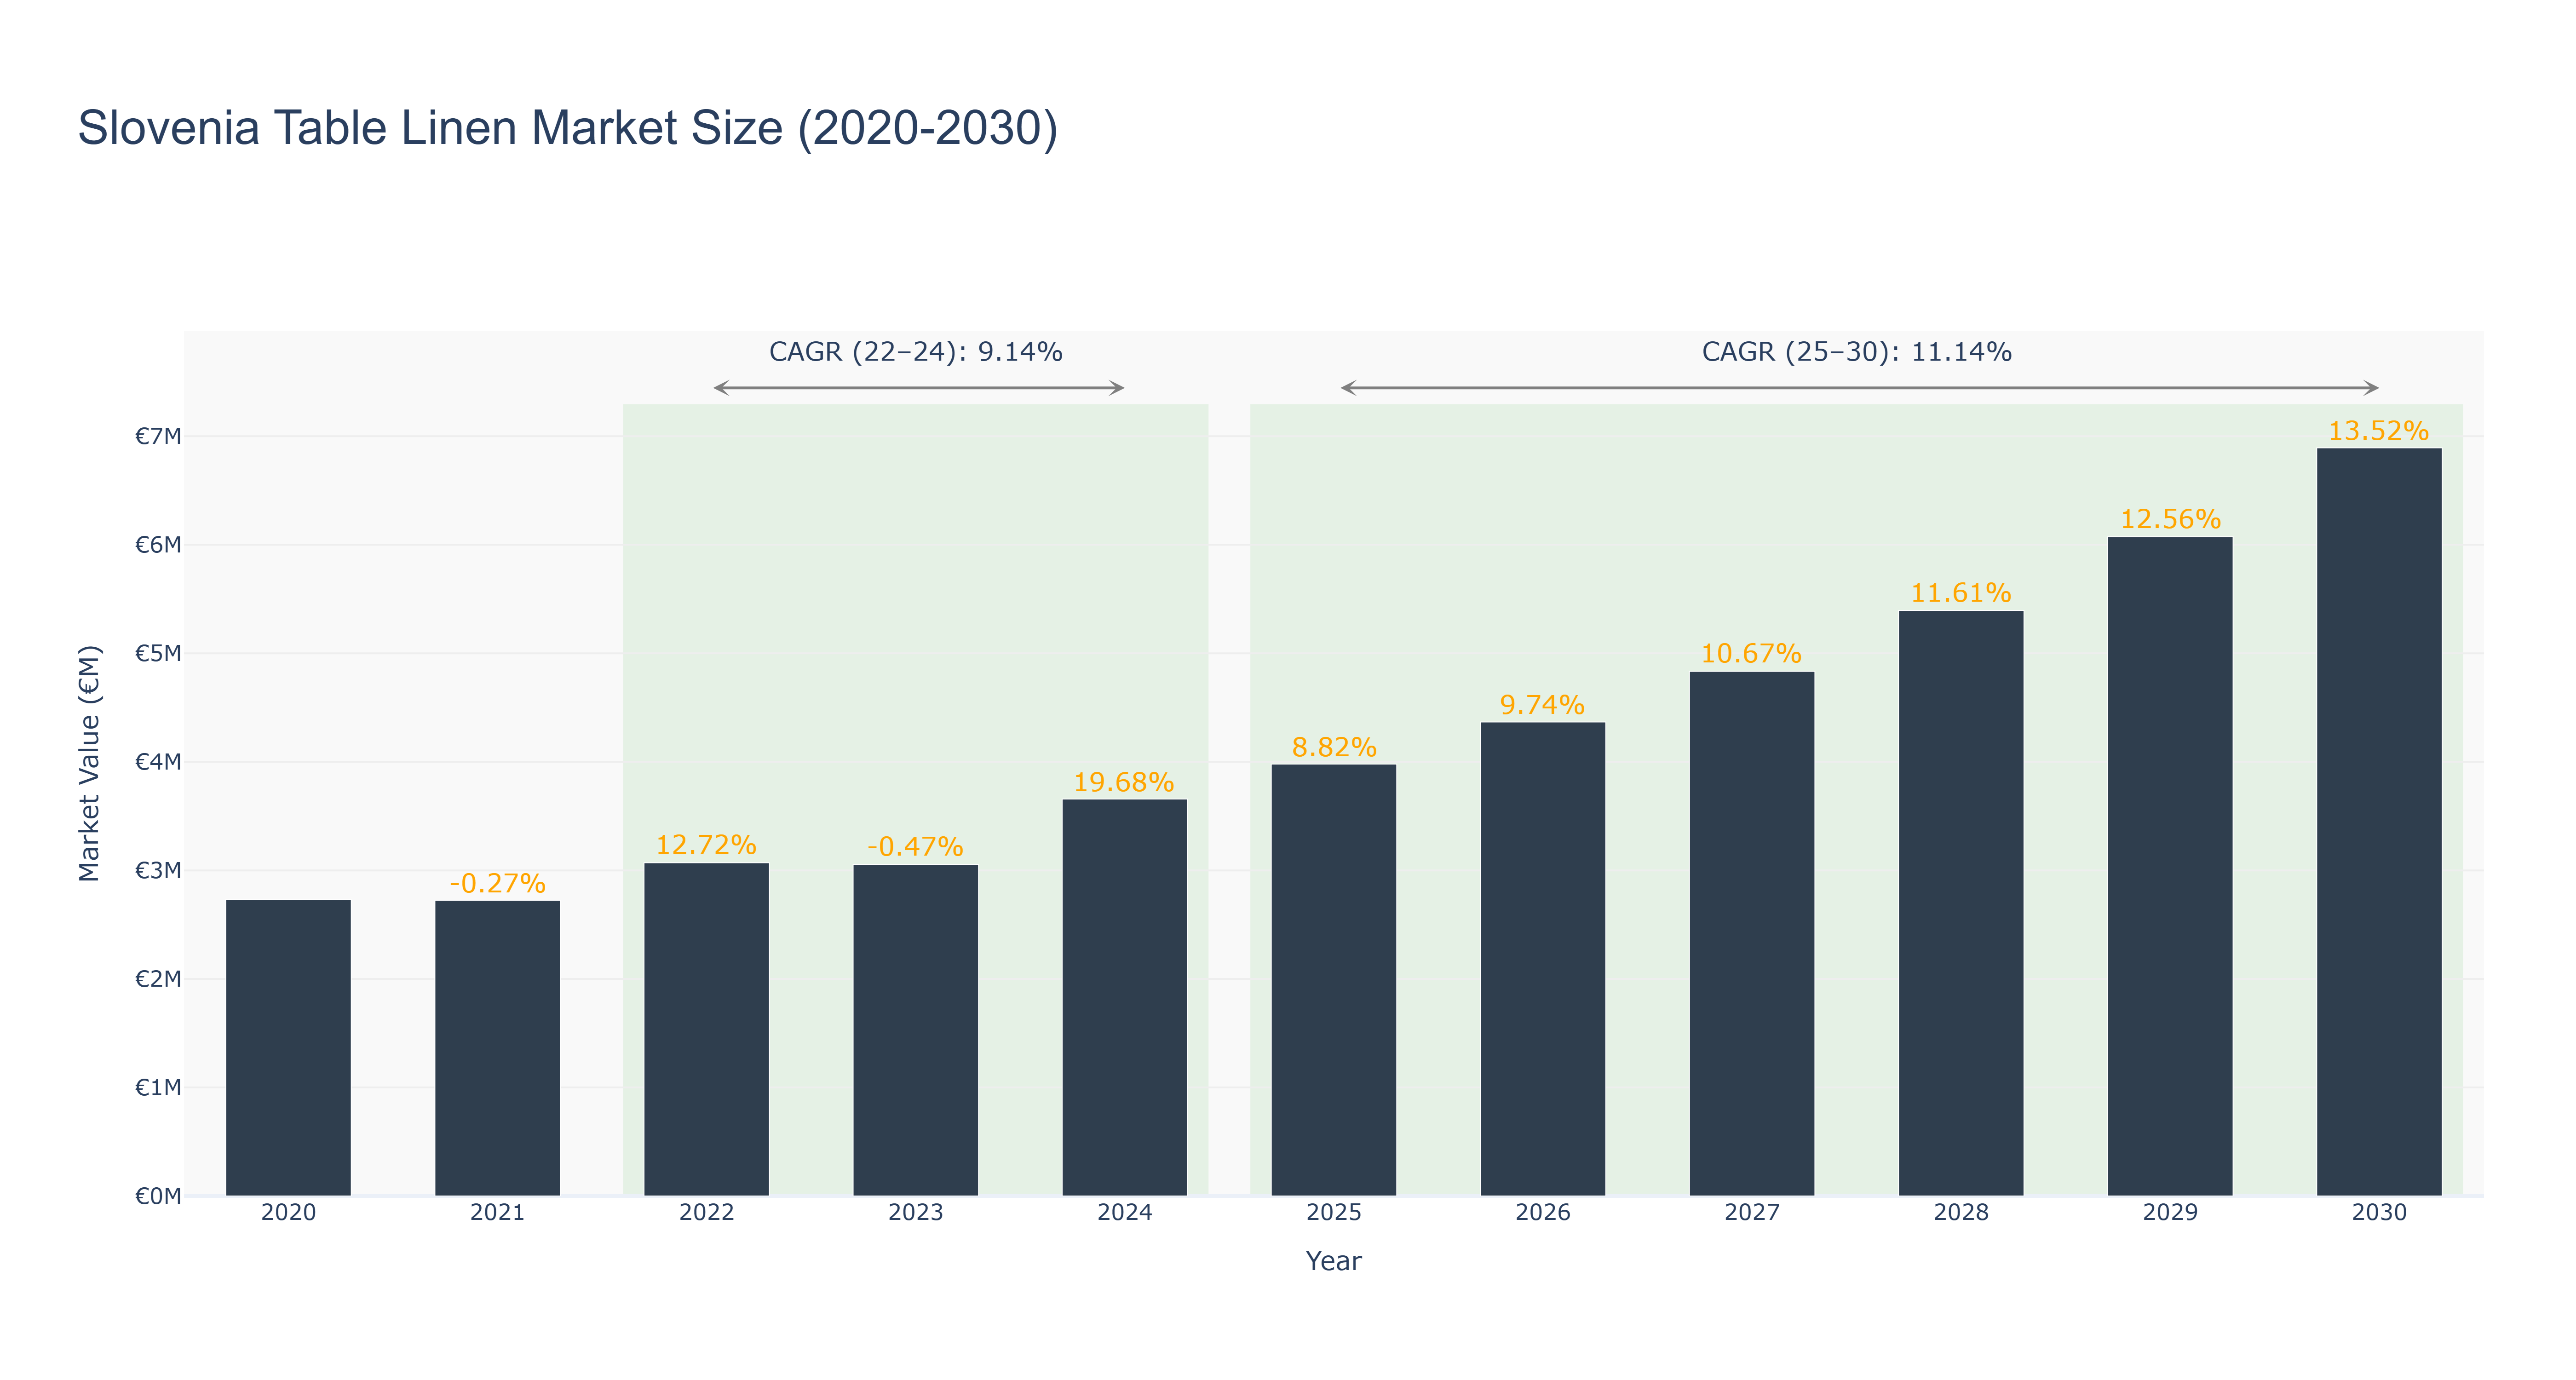
Slovenia Table Linen Market has demonstrated steady growth, with the market projected to reach €6.89M by 2030, reflecting a positive outlook during 2025–2030. The market recorded stable realised performance through 2020–2024, with a slight dip in 2023 due to economic uncertainties, followed by a strong recovery driven by rising disposable incomes and improving consumer sentiment. Notable growth acceleration was observed during 2024–2026, supported by increasing demand for premium table linen products, particularly from the hospitality sector. Growth is further fueled by the rising trend of dining out, expanding events industry, and growing focus on home décor and aesthetics. Looking ahead, the market is forecasted to continue its upward trajectory, supported by investments in sustainable manufacturing and eco-friendly materials. Additionally, collaborations with local artisans and the introduction of innovative and smart textile solutions are expected to enhance product appeal and drive long-term market expansion.
Slovenia Table Linen Market: Production & Trade Performance (2019-2025)
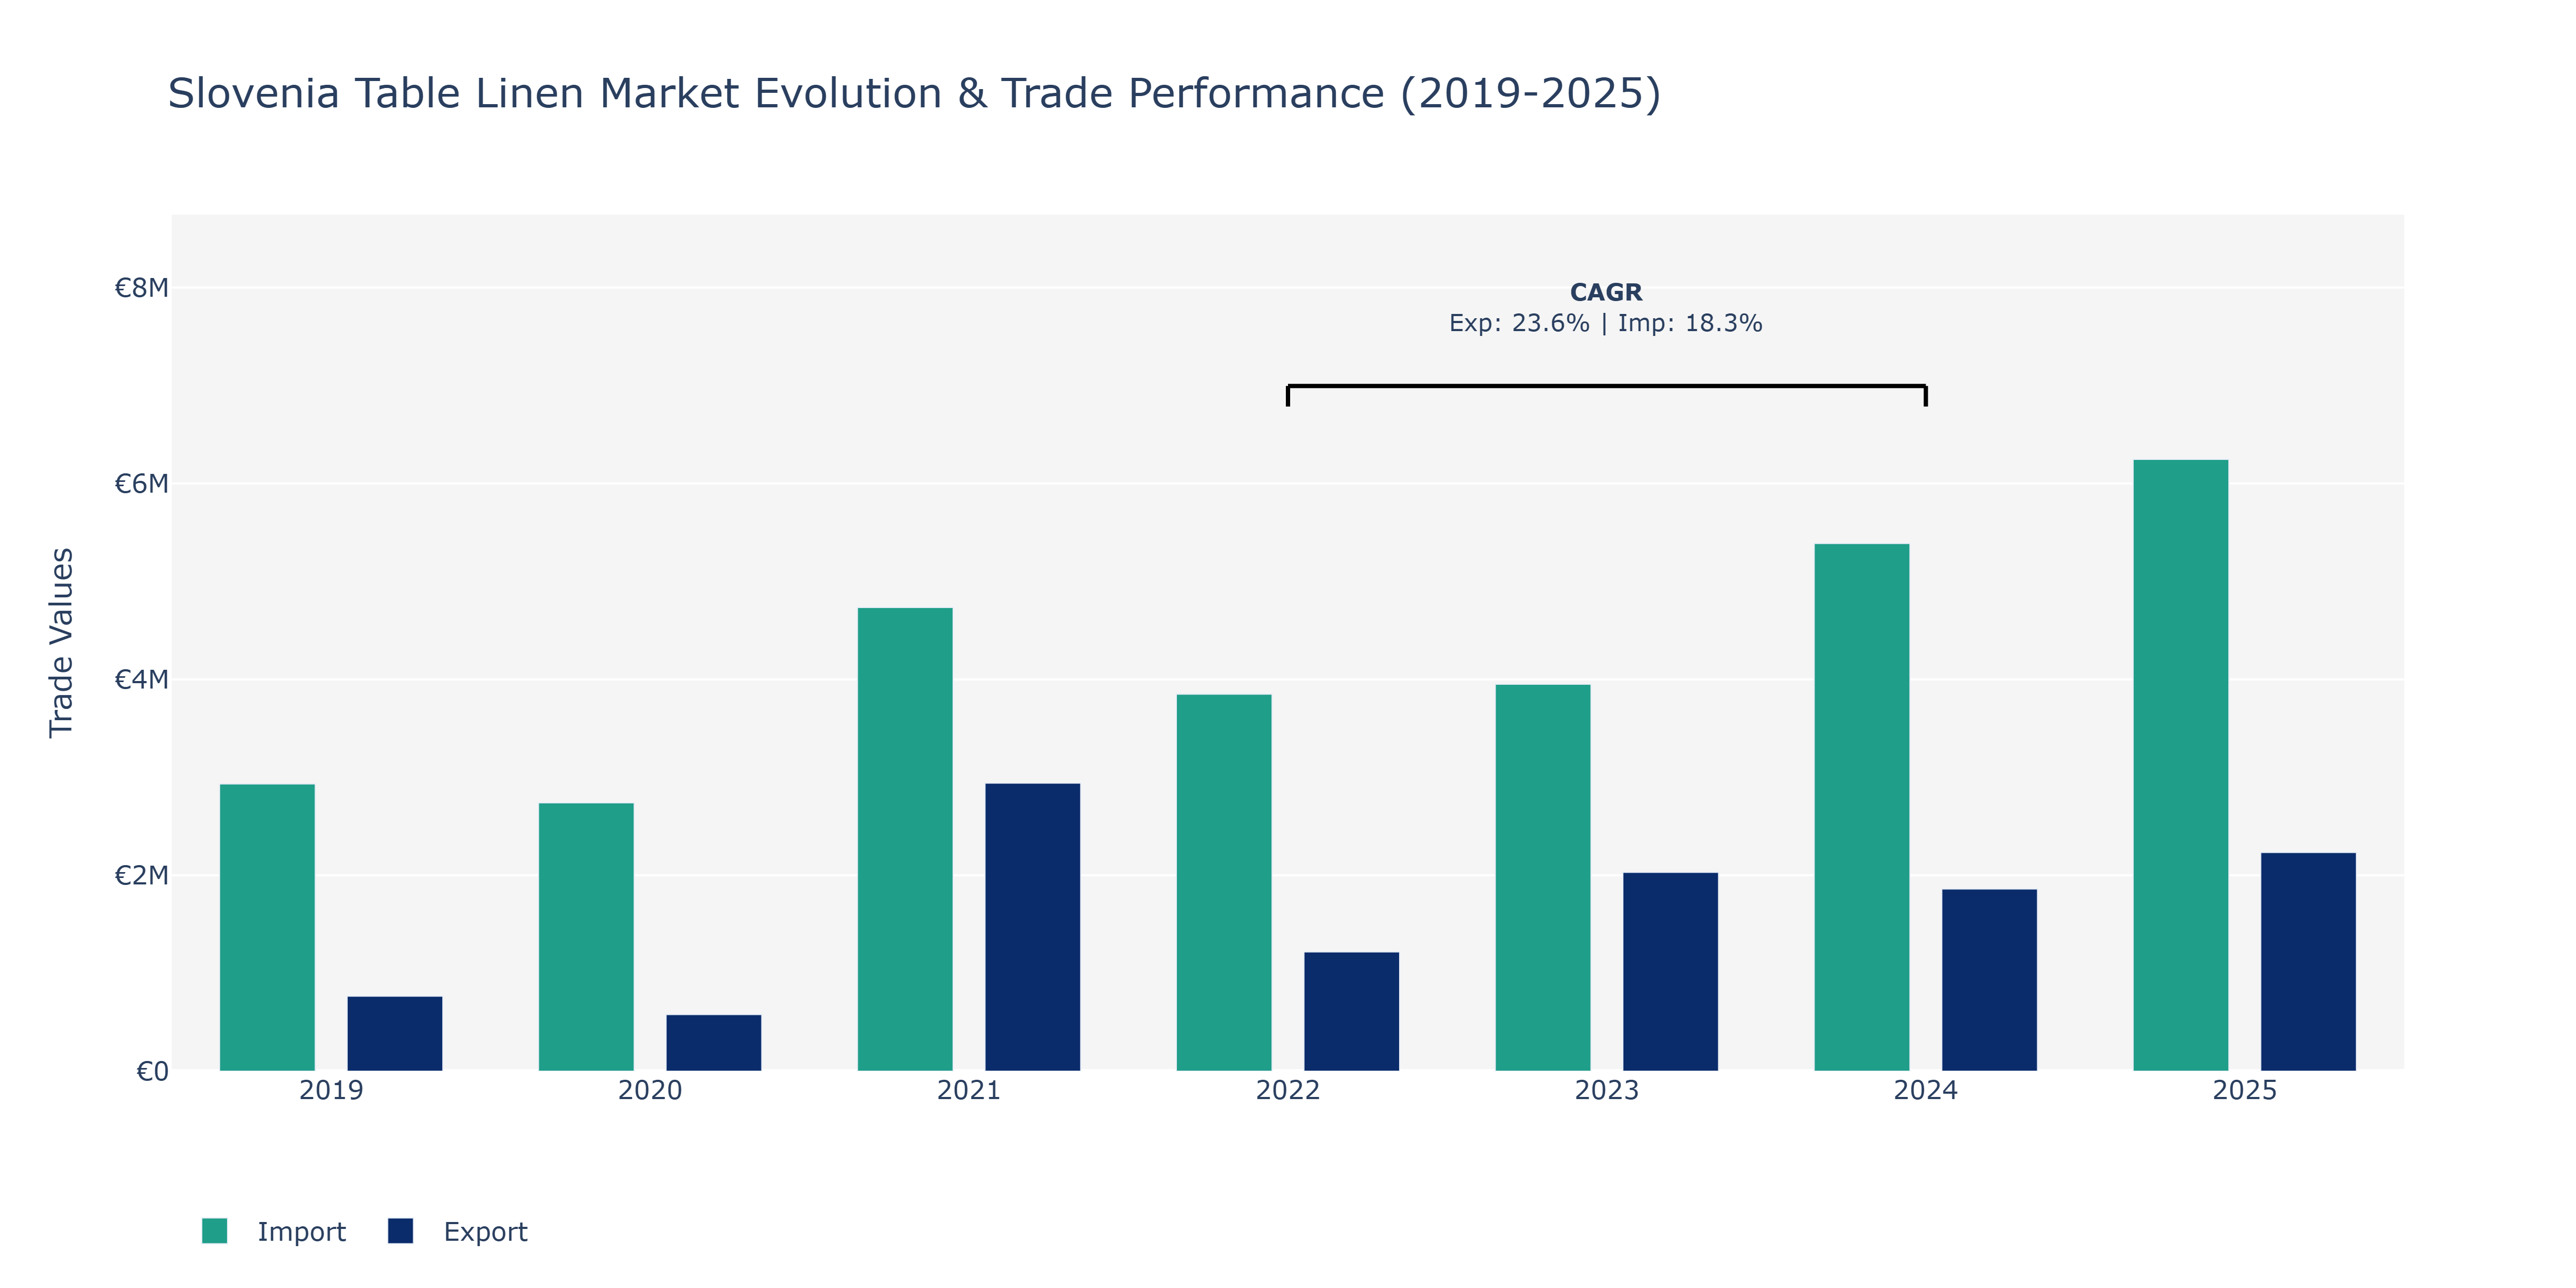
In the Slovenia Table Linen Market, exports experienced fluctuations over the years, starting at €764.93 thousand in 2019 and dropping to €578.35 thousand in 2020 before a significant surge to €2.94 million in 2021. Subsequently, exports decreased to €1.22 million in 2022, rebounded to €2.03 million in 2023, and remained relatively stable at €1.86 million in 2024, with a slight increase to €2.23 million in 2025. Conversely, imports followed a consistent upward trend, rising from €2.93 million in 2019 to €6.25 million in 2025. The market saw robust growth in imports, likely driven by increasing demand for high-quality table linen products in Slovenia, improved purchasing power, and enhanced trade relations with international suppliers. The fluctuations in exports may be attributed to varying global market conditions, changes in consumer preferences, and competition from other textile products.
Key Highlights of the Report:
- Slovenia Table linen Market Outlook
- Market Size of Slovenia Table linen Market, 2025
- Forecast of Slovenia Table linen Market, 2032
- Historical Data and Forecast of Slovenia Table linen Revenues & Volume for the Period 2022-2032F
- Slovenia Table linen Market Trend Evolution
- Slovenia Table linen Market Drivers and Challenges
- Slovenia Table linen Price Trends
- Slovenia Table linen Porter`s Five Forces
- Slovenia Table linen Industry Life Cycle
- Historical Data and Forecast of Slovenia Table linen Market Revenues & Volume By Material for the Period 2022-2032F
- Historical Data and Forecast of Slovenia Table linen Market Revenues & Volume By Cotton for the Period 2022-2032F
- Historical Data and Forecast of Slovenia Table linen Market Revenues & Volume By Artificial Fibers for the Period 2022-2032F
- Historical Data and Forecast of Slovenia Table linen Market Revenues & Volume By Linen Silk for the Period 2022-2032F
- Historical Data and Forecast of Slovenia Table linen Market Revenues & Volume By Others for the Period 2022-2032F
- Historical Data and Forecast of Slovenia Table linen Market Revenues & Volume By Application for the Period 2022-2032F
- Historical Data and Forecast of Slovenia Table linen Market Revenues & Volume By Residential for the Period 2022-2032F
- Historical Data and Forecast of Slovenia Table linen Market Revenues & Volume By Commercial for the Period 2022-2032F
- Historical Data and Forecast of Slovenia Table linen Market Revenues & Volume By Distribution Channel for the Period 2022-2032F
- Historical Data and Forecast of Slovenia Table linen Market Revenues & Volume By Hypermarket/Supermarket for the Period 2022-2032F
- Historical Data and Forecast of Slovenia Table linen Market Revenues & Volume By Specialty Stores for the Period 2022-2032F
- Historical Data and Forecast of Slovenia Table linen Market Revenues & Volume By Online for the Period 2022-2032F
- Slovenia Table linen Import Export Trade Statistics
- Market Opportunity Assessment By Material
- Market Opportunity Assessment By Application
- Market Opportunity Assessment By Distribution Channel
- Slovenia Table linen Top Companies Market Share
- Slovenia Table linen Competitive Benchmarking By Technical and Operational Parameters
- Slovenia Table linen Company Profiles
- Slovenia Table linen Key Strategic Recommendations
Frequently Asked Questions About the Market Study (FAQs):
6Wresearch actively monitors the Slovenia Table linen Market and publishes its comprehensive annual report, highlighting emerging trends, growth drivers, revenue analysis, and forecast outlook. Our insights help businesses to make data-backed strategic decisions with ongoing market dynamics. Our analysts track relevent industries related to the Slovenia Table linen Market, allowing our clients with actionable intelligence and reliable forecasts tailored to emerging regional needs.
Yes, we provide customisation as per your requirements. To learn more, feel free to contact us on sales@6wresearch.com
1 Executive Summary |
2 Introduction |
2.1 Key Highlights of the Report |
2.2 Report Description |
2.3 Market Scope & Segmentation |
2.4 Research Methodology |
2.5 Assumptions |
3 Slovenia Table linen Market Overview |
3.1 Slovenia Country Macro Economic Indicators |
3.2 Slovenia Table linen Market Revenues & Volume, 2022 & 2032F |
3.3 Slovenia Table linen Market - Industry Life Cycle |
3.4 Slovenia Table linen Market - Porter's Five Forces |
3.5 Slovenia Table linen Market Revenues & Volume Share, By Material, 2022 & 2032F |
3.6 Slovenia Table linen Market Revenues & Volume Share, By Application, 2022 & 2032F |
3.7 Slovenia Table linen Market Revenues & Volume Share, By Distribution Channel, 2022 & 2032F |
4 Slovenia Table linen Market Dynamics |
4.1 Impact Analysis |
4.2 Market Drivers |
4.2.1 Increasing trend of dining out and rise in tourism in Slovenia |
4.2.2 Growing demand for premium and luxury table linen products |
4.2.3 Rise in disposable income and changing consumer preferences towards home decor |
4.3 Market Restraints |
4.3.1 Intense competition from alternative dining options such as fast-food restaurants |
4.3.2 Fluctuating raw material prices impacting production costs |
4.3.3 Economic uncertainty and fluctuations affecting consumer spending on non-essential items |
5 Slovenia Table linen Market Trends |
6 Slovenia Table linen Market Segmentations |
6.1 Slovenia Table linen Market, By Material |
6.1.1 Overview and Analysis |
6.1.2 Slovenia Table linen Market Revenues & Volume, By Cotton, 2022-2032F |
6.1.3 Slovenia Table linen Market Revenues & Volume, By Artificial Fibers, 2022-2032F |
6.1.4 Slovenia Table linen Market Revenues & Volume, By Linen Silk, 2022-2032F |
6.1.5 Slovenia Table linen Market Revenues & Volume, By Others, 2022-2032F |
6.2 Slovenia Table linen Market, By Application |
6.2.1 Overview and Analysis |
6.2.2 Slovenia Table linen Market Revenues & Volume, By Residential, 2022-2032F |
6.2.3 Slovenia Table linen Market Revenues & Volume, By Commercial, 2022-2032F |
6.3 Slovenia Table linen Market, By Distribution Channel |
6.3.1 Overview and Analysis |
6.3.2 Slovenia Table linen Market Revenues & Volume, By Hypermarket/Supermarket, 2022-2032F |
6.3.3 Slovenia Table linen Market Revenues & Volume, By Specialty Stores, 2022-2032F |
6.3.4 Slovenia Table linen Market Revenues & Volume, By Online, 2022-2032F |
7 Slovenia Table linen Market Import-Export Trade Statistics |
7.1 Slovenia Table linen Market Export to Major Countries |
7.2 Slovenia Table linen Market Imports from Major Countries |
8 Slovenia Table linen Market Key Performance Indicators |
8.1 Average spend per customer on table linen products |
8.2 Number of high-end restaurants and hotels using premium table linen |
8.3 Consumer sentiment towards home decor trends |
8.4 Percentage of households investing in table linen for hosting events |
8.5 Adoption rate of sustainable and eco-friendly table linen options |
9 Slovenia Table linen Market - Opportunity Assessment |
9.1 Slovenia Table linen Market Opportunity Assessment, By Material, 2022 & 2032F |
9.2 Slovenia Table linen Market Opportunity Assessment, By Application, 2022 & 2032F |
9.3 Slovenia Table linen Market Opportunity Assessment, By Distribution Channel, 2022 & 2032F |
10 Slovenia Table linen Market - Competitive Landscape |
10.1 Slovenia Table linen Market Revenue Share, By Companies, 2025 |
10.2 Slovenia Table linen Market Competitive Benchmarking, By Operating and Technical Parameters |
11 Company Profiles |
12 Recommendations | 13 Disclaimer |
Global Go To Market Strategy - 2030
Export potential enables firms to identify high-growth global markets with greater confidence by combining advanced trade intelligence with a structured quantitative methodology. The framework analyzes emerging demand trends and country-level import patterns while integrating macroeconomic and trade datasets such as GDP and population forecasts, bilateral import–export flows, tariff structures, elasticity differentials between developed and developing economies, geographic distance, and import demand projections. Using weighted trade values from 2020–2024 as the base period to project country-to-country export potential for 2030, these inputs are operationalized through calculated drivers such as gravity model parameters, tariff impact factors, and projected GDP per-capita growth. Through an analysis of hidden potentials, demand hotspots, and market conditions that are most favorable to success, this method enables firms to focus on target countries, maximize returns, and global expansion with data, backed by accuracy.
By factoring in the projected importer demand gap that is currently unmet and could be potential opportunity, it identifies the potential for the Exporter (Country) among 190 countries, against the general trade analysis, which identifies the biggest importer or exporter.
To discover high-growth global markets and optimize your business strategy:
Click Here
Pricing
- Single User License$ 1,995
- Department License$ 2,400
- Site License$ 3,120
- Global License$ 3,795

Leadership Perspectives from Industry Events
Search
Thought Leadership and Analyst Meet


Our Clients
6WResearch In News
- Doha a strategic location for EV manufacturing hub: IPA Qatar
- Demand for luxury TVs surging in the GCC, says Samsung
- Empowering Growth: The Thriving Journey of Bangladesh’s Cable Industry
- Demand for luxury TVs surging in the GCC, says Samsung
- Video call with a traditional healer? Once unthinkable, it’s now common in South Africa
- Intelligent Buildings To Smooth GCC’s Path To Net Zero
Latest Reports
- Taiwan Airport Wireless Infrastructure Market (2026-2032)
- Vietnam Airport Wireless Infrastructure Market (2026-2032)
- Thailand Airport Wireless Infrastructure Market (2026-2032)
- South Korea Airport Wireless Infrastructure Market (2026-2032)
- Romania Airport Wireless Infrastructure Market (2026-2032)
- Qatar Airport Wireless Infrastructure Market (2026-2032)
- Philippines Airport Wireless Infrastructure Market (2026-2032)
- Japan Airport Wireless Infrastructure Market (2026-2032)
- Taiwan Airport Winter Services Market (2026-2032)
- Vietnam Airport Winter Services Market (2026-2032)
Industry Events and Analyst Meet

HIMTEX 2026

India Refining Summit 2026

India EV Show 2026

EV tech India Expo 2026

Auto Tech Asia 2026
Whitepaper
- Middle East & Africa Commercial Security Market Click here to view more.
- Middle East & Africa Fire Safety Systems & Equipment Market Click here to view more.
- GCC Drone Market Click here to view more.
- Middle East Lighting Fixture Market Click here to view more.
- GCC Physical & Perimeter Security Market Click here to view more.