Slovenia Tin Market (2026-2032) | Companies, Value, Analysis, Share, Segmentation, Size, Growth, Revenue, Outlook, Industry, Forecast & Trends
Market Forecast By Product Type (Metal, Alloy, Compounds), By Application (Solder, Tin Plating, Chemicals, Other), By End-user Industry (Automotive, Electronics, Packaging (Food and Beverage), Glass, Other) And Competitive Landscape
| Product Code: ETC4861118 | Publication Date: Nov 2023 | Updated Date: Apr 2026 | Product Type: Market Research Report | |
| Publisher: 6Wresearch | Author: Shubham Padhi | No. of Pages: 60 | No. of Figures: 30 | No. of Tables: 5 |
Slovenia Tin Market Size (2020-2030)
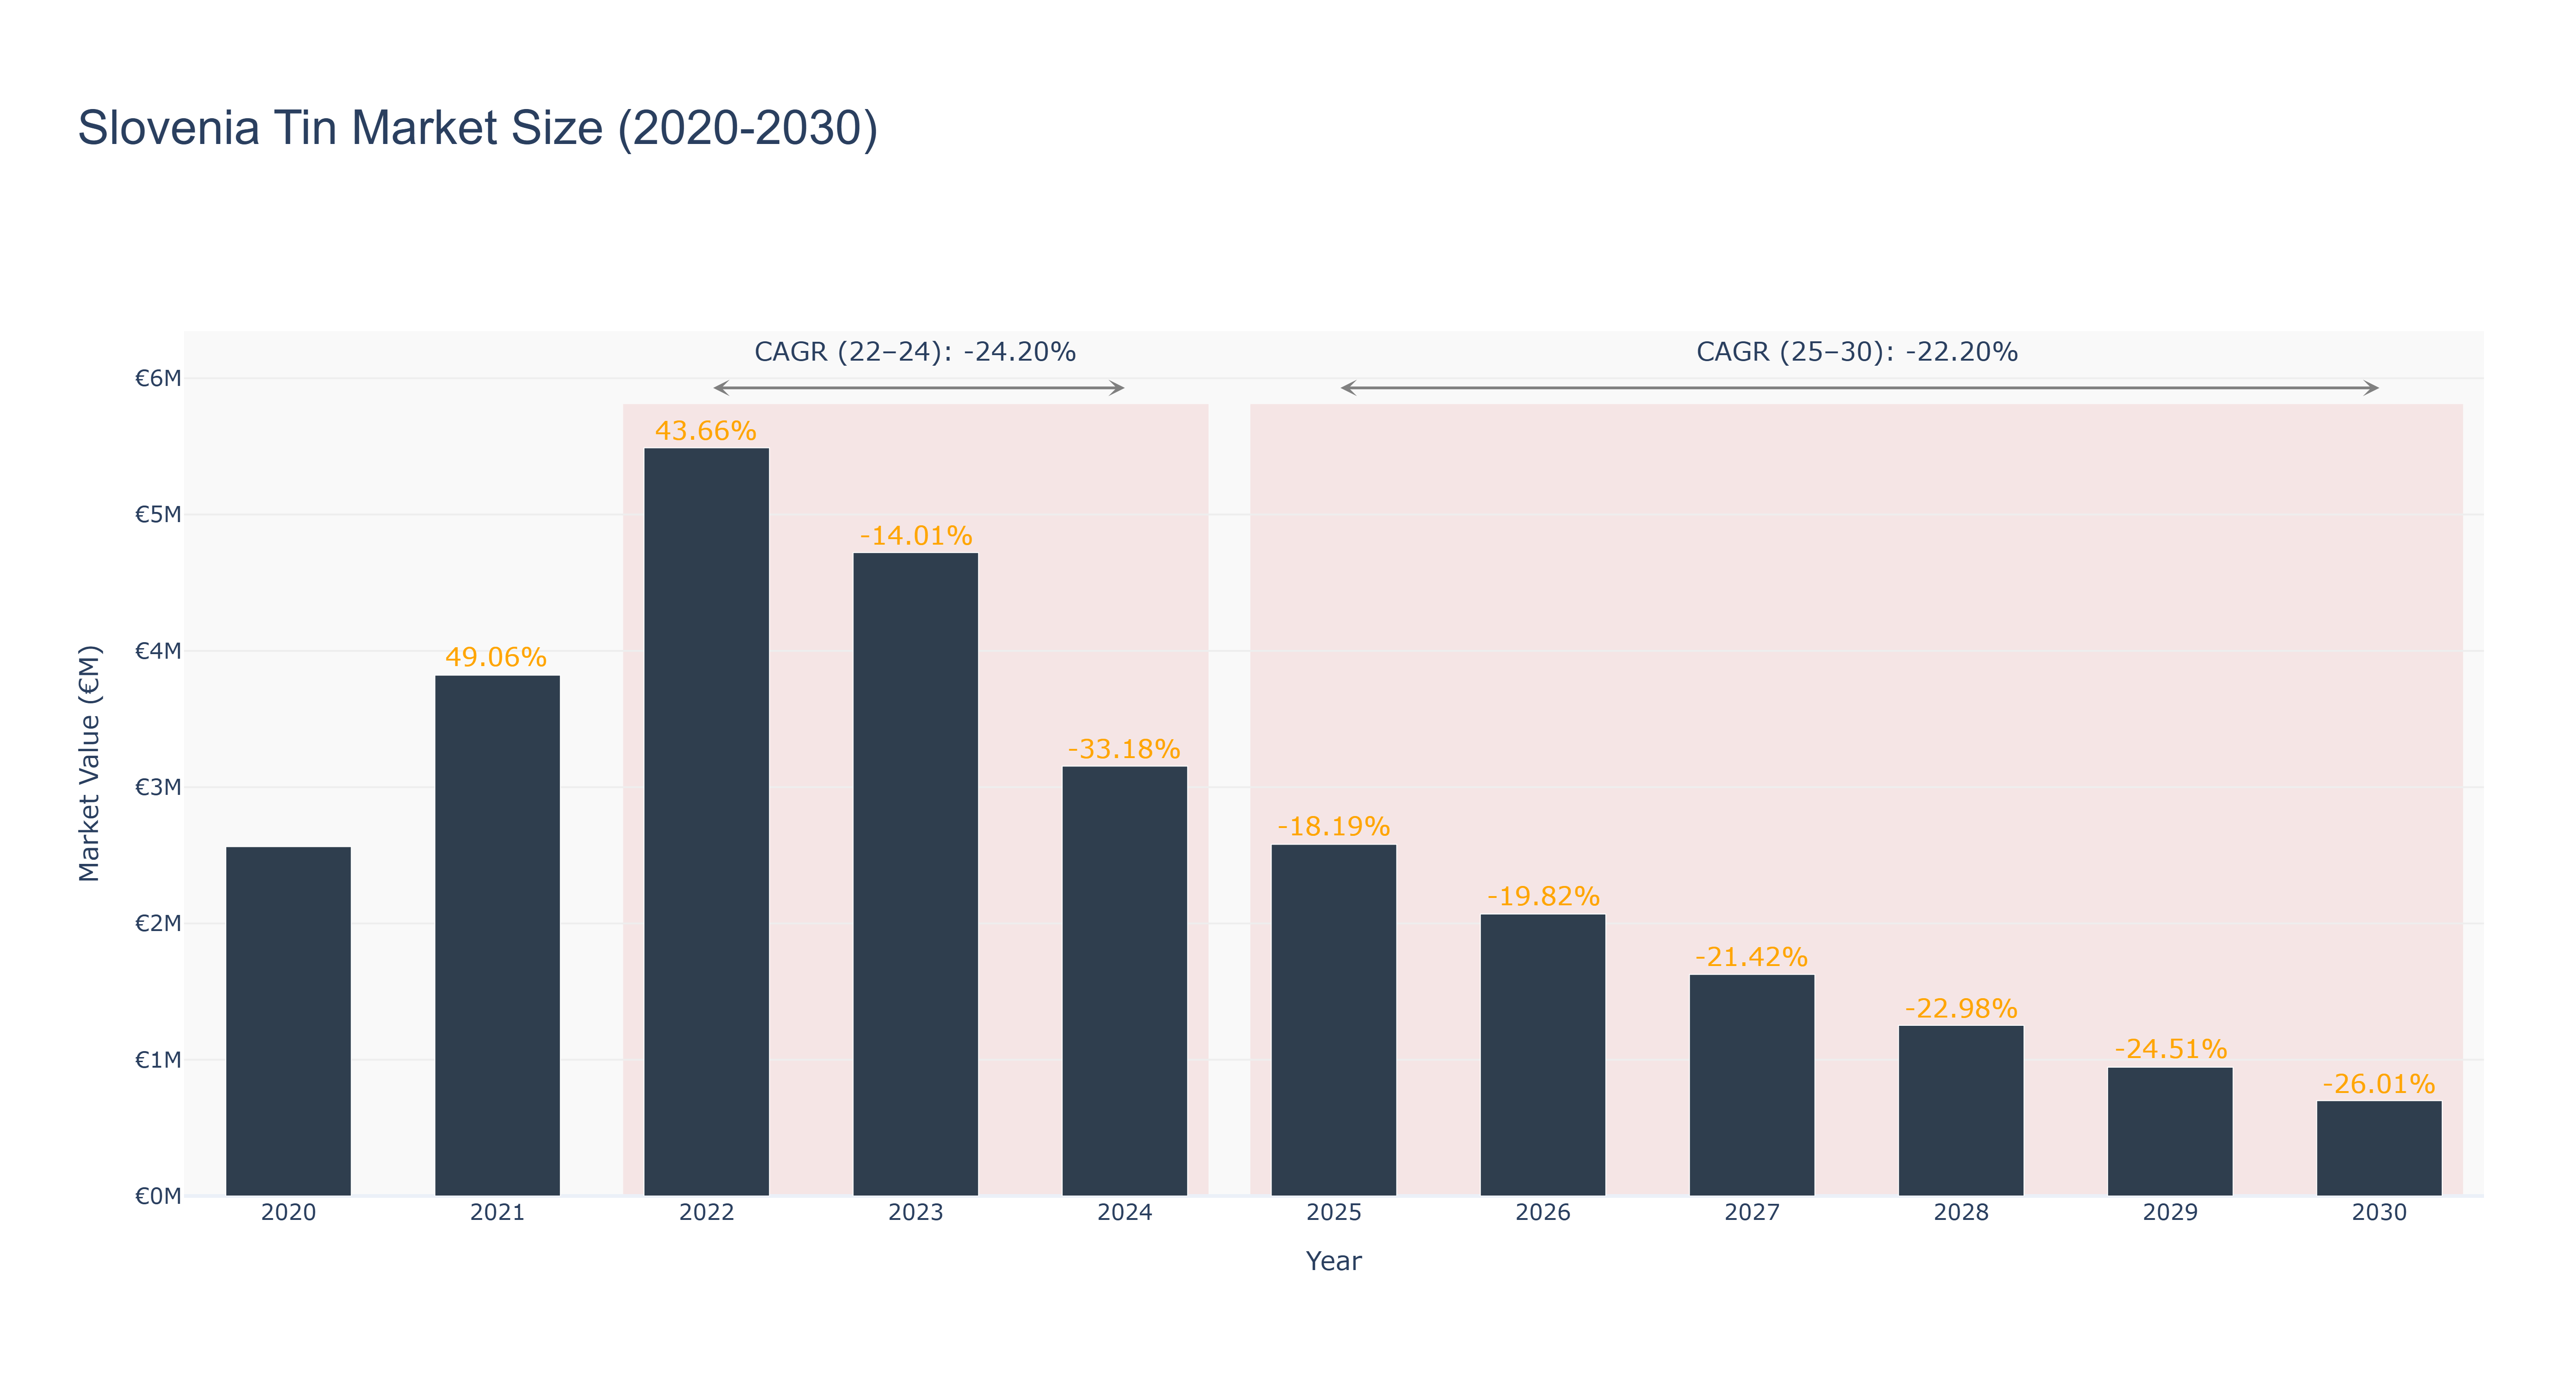
Slovenia Tin Market has experienced a significant decline in market size over the past decade. The peak market size of €5.49 million was recorded in 2022, followed by a steady decrease to €0.70 million in 2030. The CAGR from 2022 to 2024 was -24.20%, while the forecasted CAGR from 2025 to 2030 is -22.20%. The downward trend can be attributed to various factors such as changes in consumer preferences, global economic conditions, and technological advancements impacting the tin industry. Looking ahead, Slovenia is focusing on sustainability initiatives in the tin market, with upcoming projects aimed at enhancing recycling processes and promoting eco-friendly tin production methods. These developments align with the industry drivers of environmental consciousness and resource efficiency, signaling a potential shift towards a more sustainable tin market in Slovenia.
Slovenia Tin Market: Production & Trade Performance (2019-2025)
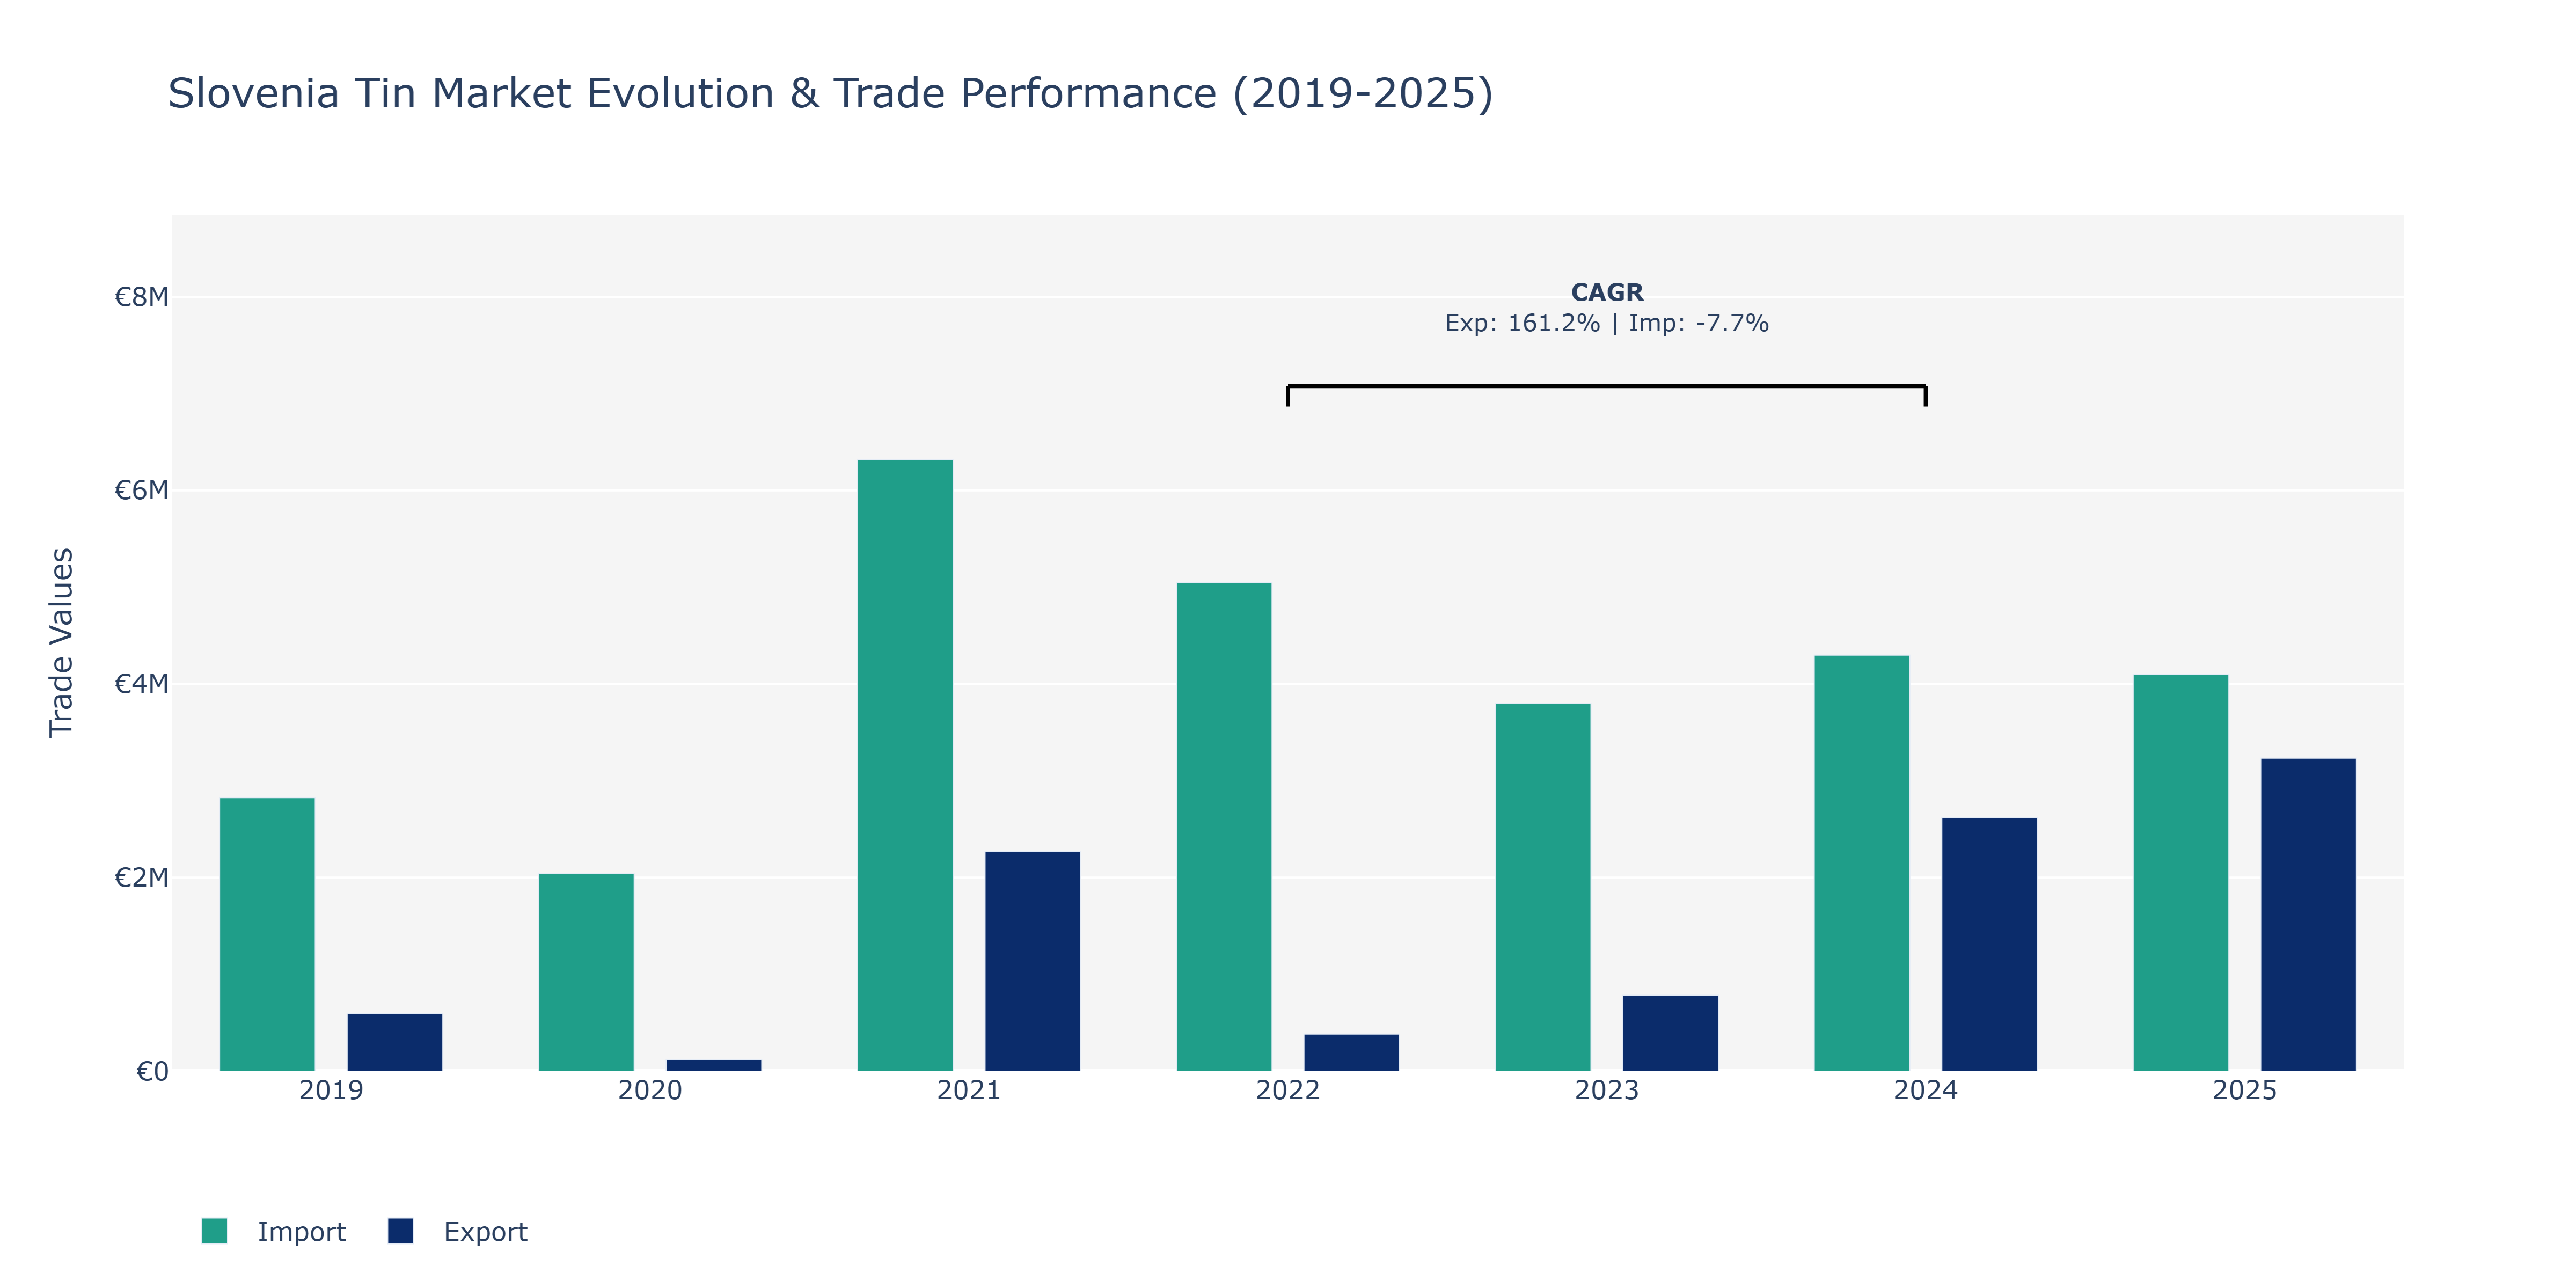
The Slovenia Tin Market saw notable fluctuations in both exports and imports from 2019 to 2025. During this period, exports showcased an upward trajectory, with a substantial increase from €596.17 thousand in 2019 to a peak of €3.23 million in 2025. This growth can be attributed to the rising global demand for tin-based products, driven by sectors such as electronics and automotive industries. Conversely, imports experienced fluctuating patterns, with a peak of €6.32 million in 2021 followed by a gradual decline to €4.1 million in 2025. The decline in imports could be influenced by local initiatives to boost domestic production or changes in international trade policies affecting tin imports. The contrasting trends between exports and imports indicate Slovenia's evolving position in the global tin market, emphasizing the country's role as both a supplier and consumer in the industry.
Key Highlights of the Report:
- Slovenia Tin Market Outlook
- Market Size of Slovenia Tin Market, 2025
- Forecast of Slovenia Tin Market, 2032
- Historical Data and Forecast of Slovenia Tin Revenues & Volume for the Period 2022-2032F
- Slovenia Tin Market Trend Evolution
- Slovenia Tin Market Drivers and Challenges
- Slovenia Tin Price Trends
- Slovenia Tin Porter`s Five Forces
- Slovenia Tin Industry Life Cycle
- Historical Data and Forecast of Slovenia Tin Market Revenues & Volume By Product Type for the Period 2022-2032F
- Historical Data and Forecast of Slovenia Tin Market Revenues & Volume By Metal for the Period 2022-2032F
- Historical Data and Forecast of Slovenia Tin Market Revenues & Volume By Alloy for the Period 2022-2032F
- Historical Data and Forecast of Slovenia Tin Market Revenues & Volume By Compounds for the Period 2022-2032F
- Historical Data and Forecast of Slovenia Tin Market Revenues & Volume By Application for the Period 2022-2032F
- Historical Data and Forecast of Slovenia Tin Market Revenues & Volume By Solder for the Period 2022-2032F
- Historical Data and Forecast of Slovenia Tin Market Revenues & Volume By Tin Plating for the Period 2022-2032F
- Historical Data and Forecast of Slovenia Tin Market Revenues & Volume By Chemicals for the Period 2022-2032F
- Historical Data and Forecast of Slovenia Tin Market Revenues & Volume By Other for the Period 2022-2032F
- Historical Data and Forecast of Slovenia Tin Market Revenues & Volume By End-user Industry for the Period 2022-2032F
- Historical Data and Forecast of Slovenia Tin Market Revenues & Volume By Automotive for the Period 2022-2032F
- Historical Data and Forecast of Slovenia Tin Market Revenues & Volume By Electronics for the Period 2022-2032F
- Historical Data and Forecast of Slovenia Tin Market Revenues & Volume By Packaging (Food and Beverage) for the Period 2022-2032F
- Historical Data and Forecast of Slovenia Tin Market Revenues & Volume By Glass for the Period 2022-2032F
- Historical Data and Forecast of Slovenia Tin Market Revenues & Volume By Other for the Period 2022-2032F
- Slovenia Tin Import Export Trade Statistics
- Market Opportunity Assessment By Product Type
- Market Opportunity Assessment By Application
- Market Opportunity Assessment By End-user Industry
- Slovenia Tin Top Companies Market Share
- Slovenia Tin Competitive Benchmarking By Technical and Operational Parameters
- Slovenia Tin Company Profiles
- Slovenia Tin Key Strategic Recommendations
Frequently Asked Questions About the Market Study (FAQs):
6Wresearch actively monitors the Slovenia Tin Market and publishes its comprehensive annual report, highlighting emerging trends, growth drivers, revenue analysis, and forecast outlook. Our insights help businesses to make data-backed strategic decisions with ongoing market dynamics. Our analysts track relevent industries related to the Slovenia Tin Market, allowing our clients with actionable intelligence and reliable forecasts tailored to emerging regional needs.
Yes, we provide customisation as per your requirements. To learn more, feel free to contact us on sales@6wresearch.com
1 Executive Summary |
2 Introduction |
2.1 Key Highlights of the Report |
2.2 Report Description |
2.3 Market Scope & Segmentation |
2.4 Research Methodology |
2.5 Assumptions |
3 Slovenia Tin Market Overview |
3.1 Slovenia Country Macro Economic Indicators |
3.2 Slovenia Tin Market Revenues & Volume, 2022 & 2032F |
3.3 Slovenia Tin Market - Industry Life Cycle |
3.4 Slovenia Tin Market - Porter's Five Forces |
3.5 Slovenia Tin Market Revenues & Volume Share, By Product Type, 2022 & 2032F |
3.6 Slovenia Tin Market Revenues & Volume Share, By Application, 2022 & 2032F |
3.7 Slovenia Tin Market Revenues & Volume Share, By End-user Industry, 2022 & 2032F |
4 Slovenia Tin Market Dynamics |
4.1 Impact Analysis |
4.2 Market Drivers |
4.2.1 Increasing demand for tin in the electronics industry due to its use in manufacturing solder and electronic components |
4.2.2 Growing awareness about the benefits of tin as a sustainable packaging material, leading to its increased adoption in the food and beverage industry |
4.3 Market Restraints |
4.3.1 Fluctuating prices of tin in the global market affecting the profitability of tin producers in Slovenia |
4.3.2 Competition from alternative materials like aluminum and steel impacting the demand for tin in certain applications |
5 Slovenia Tin Market Trends |
6 Slovenia Tin Market Segmentations |
6.1 Slovenia Tin Market, By Product Type |
6.1.1 Overview and Analysis |
6.1.2 Slovenia Tin Market Revenues & Volume, By Metal, 2022-2032F |
6.1.3 Slovenia Tin Market Revenues & Volume, By Alloy, 2022-2032F |
6.1.4 Slovenia Tin Market Revenues & Volume, By Compounds, 2022-2032F |
6.2 Slovenia Tin Market, By Application |
6.2.1 Overview and Analysis |
6.2.2 Slovenia Tin Market Revenues & Volume, By Solder, 2022-2032F |
6.2.3 Slovenia Tin Market Revenues & Volume, By Tin Plating, 2022-2032F |
6.2.4 Slovenia Tin Market Revenues & Volume, By Chemicals, 2022-2032F |
6.2.5 Slovenia Tin Market Revenues & Volume, By Other, 2022-2032F |
6.3 Slovenia Tin Market, By End-user Industry |
6.3.1 Overview and Analysis |
6.3.2 Slovenia Tin Market Revenues & Volume, By Automotive, 2022-2032F |
6.3.3 Slovenia Tin Market Revenues & Volume, By Electronics, 2022-2032F |
6.3.4 Slovenia Tin Market Revenues & Volume, By Packaging (Food and Beverage), 2022-2032F |
6.3.5 Slovenia Tin Market Revenues & Volume, By Glass, 2022-2032F |
6.3.6 Slovenia Tin Market Revenues & Volume, By Other, 2022-2032F |
7 Slovenia Tin Market Import-Export Trade Statistics |
7.1 Slovenia Tin Market Export to Major Countries |
7.2 Slovenia Tin Market Imports from Major Countries |
8 Slovenia Tin Market Key Performance Indicators |
8.1 Percentage of tin recycled in Slovenia's manufacturing processes, indicating sustainability efforts and cost management |
8.2 Number of new product launches using tin packaging in the food and beverage sector, reflecting market acceptance and growth potential |
8.3 Investment in research and development for tin applications in emerging industries, showcasing innovation and future market opportunities |
9 Slovenia Tin Market - Opportunity Assessment |
9.1 Slovenia Tin Market Opportunity Assessment, By Product Type, 2022 & 2032F |
9.2 Slovenia Tin Market Opportunity Assessment, By Application, 2022 & 2032F |
9.3 Slovenia Tin Market Opportunity Assessment, By End-user Industry, 2022 & 2032F |
10 Slovenia Tin Market - Competitive Landscape |
10.1 Slovenia Tin Market Revenue Share, By Companies, 2025 |
10.2 Slovenia Tin Market Competitive Benchmarking, By Operating and Technical Parameters |
11 Company Profiles |
12 Recommendations | 13 Disclaimer |
Export potential assessment - trade Analytics for 2030
Export potential enables firms to identify high-growth global markets with greater confidence by combining advanced trade intelligence with a structured quantitative methodology. The framework analyzes emerging demand trends and country-level import patterns while integrating macroeconomic and trade datasets such as GDP and population forecasts, bilateral import–export flows, tariff structures, elasticity differentials between developed and developing economies, geographic distance, and import demand projections. Using weighted trade values from 2020–2024 as the base period to project country-to-country export potential for 2030, these inputs are operationalized through calculated drivers such as gravity model parameters, tariff impact factors, and projected GDP per-capita growth. Through an analysis of hidden potentials, demand hotspots, and market conditions that are most favorable to success, this method enables firms to focus on target countries, maximize returns, and global expansion with data, backed by accuracy.
By factoring in the projected importer demand gap that is currently unmet and could be potential opportunity, it identifies the potential for the Exporter (Country) among 190 countries, against the general trade analysis, which identifies the biggest importer or exporter.
To discover high-growth global markets and optimize your business strategy:
Click Here
Pricing
- Single User License$ 1,995
- Department License$ 2,400
- Site License$ 3,120
- Global License$ 3,795

Search
Thought Leadership and Analyst Meet


Our Clients
Latest Reports
- France Thermally Conductive Filler Dispersants Market (2026-2032) | Challenges, Restraints, Value, Share, Size, segmentation, Analysis, Trends, Investment Opportunities, Outlook, Pricing, Demand, Forecast, Revenue, Companies, Growth, Drivers, Strategy, Insights, Competition
- Egypt Thermally Conductive Filler Dispersants Market (2026-2032) | Competition, Forecast, Strategy, Value, Insights, Outlook, Investment Opportunities, Pricing, Demand, Share, segmentation, Drivers, Size, Companies, Restraints, Growth, Trends, Revenue, Challenges, Analysis
- Czech Republic Thermally Conductive Filler Dispersants Market (2026-2032) | Forecast, Pricing, Analysis, Drivers, Insights, Size, Demand, Growth, Challenges, segmentation, Competition, Outlook, Trends, Investment Opportunities, Companies, Strategy, Revenue, Share, Value, Restraints
- Colombia Thermally Conductive Filler Dispersants Market (2026-2032) | segmentation, Trends, Share, Drivers, Strategy, Companies, Demand, Insights, Size, Challenges, Value, Competition, Analysis, Growth, Revenue, Restraints, Forecast, Pricing, Outlook, Investment Opportunities
- China Thermally Conductive Filler Dispersants Market (2026-2032) | Restraints, Investment Opportunities, Pricing, Companies, Share, Size, Challenges, Trends, Outlook, Value, Analysis, Competition, Revenue, Drivers, Forecast, Demand, Insights, Growth, Strategy, segmentation
- Chile Thermally Conductive Filler Dispersants Market (2026-2032) | Investment Opportunities, Trends, Value, Restraints, Share, Companies, Forecast, segmentation, Pricing, Challenges, Demand, Size, Analysis, Drivers, Outlook, Growth, Competition, Strategy, Revenue, Insights
- Cambodia Thermally Conductive Filler Dispersants Market (2026-2032) | Analysis, Share, Outlook, Strategy, Pricing, Demand, Size, Growth, segmentation, Insights, Revenue, Forecast, Challenges, Competition, Companies, Investment Opportunities, Trends, Restraints, Value, Drivers
- Brazil Thermally Conductive Filler Dispersants Market (2026-2032) | Restraints, Forecast, Competition, Size, Revenue, Value, Investment Opportunities, Trends, Insights, Outlook, Growth, Analysis, Drivers, segmentation, Pricing, Challenges, Strategy, Share, Companies, Demand
- Bangladesh Thermally Conductive Filler Dispersants Market (2026-2032) | Restraints, Trends, Analysis, Competition, Insights, Forecast, Value, Investment Opportunities, Pricing, Share, Demand, Outlook, Revenue, segmentation, Companies, Drivers, Growth, Size, Challenges, Strategy
- Bahrain Thermally Conductive Filler Dispersants Market (2026-2032) | Trends, Outlook, Pricing, Demand, Value, Competition, Forecast, Growth, segmentation, Revenue, Companies, Analysis, Insights, Size, Drivers, Challenges, Strategy, Investment Opportunities, Share, Restraints
Industry Events and Analyst Meet

HIMTEX 2026

India Refining Summit 2026

India EV Show 2026

EV tech India Expo 2026

Auto Tech Asia 2026
Whitepaper
- Middle East & Africa Commercial Security Market Click here to view more.
- Middle East & Africa Fire Safety Systems & Equipment Market Click here to view more.
- GCC Drone Market Click here to view more.
- Middle East Lighting Fixture Market Click here to view more.
- GCC Physical & Perimeter Security Market Click here to view more.
6WResearch In News
- Doha a strategic location for EV manufacturing hub: IPA Qatar
- Demand for luxury TVs surging in the GCC, says Samsung
- Empowering Growth: The Thriving Journey of Bangladesh’s Cable Industry
- Demand for luxury TVs surging in the GCC, says Samsung
- Video call with a traditional healer? Once unthinkable, it’s now common in South Africa
- Intelligent Buildings To Smooth GCC’s Path To Net Zero