South Africa Enriched Food Market (2026-2032) | Demand, Restraints, Outlook, Opportunities, Trends, Competition, Segments, Growth, Competitive, Industry, Revenue, Segmentation, Strategic Insights, Pricing Analysis, Analysis, Forecast, Share, Supply, Consumer Insights, Value, Drivers, Strategy, Companies, Challenges, Investment Trends, Size
Market Forecast By Product Type (Fortified Dairy Products, Nutrient-Enriched Cereals, Functional Beverages, Enhanced Meat Products), By Nutrient Type (Vitamins, Minerals, Omega Fatty Acids, Probiotics), By Application (Infant Nutrition, Sports Nutrition, Geriatric Nutrition, General Nutrition), By End User (Households, Athletes, Healthcare Centers, Food Service Providers), By Distribution Channel (Supermarkets, Convenience Stores, Online Retail, Specialty Stores) And Competitive Landscape
| Product Code: ETC11875689 | Publication Date: Apr 2025 | Updated Date: Feb 2026 | Product Type: Market Research Report | |
| Publisher: 6Wresearch | No. of Pages: 65 | No. of Figures: 34 | No. of Tables: 19 | |
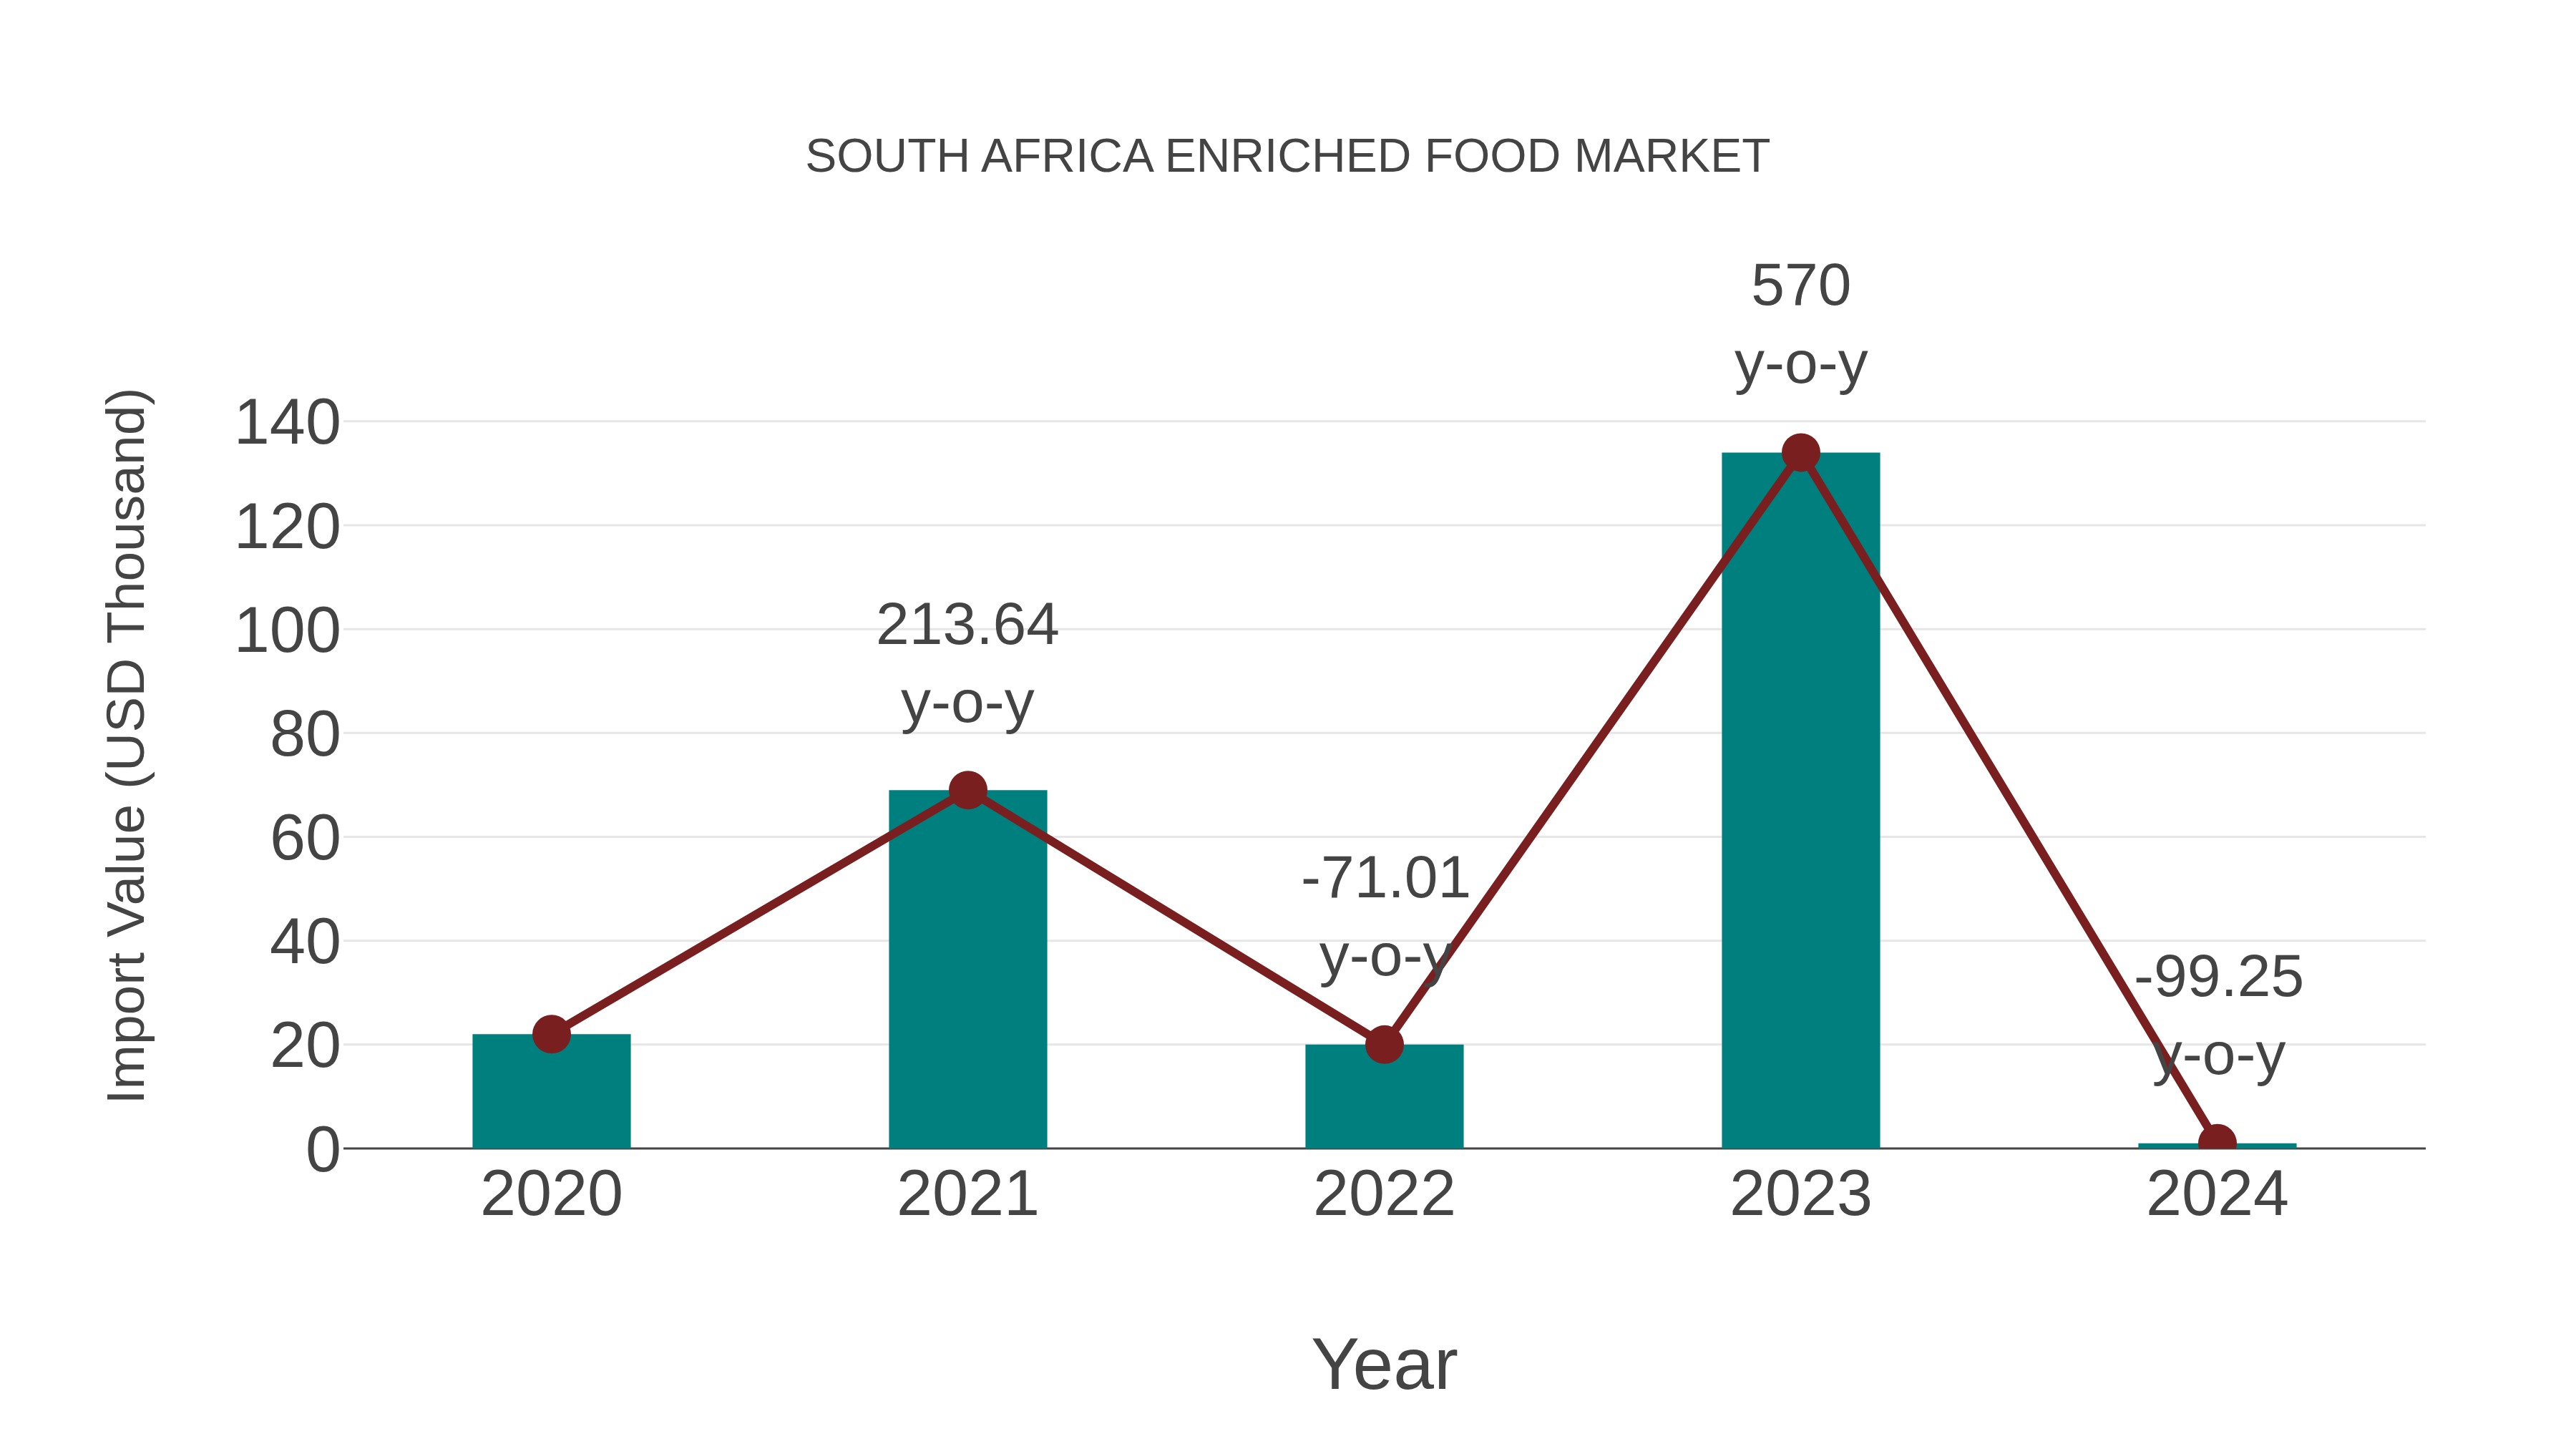
South Africa Enriched Food Market: Import Trend Analysis
South Africa`s import trend for the enriched food market showed a significant decline from 2023 to 2024, with a growth rate of -99.25%. The compound annual growth rate (CAGR) for the period 2020-2024 stood at -53.83%. This sharp decrease could be attributed to shifts in consumer preferences, changing trade policies, or market instability during that period.
Key Highlights of the Report:
- South Africa Enriched Food Market Outlook
- Market Size of South Africa Enriched Food Market, 2025
- Forecast of South Africa Enriched Food Market, 2032
- Historical Data and Forecast of South Africa Enriched Food Revenues & Volume for the Period 2022-2032F
- South Africa Enriched Food Market Trend Evolution
- South Africa Enriched Food Market Drivers and Challenges
- South Africa Enriched Food Price Trends
- South Africa Enriched Food Porter's Five Forces
- South Africa Enriched Food Industry Life Cycle
- Historical Data and Forecast of South Africa Enriched Food Market Revenues & Volume By Product Type for the Period 2022-2032F
- Historical Data and Forecast of South Africa Enriched Food Market Revenues & Volume By Fortified Dairy Products for the Period 2022-2032F
- Historical Data and Forecast of South Africa Enriched Food Market Revenues & Volume By Nutrient-Enriched Cereals for the Period 2022-2032F
- Historical Data and Forecast of South Africa Enriched Food Market Revenues & Volume By Functional Beverages for the Period 2022-2032F
- Historical Data and Forecast of South Africa Enriched Food Market Revenues & Volume By Enhanced Meat Products for the Period 2022-2032F
- Historical Data and Forecast of South Africa Enriched Food Market Revenues & Volume By Nutrient Type for the Period 2022-2032F
- Historical Data and Forecast of South Africa Enriched Food Market Revenues & Volume By Vitamins for the Period 2022-2032F
- Historical Data and Forecast of South Africa Enriched Food Market Revenues & Volume By Minerals for the Period 2022-2032F
- Historical Data and Forecast of South Africa Enriched Food Market Revenues & Volume By Omega Fatty Acids for the Period 2022-2032F
- Historical Data and Forecast of South Africa Enriched Food Market Revenues & Volume By Probiotics for the Period 2022-2032F
- Historical Data and Forecast of South Africa Enriched Food Market Revenues & Volume By Application for the Period 2022-2032F
- Historical Data and Forecast of South Africa Enriched Food Market Revenues & Volume By Infant Nutrition for the Period 2022-2032F
- Historical Data and Forecast of South Africa Enriched Food Market Revenues & Volume By Sports Nutrition for the Period 2022-2032F
- Historical Data and Forecast of South Africa Enriched Food Market Revenues & Volume By Geriatric Nutrition for the Period 2022-2032F
- Historical Data and Forecast of South Africa Enriched Food Market Revenues & Volume By General Nutrition for the Period 2022-2032F
- Historical Data and Forecast of South Africa Enriched Food Market Revenues & Volume By End User for the Period 2022-2032F
- Historical Data and Forecast of South Africa Enriched Food Market Revenues & Volume By Households for the Period 2022-2032F
- Historical Data and Forecast of South Africa Enriched Food Market Revenues & Volume By Athletes for the Period 2022-2032F
- Historical Data and Forecast of South Africa Enriched Food Market Revenues & Volume By Healthcare Centers for the Period 2022-2032F
- Historical Data and Forecast of South Africa Enriched Food Market Revenues & Volume By Food Service Providers for the Period 2022-2032F
- Historical Data and Forecast of South Africa Enriched Food Market Revenues & Volume By Distribution Channel for the Period 2022-2032F
- Historical Data and Forecast of South Africa Enriched Food Market Revenues & Volume By Supermarkets for the Period 2022-2032F
- Historical Data and Forecast of South Africa Enriched Food Market Revenues & Volume By Convenience Stores for the Period 2022-2032F
- Historical Data and Forecast of South Africa Enriched Food Market Revenues & Volume By Online Retail for the Period 2022-2032F
- Historical Data and Forecast of South Africa Enriched Food Market Revenues & Volume By Specialty Stores for the Period 2022 - 2032F
- South Africa Enriched Food Import Export Trade Statistics
- Market Opportunity Assessment By Product Type
- Market Opportunity Assessment By Nutrient Type
- Market Opportunity Assessment By Application
- Market Opportunity Assessment By End User
- Market Opportunity Assessment By Distribution Channel
- South Africa Enriched Food Top Companies Market Share
- South Africa Enriched Food Competitive Benchmarking By Technical and Operational Parameters
- South Africa Enriched Food Company Profiles
- South Africa Enriched Food Key Strategic Recommendations
Frequently Asked Questions About the Market Study (FAQs):
6Wresearch actively monitors the South Africa Enriched Food Market and publishes its comprehensive annual report, highlighting emerging trends, growth drivers, revenue analysis, and forecast outlook. Our insights help businesses to make data-backed strategic decisions with ongoing market dynamics. Our analysts track relevent industries related to the South Africa Enriched Food Market, allowing our clients with actionable intelligence and reliable forecasts tailored to emerging regional needs.
Yes, we provide customisation as per your requirements. To learn more, feel free to contact us on sales@6wresearch.com
1 Executive Summary |
2 Introduction |
2.1 Key Highlights of the Report |
2.2 Report Description |
2.3 Market Scope & Segmentation |
2.4 Research Methodology |
2.5 Assumptions |
3 South Africa Enriched Food Market Overview |
3.1 South Africa Country Macro Economic Indicators |
3.2 South Africa Enriched Food Market Revenues & Volume, 2022 & 2032F |
3.3 South Africa Enriched Food Market - Industry Life Cycle |
3.4 South Africa Enriched Food Market - Porter's Five Forces |
3.5 South Africa Enriched Food Market Revenues & Volume Share, By Product Type, 2022 & 2032F |
3.6 South Africa Enriched Food Market Revenues & Volume Share, By Nutrient Type, 2022 & 2032F |
3.7 South Africa Enriched Food Market Revenues & Volume Share, By Application, 2022 & 2032F |
3.8 South Africa Enriched Food Market Revenues & Volume Share, By End User, 2022 & 2032F |
3.9 South Africa Enriched Food Market Revenues & Volume Share, By Distribution Channel, 2022 & 2032F |
4 South Africa Enriched Food Market Dynamics |
4.1 Impact Analysis |
4.2 Market Drivers |
4.2.1 Increasing health consciousness and awareness among consumers. |
4.2.2 Growing disposable income levels leading to higher spending on premium food products. |
4.2.3 Government initiatives promoting fortified and enriched food products. |
4.2.4 Rising urbanization and changing lifestyle preferences favoring convenience and nutrition-rich foods. |
4.3 Market Restraints |
4.3.1 Price sensitivity among consumers, especially in a price-sensitive market like South Africa. |
4.3.2 Lack of awareness and education about the benefits of enriched foods. |
4.3.3 Competition from traditional unfortified food products. |
4.3.4 Regulatory challenges and compliance requirements for enriched food products. |
5 South Africa Enriched Food Market Trends |
6 South Africa Enriched Food Market, By Types |
6.1 South Africa Enriched Food Market, By Product Type |
6.1.1 Overview and Analysis |
6.1.2 South Africa Enriched Food Market Revenues & Volume, By Product Type, 2022 - 2032F |
6.1.3 South Africa Enriched Food Market Revenues & Volume, By Fortified Dairy Products, 2022 - 2032F |
6.1.4 South Africa Enriched Food Market Revenues & Volume, By Nutrient-Enriched Cereals, 2022 - 2032F |
6.1.5 South Africa Enriched Food Market Revenues & Volume, By Functional Beverages, 2022 - 2032F |
6.1.6 South Africa Enriched Food Market Revenues & Volume, By Enhanced Meat Products, 2022 - 2032F |
6.2 South Africa Enriched Food Market, By Nutrient Type |
6.2.1 Overview and Analysis |
6.2.2 South Africa Enriched Food Market Revenues & Volume, By Vitamins, 2022 - 2032F |
6.2.3 South Africa Enriched Food Market Revenues & Volume, By Minerals, 2022 - 2032F |
6.2.4 South Africa Enriched Food Market Revenues & Volume, By Omega Fatty Acids, 2022 - 2032F |
6.2.5 South Africa Enriched Food Market Revenues & Volume, By Probiotics, 2022 - 2032F |
6.3 South Africa Enriched Food Market, By Application |
6.3.1 Overview and Analysis |
6.3.2 South Africa Enriched Food Market Revenues & Volume, By Infant Nutrition, 2022 - 2032F |
6.3.3 South Africa Enriched Food Market Revenues & Volume, By Sports Nutrition, 2022 - 2032F |
6.3.4 South Africa Enriched Food Market Revenues & Volume, By Geriatric Nutrition, 2022 - 2032F |
6.3.5 South Africa Enriched Food Market Revenues & Volume, By General Nutrition, 2022 - 2032F |
6.4 South Africa Enriched Food Market, By End User |
6.4.1 Overview and Analysis |
6.4.2 South Africa Enriched Food Market Revenues & Volume, By Households, 2022 - 2032F |
6.4.3 South Africa Enriched Food Market Revenues & Volume, By Athletes, 2022 - 2032F |
6.4.4 South Africa Enriched Food Market Revenues & Volume, By Healthcare Centers, 2022 - 2032F |
6.4.5 South Africa Enriched Food Market Revenues & Volume, By Food Service Providers, 2022 - 2032F |
6.5 South Africa Enriched Food Market, By Distribution Channel |
6.5.1 Overview and Analysis |
6.5.2 South Africa Enriched Food Market Revenues & Volume, By Supermarkets, 2022 - 2032F |
6.5.3 South Africa Enriched Food Market Revenues & Volume, By Convenience Stores, 2022 - 2032F |
6.5.4 South Africa Enriched Food Market Revenues & Volume, By Online Retail, 2022 - 2032F |
6.5.5 South Africa Enriched Food Market Revenues & Volume, By Specialty Stores, 2022 - 2032F |
7 South Africa Enriched Food Market Import-Export Trade Statistics |
7.1 South Africa Enriched Food Market Export to Major Countries |
7.2 South Africa Enriched Food Market Imports from Major Countries |
8 South Africa Enriched Food Market Key Performance Indicators |
8.1 Consumer awareness and perception towards enriched food products. |
8.2 Adoption rate of enriched food products in urban vs rural areas. |
8.3 Nutrient intake levels and dietary patterns among the target population. |
8.4 Market penetration and availability of enriched food products in local retail outlets. |
8.5 Trends in health and wellness industry influencing consumer preferences towards enriched foods. |
9 South Africa Enriched Food Market - Opportunity Assessment |
9.1 South Africa Enriched Food Market Opportunity Assessment, By Product Type, 2022 & 2032F |
9.2 South Africa Enriched Food Market Opportunity Assessment, By Nutrient Type, 2022 & 2032F |
9.3 South Africa Enriched Food Market Opportunity Assessment, By Application, 2022 & 2032F |
9.4 South Africa Enriched Food Market Opportunity Assessment, By End User, 2022 & 2032F |
9.5 South Africa Enriched Food Market Opportunity Assessment, By Distribution Channel, 2022 & 2032F |
10 South Africa Enriched Food Market - Competitive Landscape |
10.1 South Africa Enriched Food Market Revenue Share, By Companies, 2025 |
10.2 South Africa Enriched Food Market Competitive Benchmarking, By Operating and Technical Parameters |
11 Company Profiles |
12 Recommendations |
13 Disclaimer |
Global Go To Market Strategy - 2030
Export potential enables firms to identify high-growth global markets with greater confidence by combining advanced trade intelligence with a structured quantitative methodology. The framework analyzes emerging demand trends and country-level import patterns while integrating macroeconomic and trade datasets such as GDP and population forecasts, bilateral import–export flows, tariff structures, elasticity differentials between developed and developing economies, geographic distance, and import demand projections. Using weighted trade values from 2020–2024 as the base period to project country-to-country export potential for 2030, these inputs are operationalized through calculated drivers such as gravity model parameters, tariff impact factors, and projected GDP per-capita growth. Through an analysis of hidden potentials, demand hotspots, and market conditions that are most favorable to success, this method enables firms to focus on target countries, maximize returns, and global expansion with data, backed by accuracy.
By factoring in the projected importer demand gap that is currently unmet and could be potential opportunity, it identifies the potential for the Exporter (Country) among 190 countries, against the general trade analysis, which identifies the biggest importer or exporter.
To discover high-growth global markets and optimize your business strategy:
Click Here
Pricing
- Single User License$ 1,995
- Department License$ 2,400
- Site License$ 3,120
- Global License$ 3,795

Leadership Perspectives from Industry Events
Search
Thought Leadership and Analyst Meet


Our Clients
6WResearch In News
- Doha a strategic location for EV manufacturing hub: IPA Qatar
- Demand for luxury TVs surging in the GCC, says Samsung
- Empowering Growth: The Thriving Journey of Bangladesh’s Cable Industry
- Demand for luxury TVs surging in the GCC, says Samsung
- Video call with a traditional healer? Once unthinkable, it’s now common in South Africa
- Intelligent Buildings To Smooth GCC’s Path To Net Zero
Latest Reports
- Taiwan Airport Wireless Infrastructure Market (2026-2032)
- Vietnam Airport Wireless Infrastructure Market (2026-2032)
- Thailand Airport Wireless Infrastructure Market (2026-2032)
- South Korea Airport Wireless Infrastructure Market (2026-2032)
- Romania Airport Wireless Infrastructure Market (2026-2032)
- Qatar Airport Wireless Infrastructure Market (2026-2032)
- Philippines Airport Wireless Infrastructure Market (2026-2032)
- Japan Airport Wireless Infrastructure Market (2026-2032)
- Taiwan Airport Winter Services Market (2026-2032)
- Vietnam Airport Winter Services Market (2026-2032)
Industry Events and Analyst Meet

HIMTEX 2026

India Refining Summit 2026

India EV Show 2026

EV tech India Expo 2026

Auto Tech Asia 2026
Whitepaper
- Middle East & Africa Commercial Security Market Click here to view more.
- Middle East & Africa Fire Safety Systems & Equipment Market Click here to view more.
- GCC Drone Market Click here to view more.
- Middle East Lighting Fixture Market Click here to view more.
- GCC Physical & Perimeter Security Market Click here to view more.