Spain Interactive Tables Market (2026-2032) Outlook | Growth, Analysis, Trends, Share, Revenue, Value, Companies, Forecast, Size, Industry
Market Forecast By Technology (LCD, LED, Capacitive, Others), By Screen Size (32-65 Inch, 65 Inch & Above), By Application (Exhibition & Trade Shows, Education, Retail, Control Room, Hospitality, Transportation, Others) And Competitive Landscape
| Product Code: ETC275054 | Publication Date: Aug 2022 | Updated Date: Jul 2026 | Product Type: Market Research Report | |
| Publisher: 6Wresearch | Author: Ravi Bhandari | No. of Pages: 75 | No. of Figures: 35 | No. of Tables: 20 |
Spain Interactive Tables Market Size, Share & Growth Rate
The Spain Interactive Tables Market was estimated at USD 203 Million in 2025 and is projected to reach USD 239 Million by 2032, growing at a CAGR of 2.4% from 2026 to 2032. This growth is largely driven by the increasing demand for collaborative tools in educational institutions and corporate environments. As organizations recognize the value of enhanced teamwork and interactive learning experiences, the adoption of innovative solutions like interactive tables is expected to accelerate significantly.
Spain Interactive Tables Market Year-wise Growth Rate and Key Drivers
This graph highlights how the Spain Interactive Tables Market has steadily grown over the years, supported by major growth factors.
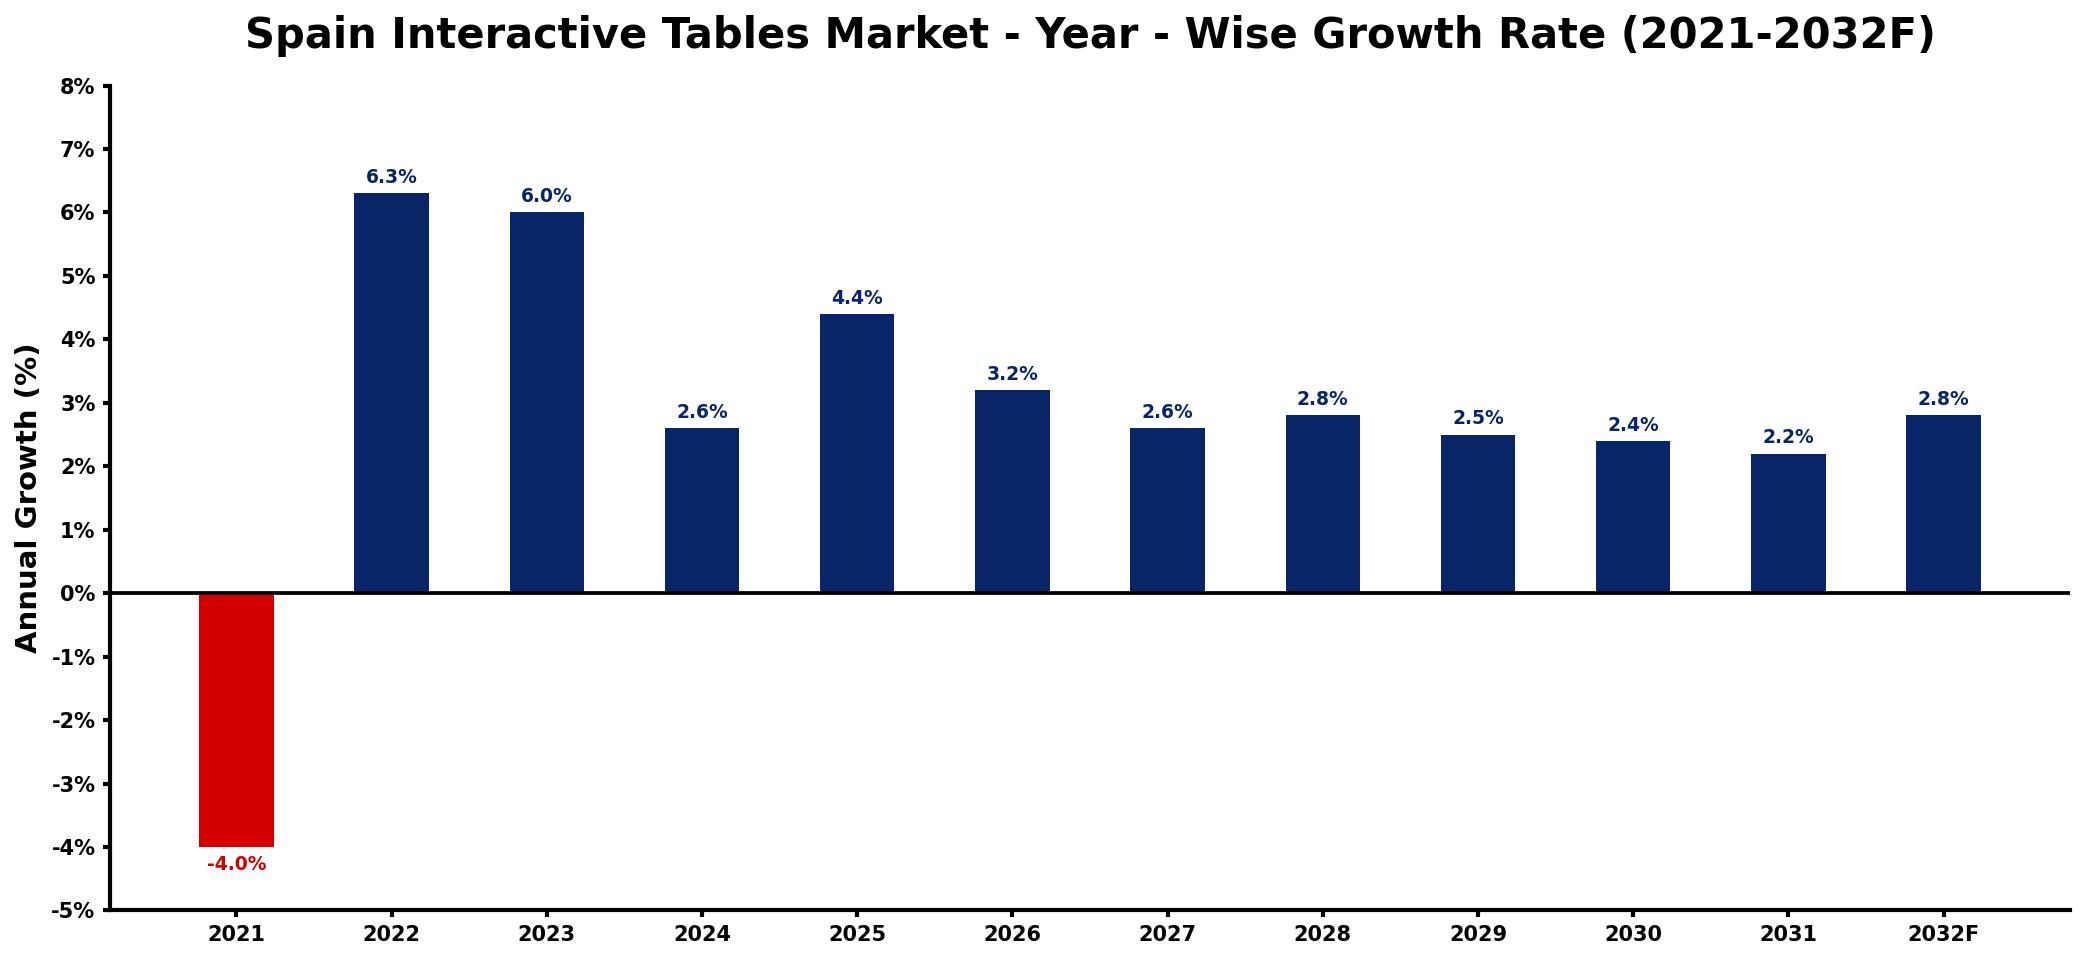
The table below presents the year‑wise growth rates along with the key drivers influencing the market
| Year | Growth Rate | Major Drivers |
| 2021 | -4.0% | decreased consumer spending on technology |
| 2022 | 6.3% | growing adoption in educational sector |
| 2023 | 6.0% | increased investments in digital transformation |
| 2024 | 2.6% | expansion of smart city initiatives |
| 2025 | 4.4% | rising demand from hospitality industry |
| 2026 | 3.2% | growing popularity in corporate training |
| 2027 | 2.6% | rising end-use demand growth |
| 2028 | 2.8% | expanding use in retail environments |
| 2029 | 2.5% | greater integration with mobile devices |
| 2030 | 2.4% | emerging trends in collaborative workspaces |
| 2031 | 2.2% | enhanced features attracting new users |
| 2032 | 2.8% | widespread adoption in event management |
Note: Market size estimations and growth projections presented in this report are based on 6Wresearch's proprietary forecasting methodology, utilizing the latest available industry data, government publications, and primary research inputs.
Spain Interactive Tables Market Synopsis
The most powerful force shaping the Spain Interactive Tables Market today is the growing emphasis on collaborative learning and working environments. Institutions and companies are investing in technology that fosters interaction and engagement, pushing the demand for interactive tables to new heights.
With advancements in touchscreen technology and intuitive user interfaces, interactive tables are becoming essential tools across various sectors. The push towards innovative educational methodologies further propels this market, as educators strive to adopt engaging solutions that improve learning outcomes.
Spain Interactive Tables Market Key Takeaways
- The Spain Interactive Tables Market is witnessing a notable growth trajectory, primarily driven by educational and corporate needs for collaboration.
- Advancements in technology are facilitating the development of more sophisticated and user-friendly interactive tables.
- High production costs may pose a barrier for smaller manufacturers aiming to enter the market.
- The governments supportive policies in Spain are creating a favorable environment for the adoption of interactive solutions.
- Competition from alternative collaboration tools necessitates continuous innovation within the interactive tables sector.
Evaluation of Restraints in Spain Interactive Tables Market
The Spain Interactive Tables Market faces several restraints that may impede its growth. One significant factor is the rapidly evolving technology landscape, which demands constant innovation from manufacturers. Companies must ensure that their products not only remain relevant but also offer seamless interactivity. High development and production costs can deter new entrants, particularly smaller firms that may struggle to compete with established players. Additionally, issues related to durability and maintenance are critical considerations for customers, influencing their purchasing decisions.
Spain Interactive Tables Market Trends
Key trends in the Spain Interactive Tables Market include an increased emphasis on customization and integration with other digital tools. Users are seeking solutions that can be tailored to their specific needs, enhancing their collaborative experiences. Moreover, as remote and hybrid work models become more prevalent, the demand for interactive solutions that support seamless interactions among dispersed teams is rising. These trends indicate a shift toward more dynamic and versatile interactive table applications.
Spain Interactive Tables Market Opportunities
Genuine growth opportunities lie within the educational sector, particularly as institutions invest in technology that enhances interactive learning. Furthermore, the corporate segment presents substantial potential as companies seek innovative collaboration tools to improve productivity and teamwork. Manufacturers that focus on developing features that enhance user experience and offer flexible solutions are likely to capitalize on these opportunities.
Government Initiatives in the Spain Interactive Tables Market
The Spanish government is actively promoting the enhancement of interactive learning environments through various initiatives. Public spending on educational technologies has been increasing, encouraging the adoption of solutions such as interactive tables in schools and universities. Policies that support innovation in education are facilitating the integration of digital tools into traditional teaching methods, ultimately benefiting the overall growth of the interactive tables market.
Future Insights of the Spain Interactive Tables Market
Looking ahead to 2026-2032, the Spain Interactive Tables Market is expected to continue its growth trajectory, driven by technological advancements and changing workplace dynamics. The demand for versatile, engaging, and interactive solutions will shape product development, leading to more refined applications that cater to various sectors. As education and corporate environments evolve, interactive tables are poised to become essential components of collaborative spaces, driving sustained market expansion.
Spain Interactive Tables Market Latest Developments (2025 - 2026)
Recent developments in the Spain Interactive Tables Market indicate a trend toward enhanced integration capabilities with other digital platforms, allowing for a more seamless user experience. Companies are focusing on refining the durability of their products to address consumer concerns. Additionally, there has been increased collaboration among educational institutions and technology providers to pilot advanced interactive solutions that encourage innovative teaching methods.
Spain Interactive Tables Market - Key Attractiveness of the Report
- 10 Years of Market Numbers
- Historical Data Starting from 2022 to 2025
- Base Year: 2025
- Forecast Data until 2032
- Key Performance Indicators Impacting the Market
- Major Upcoming Developments and Projects
Key Highlights of the Report:
- Spain Interactive Tables Market Outlook
- Market Size of Spain Interactive Tables Market, 2025
- Forecast of Spain Interactive Tables Market, 2032
- Historical Data and Forecast of Spain Interactive Tables Revenues & Volume for the Period 2022-2032F
- Spain Interactive Tables Market Trend Evolution
- Spain Interactive Tables Market Drivers and Challenges
- Spain Interactive Tables Price Trends
- Spain Interactive Tables Porter's Five Forces
- Spain Interactive Tables Industry Life Cycle
- Historical Data and Forecast of Spain Interactive Tables Market Revenues & Volume By Technology for the Period 2022-2032F
- Historical Data and Forecast of Spain Interactive Tables Market Revenues & Volume By LCD for the Period 2022-2032F
- Historical Data and Forecast of Spain Interactive Tables Market Revenues & Volume By LED for the Period 2022-2032F
- Historical Data and Forecast of Spain Interactive Tables Market Revenues & Volume By Capacitive for the Period 2022-2032F
- Historical Data and Forecast of Spain Interactive Tables Market Revenues & Volume By Others for the Period 2022-2032F
- Historical Data and Forecast of Spain Interactive Tables Market Revenues & Volume By Screen Size for the Period 2022-2032F
- Historical Data and Forecast of Spain Interactive Tables Market Revenues & Volume By 32-65 Inch for the Period 2022-2032F
- Historical Data and Forecast of Spain Interactive Tables Market Revenues & Volume By 65 Inch & Above for the Period 2022-2032F
- Historical Data and Forecast of Spain Interactive Tables Market Revenues & Volume By Application for the Period 2022-2032F
- Historical Data and Forecast of Spain Interactive Tables Market Revenues & Volume By Exhibition & Trade Shows for the Period 2022-2032F
- Historical Data and Forecast of Spain Interactive Tables Market Revenues & Volume By Education for the Period 2022-2032F
- Historical Data and Forecast of Spain Interactive Tables Market Revenues & Volume By Retail for the Period 2022-2032F
- Historical Data and Forecast of Spain Interactive Tables Market Revenues & Volume By Control Room for the Period 2022-2032F
- Historical Data and Forecast of Spain Interactive Tables Market Revenues & Volume By Hospitality for the Period 2022-2032F
- Historical Data and Forecast of Spain Interactive Tables Market Revenues & Volume By Transportation for the Period 2022-2032F
- Historical Data and Forecast of Spain Interactive Tables Market Revenues & Volume By Others for the Period 2022-2032F
- Spain Interactive Tables Import Export Trade Statistics
- Market Opportunity Assessment By Technology
- Market Opportunity Assessment By Screen Size
- Market Opportunity Assessment By Application
- Spain Interactive Tables Top Companies Market Share
- Spain Interactive Tables Competitive Benchmarking By Technical and Operational Parameters
- Spain Interactive Tables Company Profiles
- Spain Interactive Tables Key Strategic Recommendations
Frequently Asked Questions About the Market Study (FAQs):
The Spain Interactive Tables Market was estimated at USD 203 Million in 2025 and is projected to reach USD 239 Million by 2032, growing at a CAGR of 2.4% from 2026 to 2032.
The primary drivers are the educational and corporate sectors, where there is a growing need for collaborative environments that enhance learning and teamwork.
Significant advancements in touchscreen technology and user interface design are enabling manufacturers to create more sophisticated and user-friendly interactive tables.
Government policies in Spain promote the use of interactive technologies in education, encouraging institutions to invest in collaborative solutions that enhance student engagement.
Companies must navigate high production costs and the need for continuous innovation to keep pace with evolving technology and user expectations.
New entrants can capitalize on the rising demand for tailored interactive solutions and focus on sectors that prioritize innovative collaboration tools, especially in education and corporate environments.
6Wresearch actively monitors the Spain Interactive Tables Market and publishes its comprehensive annual report, highlighting emerging trends, growth drivers, revenue analysis, and forecast outlook. Our insights help businesses to make data-backed strategic decisions with ongoing market dynamics. Our analysts track relevent industries related to the Spain Interactive Tables Market, allowing our clients with actionable intelligence and reliable forecasts tailored to emerging regional needs.
Yes, we provide customisation as per your requirements. To learn more, feel free to contact us on sales@6wresearch.com
1 Executive Summary |
2 Introduction |
2.1 Key Highlights of the Report |
2.2 Report Description |
2.3 Market Scope & Segmentation |
2.4 Research Methodology |
2.5 Assumptions |
3 Spain Interactive Tables Market Overview |
3.1 Spain Country Macro Economic Indicators |
3.2 Spain Interactive Tables Market Revenues & Volume, 2022 & 2032F |
3.3 Spain Interactive Tables Market - Industry Life Cycle |
3.4 Spain Interactive Tables Market - Porter's Five Forces |
3.5 Spain Interactive Tables Market Revenues & Volume Share, By Technology, 2022 & 2032F |
3.6 Spain Interactive Tables Market Revenues & Volume Share, By Screen Size, 2022 & 2032F |
3.7 Spain Interactive Tables Market Revenues & Volume Share, By Application, 2022 & 2032F |
4 Spain Interactive Tables Market Dynamics |
4.1 Impact Analysis |
4.2 Market Drivers |
4.2.1 Increasing adoption of digital technology in education and corporate sectors |
4.2.2 Growing demand for interactive and engaging customer experiences in retail and hospitality industries |
4.2.3 Technological advancements and innovations in interactive table solutions |
4.3 Market Restraints |
4.3.1 High initial investment and maintenance costs associated with interactive tables |
4.3.2 Limited awareness and understanding of the benefits of interactive tables among some potential end-users |
4.3.3 Data security and privacy concerns related to interactive table usage |
5 Spain Interactive Tables Market Trends |
6 Spain Interactive Tables Market, By Types |
6.1 Spain Interactive Tables Market, By Technology |
6.1.1 Overview and Analysis |
6.1.2 Spain Interactive Tables Market Revenues & Volume, By Technology, 2022-2032F |
6.1.3 Spain Interactive Tables Market Revenues & Volume, By LCD, 2022-2032F |
6.1.4 Spain Interactive Tables Market Revenues & Volume, By LED, 2022-2032F |
6.1.5 Spain Interactive Tables Market Revenues & Volume, By Capacitive, 2022-2032F |
6.1.6 Spain Interactive Tables Market Revenues & Volume, By Others, 2022-2032F |
6.2 Spain Interactive Tables Market, By Screen Size |
6.2.1 Overview and Analysis |
6.2.2 Spain Interactive Tables Market Revenues & Volume, By 32-65 Inch, 2022-2032F |
6.2.3 Spain Interactive Tables Market Revenues & Volume, By 65 Inch & Above, 2022-2032F |
6.3 Spain Interactive Tables Market, By Application |
6.3.1 Overview and Analysis |
6.3.2 Spain Interactive Tables Market Revenues & Volume, By Exhibition & Trade Shows, 2022-2032F |
6.3.3 Spain Interactive Tables Market Revenues & Volume, By Education, 2022-2032F |
6.3.4 Spain Interactive Tables Market Revenues & Volume, By Retail, 2022-2032F |
6.3.5 Spain Interactive Tables Market Revenues & Volume, By Control Room, 2022-2032F |
6.3.6 Spain Interactive Tables Market Revenues & Volume, By Hospitality, 2022-2032F |
6.3.7 Spain Interactive Tables Market Revenues & Volume, By Transportation, 2022-2032F |
7 Spain Interactive Tables Market Import-Export Trade Statistics |
7.1 Spain Interactive Tables Market Export to Major Countries |
7.2 Spain Interactive Tables Market Imports from Major Countries |
8 Spain Interactive Tables Market Key Performance Indicators |
8.1 Average session duration on interactive tables |
8.2 Rate of return customers in establishments using interactive tables |
8.3 Number of interactive table installations in education and corporate sectors |
9 Spain Interactive Tables Market - Opportunity Assessment |
9.1 Spain Interactive Tables Market Opportunity Assessment, By Technology, 2022 & 2032F |
9.2 Spain Interactive Tables Market Opportunity Assessment, By Screen Size, 2022 & 2032F |
9.3 Spain Interactive Tables Market Opportunity Assessment, By Application, 2022 & 2032F |
10 Spain Interactive Tables Market - Competitive Landscape |
10.1 Spain Interactive Tables Market Revenue Share, By Companies, 2025 |
10.2 Spain Interactive Tables Market Competitive Benchmarking, By Operating and Technical Parameters |
11 Company Profiles |
12 Recommendations |
13 Disclaimer |
Global Go To Market Strategy - 2030
Export potential enables firms to identify high-growth global markets with greater confidence by combining advanced trade intelligence with a structured quantitative methodology. The framework analyzes emerging demand trends and country-level import patterns while integrating macroeconomic and trade datasets such as GDP and population forecasts, bilateral import–export flows, tariff structures, elasticity differentials between developed and developing economies, geographic distance, and import demand projections. Using weighted trade values from 2020–2024 as the base period to project country-to-country export potential for 2030, these inputs are operationalized through calculated drivers such as gravity model parameters, tariff impact factors, and projected GDP per-capita growth. Through an analysis of hidden potentials, demand hotspots, and market conditions that are most favorable to success, this method enables firms to focus on target countries, maximize returns, and global expansion with data, backed by accuracy.
By factoring in the projected importer demand gap that is currently unmet and could be potential opportunity, it identifies the potential for the Exporter (Country) among 190 countries, against the general trade analysis, which identifies the biggest importer or exporter.
To discover high-growth global markets and optimize your business strategy:
Click Here
Pricing
- Single User License$ 1,995
- Department License$ 2,400
- Site License$ 3,120
- Global License$ 3,795

Leadership Perspectives from Industry Events
Search
Thought Leadership and Analyst Meet


Our Clients
6WResearch In News
- India Export Attractiveness Tracker 2026
- India Air Conditioner Market Set for Strong Rebound in 2026 After Weather-Led Correction and GST-Driven Recovery: 6Wresearch
- ADAS in India: How Automatic Emergency Braking, Blind Spot Detection & Driver Monitoring are Transforming Road Safety
- Doha a strategic location for EV manufacturing hub: IPA Qatar
- Demand for luxury TVs surging in the GCC, says Samsung
- Empowering Growth: The Thriving Journey of Bangladesh’s Cable Industry
Latest Reports
- Nicaragua RPG Gaming Market (2026-2032)
- New Zealand RPG Gaming Market (2026-2032)
- Netherlands RPG Gaming Market (2026-2032)
- Nauru RPG Gaming Market (2026-2032)
- Namibia RPG Gaming Market (2026-2032)
- Mozambique RPG Gaming Market (2026-2032)
- Montenegro RPG Gaming Market (2026-2032)
- Mongolia RPG Gaming Market (2026-2032)
- Monaco RPG Gaming Market (2026-2032)
- Micronesia RPG Gaming Market (2026-2032)
Industry Events and Analyst Meet

EV India Expo 2026

HIMTEX 2026

India Refining Summit 2026

India EV Show 2026

EV tech India Expo 2026
Whitepaper
- Middle East & Africa Commercial Security Market Click here to view more.
- Middle East & Africa Fire Safety Systems & Equipment Market Click here to view more.
- GCC Drone Market Click here to view more.
- Middle East Lighting Fixture Market Click here to view more.
- GCC Physical & Perimeter Security Market Click here to view more.