Spain Precipitated Silica Market (2026-2032) Outlook | Trends, Companies, Growth, Forecast, Size, Industry, Analysis, Value, Revenue & Share
Market Forecast By End Use Industry (Automobiles, Cosmetics, Electronics, Agriculture), By Application (Rubber, Personal Care, Food, Battery Separator, Coating & Inks, Adhesives & Sealants) And Competitive Landscape
| Product Code: ETC4482255 | Publication Date: Jul 2023 | Updated Date: Mar 2026 | Product Type: Report | |
| Publisher: 6Wresearch | Author: Dhaval Chaurasia | No. of Pages: 85 | No. of Figures: 45 | No. of Tables: 25 |
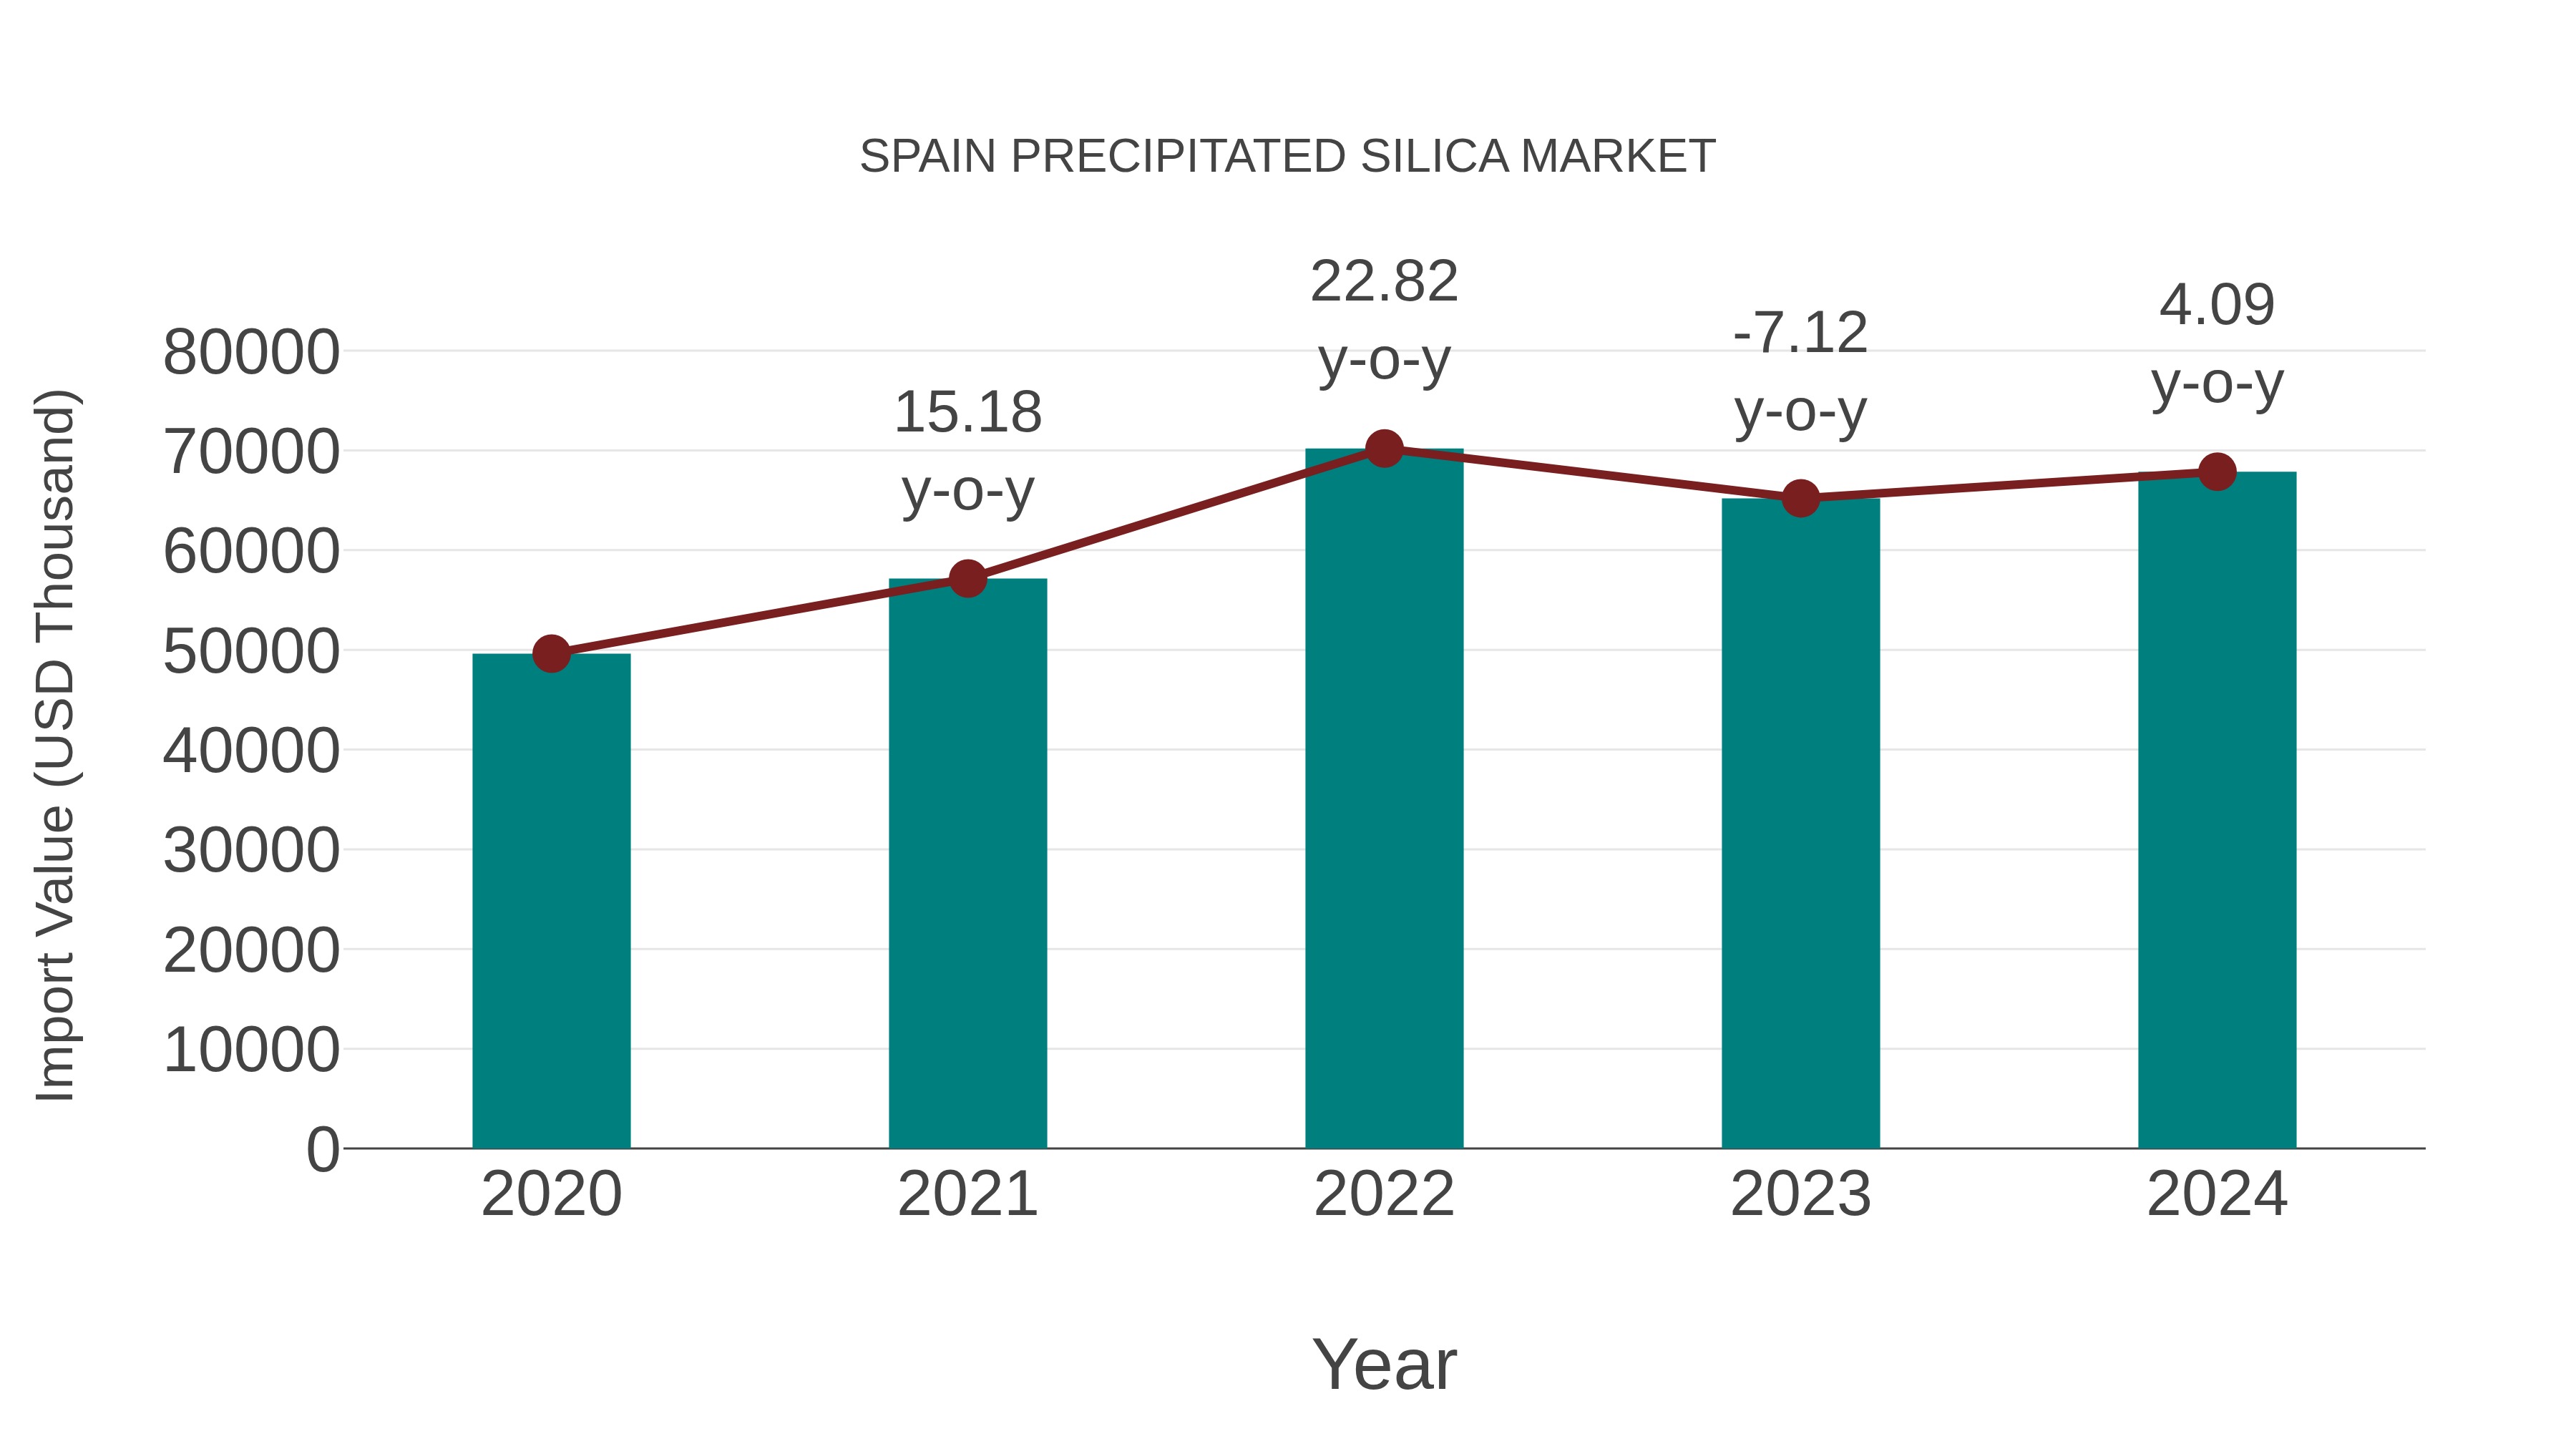
Spain Precipitated Silica Market: Import Trend Analysis
In 2024, Spain`s import of precipitated silica for the Spanish market experienced a steady upward trend. This growth was driven by increased demand from various industries such as rubber, plastics, and personal care, highlighting the country`s reliance on imported precipitated silica for manufacturing purposes.
Spain Precipitated Silica Market Overview
The precipitated silica market in Spain is expanding as industries seek materials that enhance performance in rubber, coatings, and personal care products. Precipitated silica provides properties like improved reinforcement and durability, driving its demand in various applications.
Drivers of the market
The Spain Precipitated Silica Market is driven by the rising demand for silica in rubber, coatings, and personal care products. Precipitated silica enhances the performance and durability of various applications, making it a preferred choice among manufacturers. The growing emphasis on sustainable products and the push for environmentally friendly formulations further stimulate demand in this market.
Challenges of the market
The precipitated silica market is expanding in rubber and cosmetics. Challenges include regulatory compliance and competition from alternative materials.
Government Policy of the market
Government regulations promoting safety and environmental protection influence the precipitated silica market. Policies encouraging the use of eco-friendly products drive demand for precipitated silica in applications such as rubber and coatings.
Key Highlights of the Report:
- Spain Precipitated Silica Market Outlook
- Market Size of Spain Precipitated Silica Market, 2025
- Forecast of Spain Precipitated Silica Market, 2032
- Historical Data and Forecast of Spain Precipitated Silica Revenues & Volume for the Period 2022-2032F
- Spain Precipitated Silica Market Trend Evolution
- Spain Precipitated Silica Market Drivers and Challenges
- Spain Precipitated Silica Price Trends
- Spain Precipitated Silica Porter's Five Forces
- Spain Precipitated Silica Industry Life Cycle
- Historical Data and Forecast of Spain Precipitated Silica Market Revenues & Volume By End Use Industry for the Period 2022-2032F
- Historical Data and Forecast of Spain Precipitated Silica Market Revenues & Volume By Automobiles for the Period 2022-2032F
- Historical Data and Forecast of Spain Precipitated Silica Market Revenues & Volume By Cosmetics for the Period 2022-2032F
- Historical Data and Forecast of Spain Precipitated Silica Market Revenues & Volume By Electronics for the Period 2022-2032F
- Historical Data and Forecast of Spain Precipitated Silica Market Revenues & Volume By Agriculture for the Period 2022-2032F
- Historical Data and Forecast of Spain Precipitated Silica Market Revenues & Volume By Application for the Period 2022-2032F
- Historical Data and Forecast of Spain Precipitated Silica Market Revenues & Volume By Rubber for the Period 2022-2032F
- Historical Data and Forecast of Spain Precipitated Silica Market Revenues & Volume By Personal Care for the Period 2022-2032F
- Historical Data and Forecast of Spain Precipitated Silica Market Revenues & Volume By Food for the Period 2022-2032F
- Historical Data and Forecast of Spain Precipitated Silica Market Revenues & Volume By Battery Separator for the Period 2022-2032F
- Historical Data and Forecast of Spain Precipitated Silica Market Revenues & Volume By Coating & Inks for the Period 2022-2032F
- Historical Data and Forecast of Spain Precipitated Silica Market Revenues & Volume By Adhesives & Sealants for the Period 2022-2032F
- Spain Precipitated Silica Import Export Trade Statistics
- Market Opportunity Assessment By End Use Industry
- Market Opportunity Assessment By Application
- Spain Precipitated Silica Top Companies Market Share
- Spain Precipitated Silica Competitive Benchmarking By Technical and Operational Parameters
- Spain Precipitated Silica Company Profiles
- Spain Precipitated Silica Key Strategic Recommendations
Spain Precipitated Silica Market (2026-2032): FAQs
6Wresearch actively monitors the Spain Precipitated Silica Market and publishes its comprehensive annual report, highlighting emerging trends, growth drivers, revenue analysis, and forecast outlook. Our insights help businesses to make data-backed strategic decisions with ongoing market dynamics. Our analysts track relevent industries related to the Spain Precipitated Silica Market, allowing our clients with actionable intelligence and reliable forecasts tailored to emerging regional needs.
Yes, we provide customisation as per your requirements. To learn more, feel free to contact us on sales@6wresearch.com
1 Executive Summary |
2 Introduction |
2.1 Key Highlights of the Report |
2.2 Report Description |
2.3 Market Scope & Segmentation |
2.4 Research Methodology |
2.5 Assumptions |
3 Spain Precipitated Silica Market Overview |
3.1 Spain Country Macro Economic Indicators |
3.2 Spain Precipitated Silica Market Revenues & Volume, 2022 & 2032F |
3.3 Spain Precipitated Silica Market - Industry Life Cycle |
3.4 Spain Precipitated Silica Market - Porter's Five Forces |
3.5 Spain Precipitated Silica Market Revenues & Volume Share, By End Use Industry, 2022 & 2032F |
3.6 Spain Precipitated Silica Market Revenues & Volume Share, By Application, 2022 & 2032F |
4 Spain Precipitated Silica Market Dynamics |
4.1 Impact Analysis |
4.2 Market Drivers |
4.2.1 Increasing demand for eco-friendly and sustainable products in various industries such as rubber, plastics, and personal care. |
4.2.2 Growing awareness about the benefits of using precipitated silica in enhancing product performance and reducing manufacturing costs. |
4.2.3 Favorable government regulations promoting the use of precipitated silica in different applications. |
4.3 Market Restraints |
4.3.1 Fluctuating raw material prices impacting the production cost of precipitated silica. |
4.3.2 Intense competition from substitute products like fumed silica and silica gel. |
4.3.3 Challenges in maintaining product quality and consistency due to variations in manufacturing processes. |
5 Spain Precipitated Silica Market Trends |
6 Spain Precipitated Silica Market, By Types |
6.1 Spain Precipitated Silica Market, By End Use Industry |
6.1.1 Overview and Analysis |
6.1.2 Spain Precipitated Silica Market Revenues & Volume, By End Use Industry, 2022-2032F |
6.1.3 Spain Precipitated Silica Market Revenues & Volume, By Automobiles, 2022-2032F |
6.1.4 Spain Precipitated Silica Market Revenues & Volume, By Cosmetics, 2022-2032F |
6.1.5 Spain Precipitated Silica Market Revenues & Volume, By Electronics, 2022-2032F |
6.1.6 Spain Precipitated Silica Market Revenues & Volume, By Agriculture, 2022-2032F |
6.2 Spain Precipitated Silica Market, By Application |
6.2.1 Overview and Analysis |
6.2.2 Spain Precipitated Silica Market Revenues & Volume, By Rubber, 2022-2032F |
6.2.3 Spain Precipitated Silica Market Revenues & Volume, By Personal Care, 2022-2032F |
6.2.4 Spain Precipitated Silica Market Revenues & Volume, By Food, 2022-2032F |
6.2.5 Spain Precipitated Silica Market Revenues & Volume, By Battery Separator, 2022-2032F |
6.2.6 Spain Precipitated Silica Market Revenues & Volume, By Coating & Inks, 2022-2032F |
6.2.7 Spain Precipitated Silica Market Revenues & Volume, By Adhesives & Sealants, 2022-2032F |
7 Spain Precipitated Silica Market Import-Export Trade Statistics |
7.1 Spain Precipitated Silica Market Export to Major Countries |
7.2 Spain Precipitated Silica Market Imports from Major Countries |
8 Spain Precipitated Silica Market Key Performance Indicators |
8.1 Research and development investment in new applications and product innovations. |
8.2 Percentage of revenue derived from new markets or industries. |
8.3 Environmental sustainability metrics related to production processes and waste management. |
8.4 Customer satisfaction scores and feedback on product performance and quality. |
8.5 Number of partnerships or collaborations with key industry players for market expansion. |
9 Spain Precipitated Silica Market - Opportunity Assessment |
9.1 Spain Precipitated Silica Market Opportunity Assessment, By End Use Industry, 2022 & 2032F |
9.2 Spain Precipitated Silica Market Opportunity Assessment, By Application, 2022 & 2032F |
10 Spain Precipitated Silica Market - Competitive Landscape |
10.1 Spain Precipitated Silica Market Revenue Share, By Companies, 2025 |
10.2 Spain Precipitated Silica Market Competitive Benchmarking, By Operating and Technical Parameters |
11 Company Profiles |
12 Recommendations |
13 Disclaimer |
Global Go To Market Strategy - 2030
Export potential enables firms to identify high-growth global markets with greater confidence by combining advanced trade intelligence with a structured quantitative methodology. The framework analyzes emerging demand trends and country-level import patterns while integrating macroeconomic and trade datasets such as GDP and population forecasts, bilateral import–export flows, tariff structures, elasticity differentials between developed and developing economies, geographic distance, and import demand projections. Using weighted trade values from 2020–2024 as the base period to project country-to-country export potential for 2030, these inputs are operationalized through calculated drivers such as gravity model parameters, tariff impact factors, and projected GDP per-capita growth. Through an analysis of hidden potentials, demand hotspots, and market conditions that are most favorable to success, this method enables firms to focus on target countries, maximize returns, and global expansion with data, backed by accuracy.
By factoring in the projected importer demand gap that is currently unmet and could be potential opportunity, it identifies the potential for the Exporter (Country) among 190 countries, against the general trade analysis, which identifies the biggest importer or exporter.
To discover high-growth global markets and optimize your business strategy:
Click Here
Pricing
- Single User License$ 1,995
- Department License$ 2,400
- Site License$ 3,120
- Global License$ 3,795

Leadership Perspectives from Industry Events
Search
Thought Leadership and Analyst Meet


Our Clients
6WResearch In News
- Doha a strategic location for EV manufacturing hub: IPA Qatar
- Demand for luxury TVs surging in the GCC, says Samsung
- Empowering Growth: The Thriving Journey of Bangladesh’s Cable Industry
- Demand for luxury TVs surging in the GCC, says Samsung
- Video call with a traditional healer? Once unthinkable, it’s now common in South Africa
- Intelligent Buildings To Smooth GCC’s Path To Net Zero
Latest Reports
- Poland Fire Protection Systems Market (2026-2032)
- Cape Verde Portable Hand-Thrown Extinguisher Market (2026-2032)
- Canada Portable Hand-Thrown Extinguisher Market (2026-2032)
- Cameroon Portable Hand-Thrown Extinguisher Market (2026-2032)
- Burundi Portable Hand-Thrown Extinguisher Market (2026-2032)
- Burkina Faso Portable Hand-Thrown Extinguisher Market (2026-2032)
- Bulgaria Portable Hand-Thrown Extinguisher Market (2026-2032)
- Brunei Portable Hand-Thrown Extinguisher Market (2026-2032)
- Botswana Portable Hand-Thrown Extinguisher Market (2026-2032)
- Bosnia and Herzegovina Portable Hand-Thrown Extinguisher Market (2026-2032)
Industry Events and Analyst Meet

HIMTEX 2026

India Refining Summit 2026

India EV Show 2026

EV tech India Expo 2026

Auto Tech Asia 2026
Whitepaper
- Middle East & Africa Commercial Security Market Click here to view more.
- Middle East & Africa Fire Safety Systems & Equipment Market Click here to view more.
- GCC Drone Market Click here to view more.
- Middle East Lighting Fixture Market Click here to view more.
- GCC Physical & Perimeter Security Market Click here to view more.