Sri Lanka Clay Market Outlook | Analysis, Companies, Size, Forecast, COVID-19 IMPACT, Industry, Growth, Revenue, Trends, Share & Value
Market Forecast By Application (Tableware, Sanitary ware, Medical applications), By End Use (Ceramic and, Non-ceramic) And Competitive Landscape
| Product Code: ETC318991 | Publication Date: Aug 2022 | Updated Date: Feb 2026 | Product Type: Market Research Report | |
| Publisher: 6Wresearch | Author: Ravi Bhandari | No. of Pages: 75 | No. of Figures: 35 | No. of Tables: 20 |
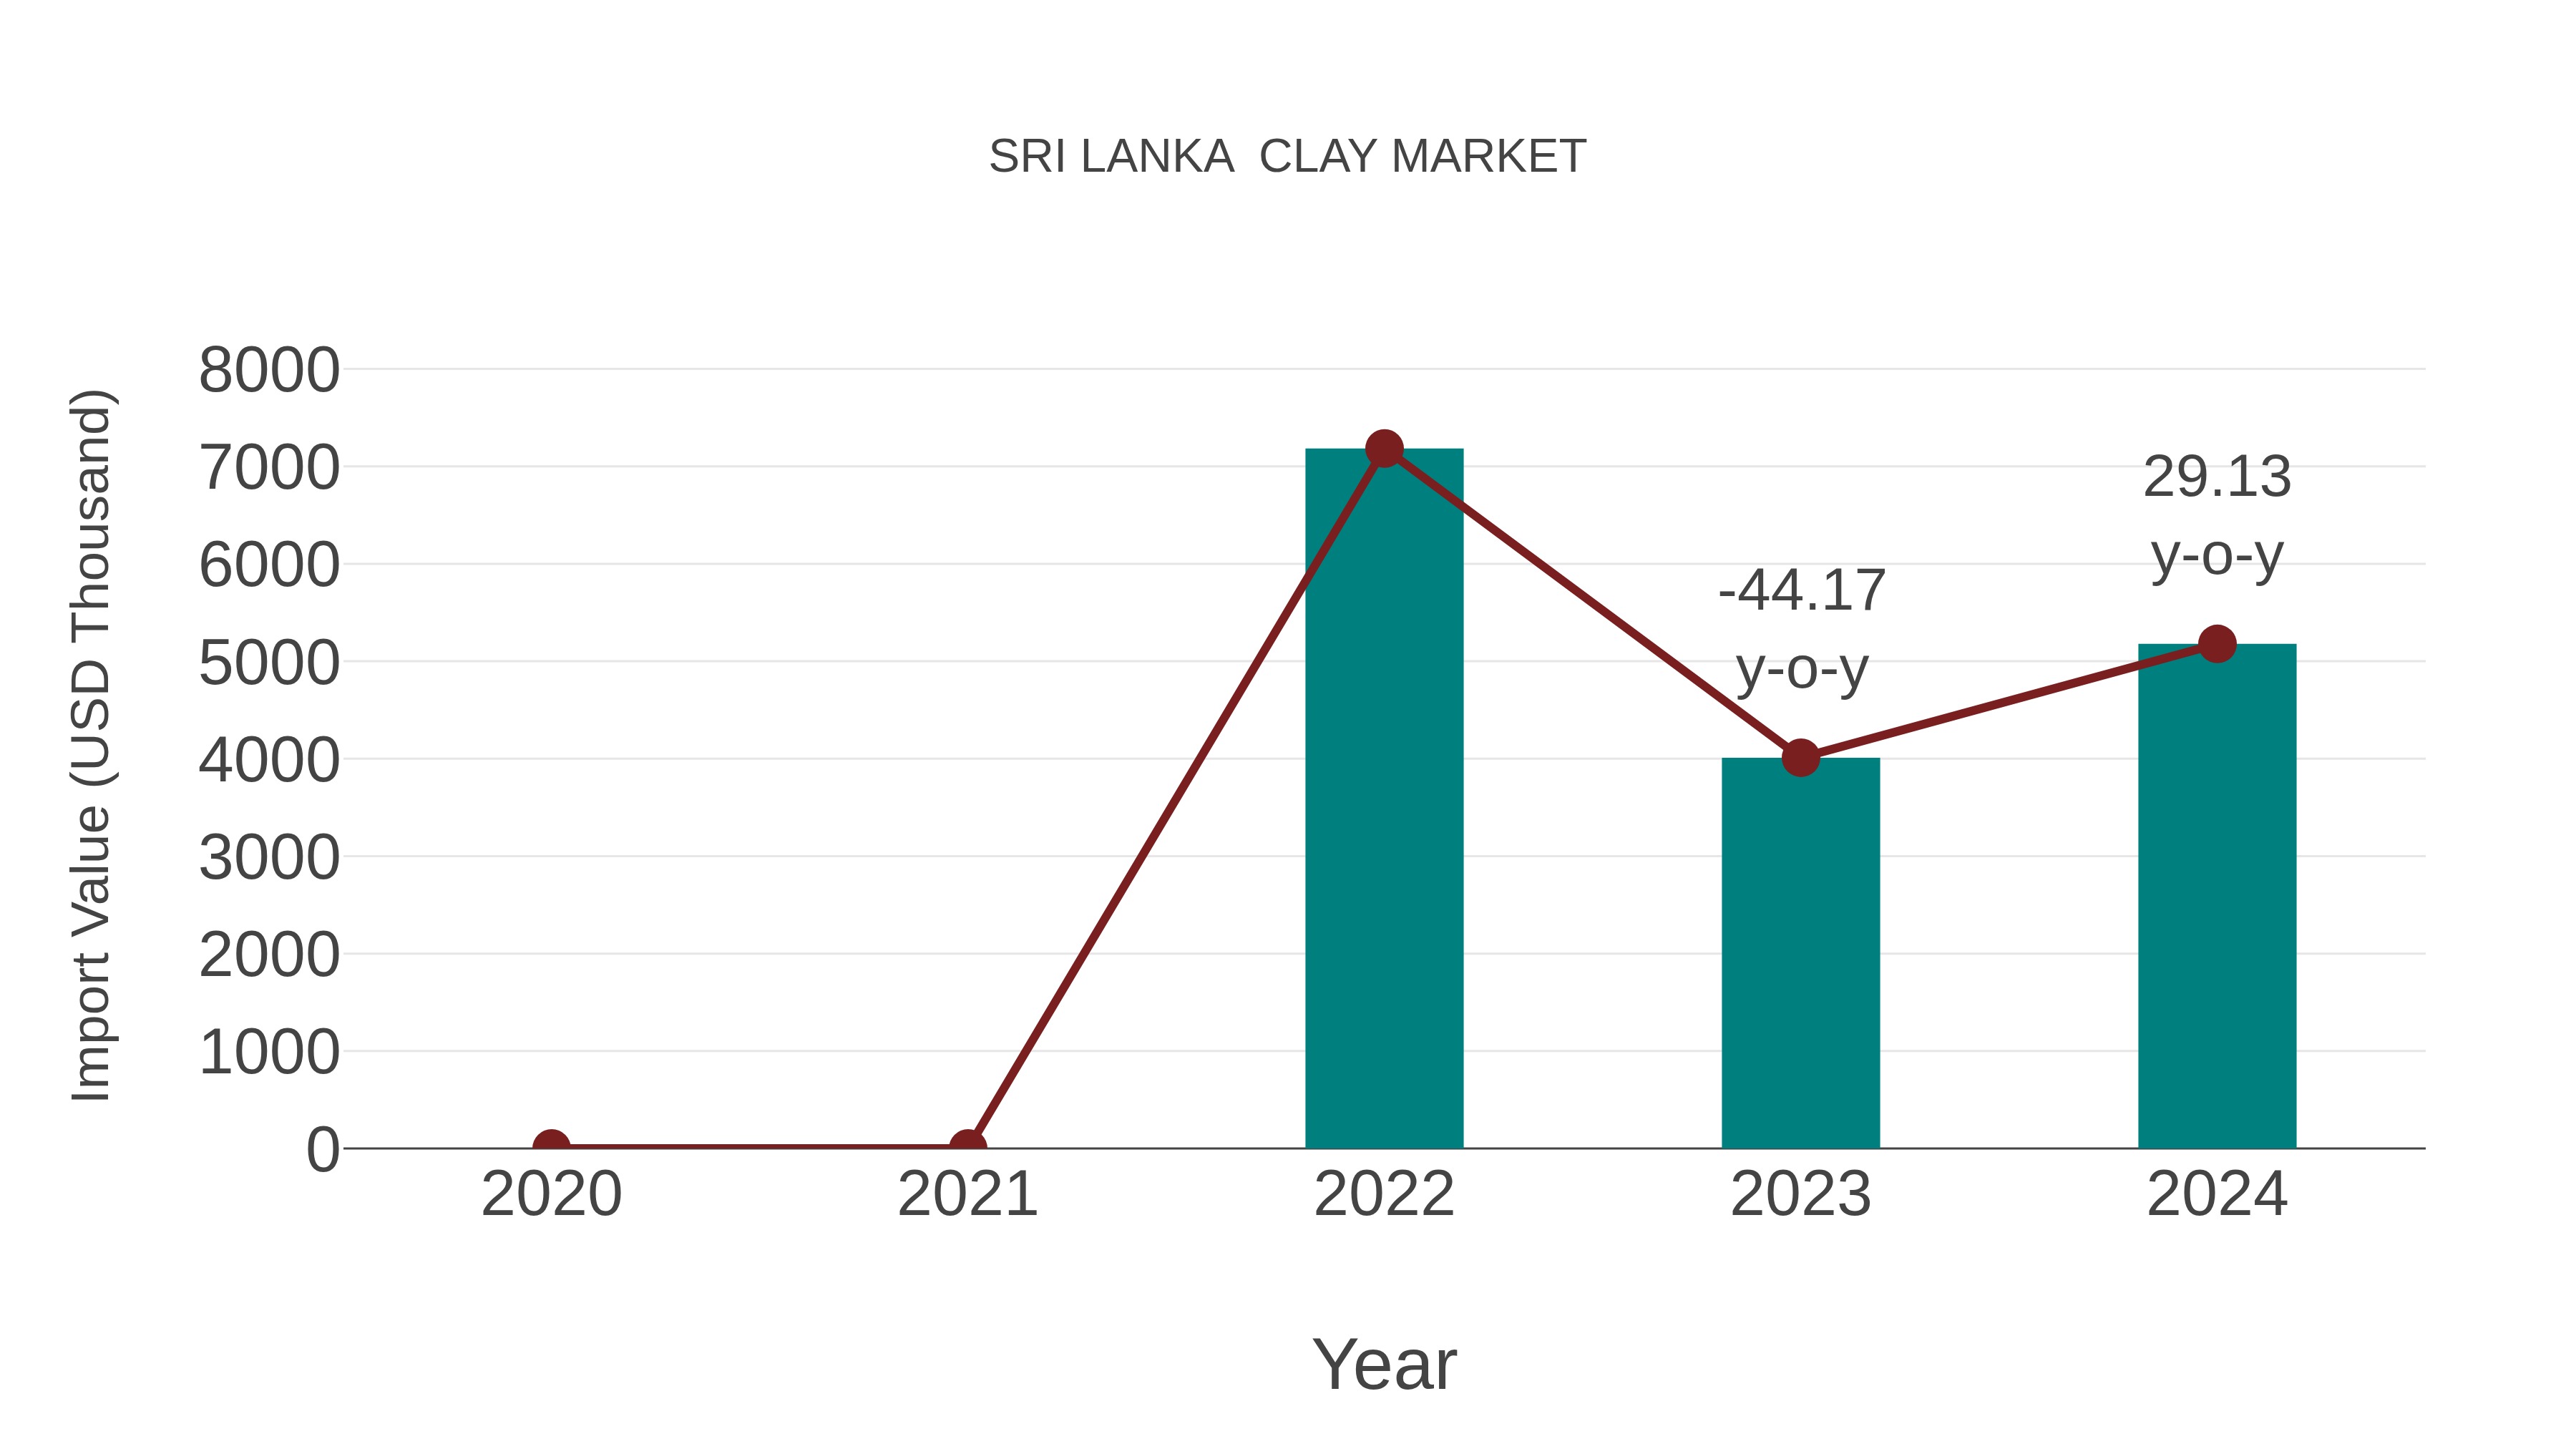
Sri Lanka Clay Market: Import Trend Analysis
Sri Lanka import trend for the clay market showed a growth rate of 29.13% from 2023 to 2024, with a compound annual growth rate (CAGR) of -15.1% from 2020 to 2024. This fluctuation could be attributed to shifts in demand dynamics or changes in trade policies affecting the market.
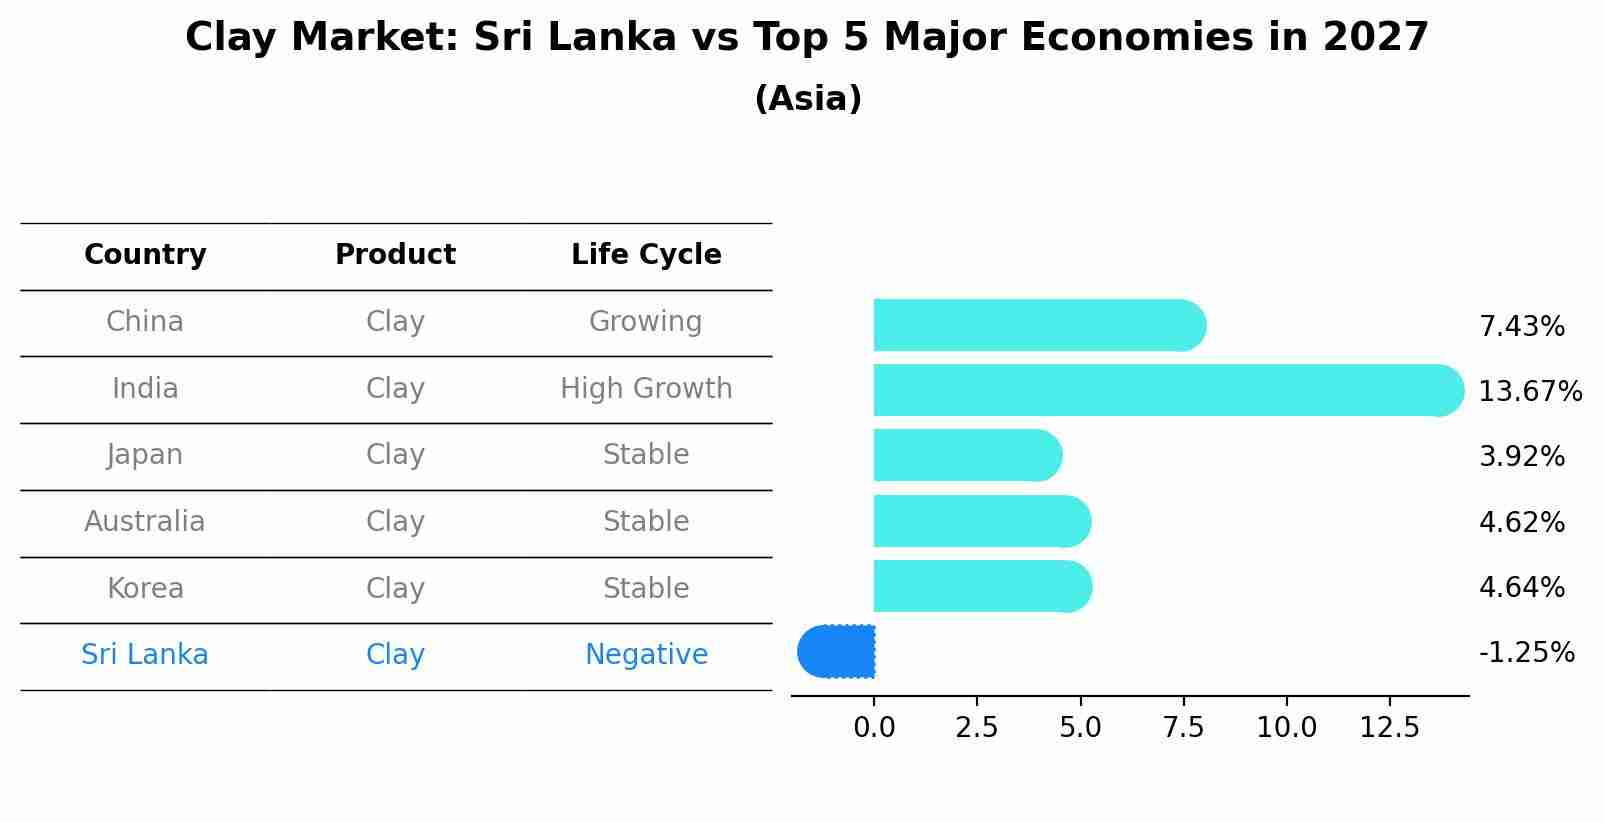
Clay Market: Sri Lanka vs Top 5 Major Economies in 2027 (Asia)
By 2027, Sri Lanka's Clay market is forecasted to achieve a negative growth rate of -1.25%, with China leading the Asia region, followed by India, Japan, Australia and South Korea.
Sri Lanka Clay Market Overview
Clay holds significant importance in various industries in Sri Lanka, including construction, ceramics, and pharmaceuticals. The Sri Lankan clay market encompasses both natural clay deposits and processed clay products. The availability and quality of clay influence its use in pottery, brick-making, and as a raw material for manufacturing refractories. The market dynamics are shaped by factors such as mining regulations, environmental considerations, and demand from construction and industrial sectors.
Drivers of the market
The Sri Lankan clay market is driven by its extensive applications in construction, ceramics, and the pharmaceutical industry. Drivers include the growing construction sector, urbanization trends, and infrastructure development projects across the country. Additionally, the market benefits from the availability of diverse clay types suitable for different industrial uses, coupled with increasing investments in clay mining and processing technologies.
Challenges of the market
In Sri Lanka, the clay market struggles with issues such as environmental regulations concerning mining practices, variability in clay quality and availability, and competition from alternative materials. Additionally, logistical challenges in transportation and infrastructure deficiencies impact the industry`s operational efficiency.
Government Policy of the market
Policies governing mining permits, environmental impact assessments, and export regulations are critical for the clay market. The government`s policies on land use, mineral extraction, and taxation can significantly influence production costs and market competitiveness.
Key Highlights of the Report:
- Sri Lanka Clay Market Outlook
- Market Size of Sri Lanka Clay Market, 2021
- Forecast of Sri Lanka Clay Market, 2028
- Historical Data and Forecast of Sri Lanka Clay Revenues & Volume for the Period 2018 - 2028
- Sri Lanka Clay Market Trend Evolution
- Sri Lanka Clay Market Drivers and Challenges
- Sri Lanka Clay Price Trends
- Sri Lanka Clay Porter's Five Forces
- Sri Lanka Clay Industry Life Cycle
- Historical Data and Forecast of Sri Lanka Clay Market Revenues & Volume By Application for the Period 2018 - 2028
- Historical Data and Forecast of Sri Lanka Clay Market Revenues & Volume By Tableware for the Period 2018 - 2028
- Historical Data and Forecast of Sri Lanka Clay Market Revenues & Volume By Sanitary ware for the Period 2018 - 2028
- Historical Data and Forecast of Sri Lanka Clay Market Revenues & Volume By Medical applications for the Period 2018 - 2028
- Historical Data and Forecast of Sri Lanka Clay Market Revenues & Volume By End Use for the Period 2018 - 2028
- Historical Data and Forecast of Sri Lanka Clay Market Revenues & Volume By Ceramic and for the Period 2018 - 2028
- Historical Data and Forecast of Sri Lanka Clay Market Revenues & Volume By Non-ceramic for the Period 2018 - 2028
- Sri Lanka Clay Import Export Trade Statistics
- Market Opportunity Assessment By Application
- Market Opportunity Assessment By End Use
- Sri Lanka Clay Top Companies Market Share
- Sri Lanka Clay Competitive Benchmarking By Technical and Operational Parameters
- Sri Lanka Clay Company Profiles
- Sri Lanka Clay Key Strategic Recommendations
Frequently Asked Questions About the Market Study (FAQs):
6Wresearch actively monitors the Sri Lanka Clay Market and publishes its comprehensive annual report, highlighting emerging trends, growth drivers, revenue analysis, and forecast outlook. Our insights help businesses to make data-backed strategic decisions with ongoing market dynamics. Our analysts track relevent industries related to the Sri Lanka Clay Market, allowing our clients with actionable intelligence and reliable forecasts tailored to emerging regional needs.
Yes, we provide customisation as per your requirements. To learn more, feel free to contact us on sales@6wresearch.com
1 Executive Summary |
2 Introduction |
2.1 Key Highlights of the Report |
2.2 Report Description |
2.3 Market Scope & Segmentation |
2.4 Research Methodology |
2.5 Assumptions |
3 Sri Lanka Clay Market Overview |
3.1 Sri Lanka Country Macro Economic Indicators |
3.2 Sri Lanka Clay Market Revenues & Volume, 2021 & 2028F |
3.3 Sri Lanka Clay Market - Industry Life Cycle |
3.4 Sri Lanka Clay Market - Porter's Five Forces |
3.5 Sri Lanka Clay Market Revenues & Volume Share, By Application, 2021 & 2028F |
3.6 Sri Lanka Clay Market Revenues & Volume Share, By End Use, 2021 & 2028F |
4 Sri Lanka Clay Market Dynamics |
4.1 Impact Analysis |
4.2 Market Drivers |
4.2.1 Growing demand for eco-friendly and sustainable construction materials |
4.2.2 Increasing investments in infrastructure development projects in Sri Lanka |
4.2.3 Rising awareness about the benefits of using clay products in construction |
4.3 Market Restraints |
4.3.1 Fluctuating raw material prices impacting production costs |
4.3.2 Competition from alternative construction materials like concrete and steel |
4.3.3 Regulatory challenges related to environmental standards and permits |
5 Sri Lanka Clay Market Trends |
6 Sri Lanka Clay Market, By Types |
6.1 Sri Lanka Clay Market, By Application |
6.1.1 Overview and Analysis |
6.1.2 Sri Lanka Clay Market Revenues & Volume, By Application, 2018 - 2028F |
6.1.3 Sri Lanka Clay Market Revenues & Volume, By Tableware, 2018 - 2028F |
6.1.4 Sri Lanka Clay Market Revenues & Volume, By Sanitary ware, 2018 - 2028F |
6.1.5 Sri Lanka Clay Market Revenues & Volume, By Medical applications, 2018 - 2028F |
6.2 Sri Lanka Clay Market, By End Use |
6.2.1 Overview and Analysis |
6.2.2 Sri Lanka Clay Market Revenues & Volume, By Ceramic and, 2018 - 2028F |
6.2.3 Sri Lanka Clay Market Revenues & Volume, By Non-ceramic, 2018 - 2028F |
7 Sri Lanka Clay Market Import-Export Trade Statistics |
7.1 Sri Lanka Clay Market Export to Major Countries |
7.2 Sri Lanka Clay Market Imports from Major Countries |
8 Sri Lanka Clay Market Key Performance Indicators |
8.1 Percentage increase in the adoption of clay products in construction projects |
8.2 Number of new infrastructure projects utilizing clay materials |
8.3 Average production cost per unit of clay product |
8.4 Percentage of market share held by clay products compared to alternative materials |
8.5 Rate of compliance with environmental regulations and standards |
9 Sri Lanka Clay Market - Opportunity Assessment |
9.1 Sri Lanka Clay Market Opportunity Assessment, By Application, 2021 & 2028F |
9.2 Sri Lanka Clay Market Opportunity Assessment, By End Use, 2021 & 2028F |
10 Sri Lanka Clay Market - Competitive Landscape |
10.1 Sri Lanka Clay Market Revenue Share, By Companies, 2021 |
10.2 Sri Lanka Clay Market Competitive Benchmarking, By Operating and Technical Parameters |
11 Company Profiles |
12 Recommendations |
13 Disclaimer |
Global Go To Market Strategy - 2030
Export potential enables firms to identify high-growth global markets with greater confidence by combining advanced trade intelligence with a structured quantitative methodology. The framework analyzes emerging demand trends and country-level import patterns while integrating macroeconomic and trade datasets such as GDP and population forecasts, bilateral import–export flows, tariff structures, elasticity differentials between developed and developing economies, geographic distance, and import demand projections. Using weighted trade values from 2020–2024 as the base period to project country-to-country export potential for 2030, these inputs are operationalized through calculated drivers such as gravity model parameters, tariff impact factors, and projected GDP per-capita growth. Through an analysis of hidden potentials, demand hotspots, and market conditions that are most favorable to success, this method enables firms to focus on target countries, maximize returns, and global expansion with data, backed by accuracy.
By factoring in the projected importer demand gap that is currently unmet and could be potential opportunity, it identifies the potential for the Exporter (Country) among 190 countries, against the general trade analysis, which identifies the biggest importer or exporter.
To discover high-growth global markets and optimize your business strategy:
Click Here
Pricing
- Single User License$ 1,995
- Department License$ 2,400
- Site License$ 3,120
- Global License$ 3,795

Leadership Perspectives from Industry Events
Search
Thought Leadership and Analyst Meet


Our Clients
6WResearch In News
- India Air Conditioner Market Set for Strong Rebound in 2026 After Weather-Led Correction and GST-Driven Recovery: 6Wresearch
- ADAS in India: How Automatic Emergency Braking, Blind Spot Detection & Driver Monitoring are Transforming Road Safety
- Doha a strategic location for EV manufacturing hub: IPA Qatar
- Demand for luxury TVs surging in the GCC, says Samsung
- Empowering Growth: The Thriving Journey of Bangladesh’s Cable Industry
- Demand for luxury TVs surging in the GCC, says Samsung
Latest Reports
- Poland Fire Protection Systems Market (2026-2032)
- Cape Verde Portable Hand-Thrown Extinguisher Market (2026-2032)
- Canada Portable Hand-Thrown Extinguisher Market (2026-2032)
- Cameroon Portable Hand-Thrown Extinguisher Market (2026-2032)
- Burundi Portable Hand-Thrown Extinguisher Market (2026-2032)
- Burkina Faso Portable Hand-Thrown Extinguisher Market (2026-2032)
- Bulgaria Portable Hand-Thrown Extinguisher Market (2026-2032)
- Brunei Portable Hand-Thrown Extinguisher Market (2026-2032)
- Botswana Portable Hand-Thrown Extinguisher Market (2026-2032)
- Bosnia and Herzegovina Portable Hand-Thrown Extinguisher Market (2026-2032)
Industry Events and Analyst Meet

HIMTEX 2026

India Refining Summit 2026

India EV Show 2026

EV tech India Expo 2026

Auto Tech Asia 2026
Whitepaper
- Middle East & Africa Commercial Security Market Click here to view more.
- Middle East & Africa Fire Safety Systems & Equipment Market Click here to view more.
- GCC Drone Market Click here to view more.
- Middle East Lighting Fixture Market Click here to view more.
- GCC Physical & Perimeter Security Market Click here to view more.