Sri Lanka Mercury Market (2026-2032) Outlook | Companies, Size, Industry, Growth, Analysis, Value, Trends, Revenue, Forecast & Share
Market Forecast By Application (Chemical manufacturing, Artisanal gold mining, Batteries, Dentistry, Measurement And Control Devices, Electrical and lighting, Others) And Competitive Landscape
| Product Code: ETC194263 | Publication Date: May 2022 | Updated Date: Mar 2026 | Product Type: Market Research Report | |
| Publisher: 6Wresearch | Author: Ravi Bhandari | No. of Pages: 60 | No. of Figures: 40 | No. of Tables: 7 |
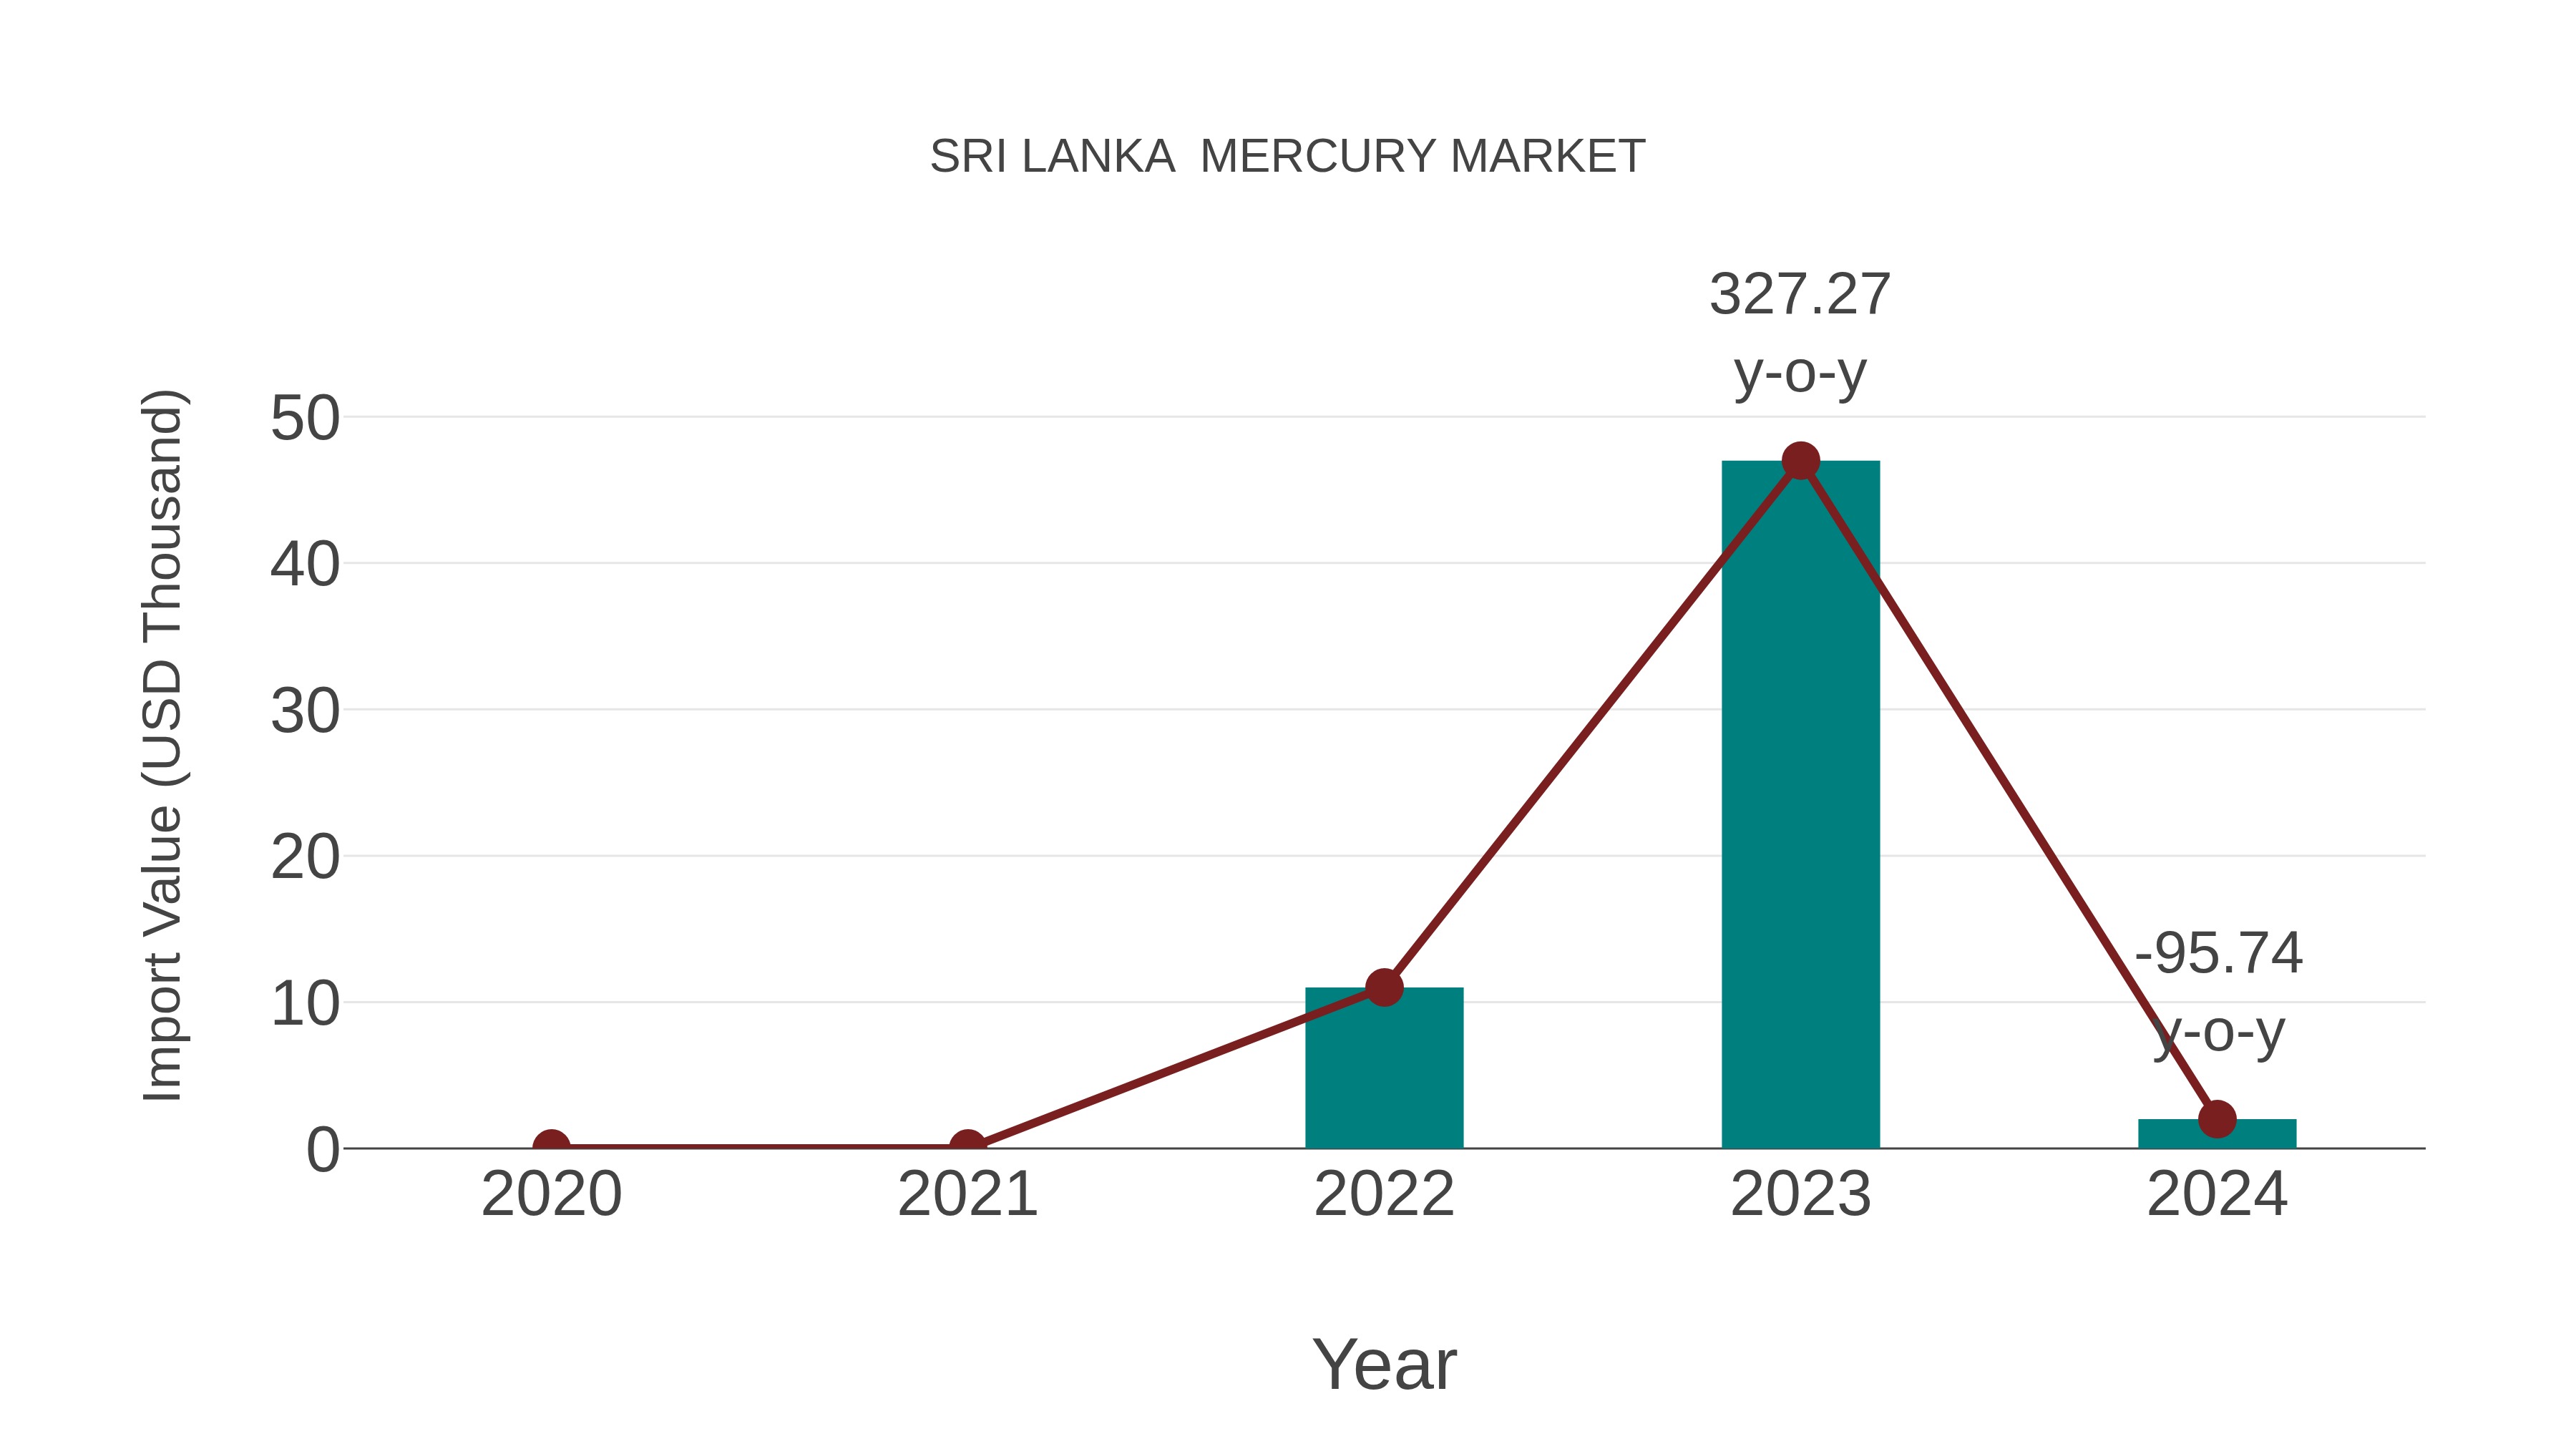
Sri Lanka Mercury Market: Import Trend Analysis
Sri Lanka import trend for the mercury market showed a significant decline from 2023 to 2024, with a growth rate of -95.74%. The compound annual growth rate (CAGR) for 2020-2024 was -57.36%. This decline could be attributed to changes in environmental regulations impacting mercury usage.
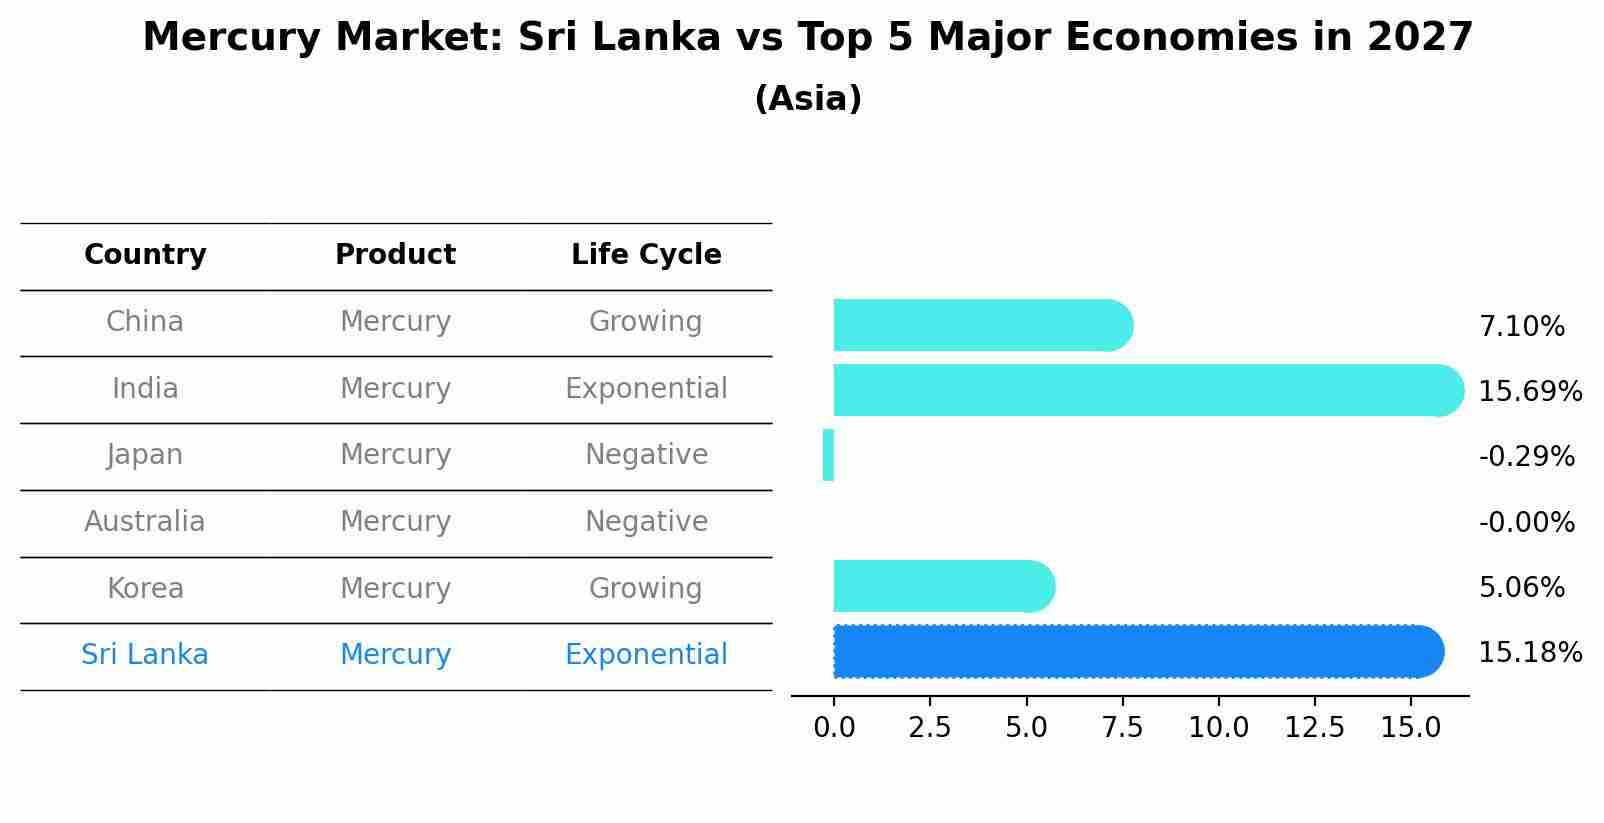
Mercury Market: Sri Lanka vs Top 5 Major Economies in 2027 (Asia)
In the Asia region, the Mercury market in Sri Lanka is projected to expand at a exponential growth rate of 15.18% by 2027. The largest economy is China, followed by India, Japan, Australia and South Korea.
Sri Lanka Mercury Market Overview
Sri Lanka mercury market is small, primarily catering to niche industrial applications such as electronics manufacturing, dental amalgams, and laboratory chemicals. Mercury, despite its toxic properties, remains essential in certain industrial processes where alternatives are limited or less effective. The market dynamics are influenced by regulatory restrictions on mercury use, technological advancements in mercury-free alternatives, and global efforts to reduce mercury emissions and environmental impact.
Drivers of the market
The mercury market in Sri Lanka is driven by its applications in various industrial processes, including mining, electrical equipment manufacturing, and chemical production. Mercury is used in the extraction of gold and silver, in fluorescent lamps, and in the production of chlorine and caustic soda. The growth of these industries supports the demand for mercury. However, the market is also influenced by environmental regulations and initiatives aimed at reducing mercury usage due to its toxic effects. The development of alternative technologies and materials may impact the long-term growth of the mercury market.
Challenges of the market
Challenges in Sri Lanka mercury market include regulatory restrictions, environmental concerns, and health risks. Businesses must navigate stringent regulations on mercury handling, storage, and disposal while ensuring occupational safety and environmental sustainability. Moreover, addressing mercury contamination in natural ecosystems and promoting mercury-free alternatives pose significant hurdles. Investing in mercury pollution mitigation technologies, adopting sustainable industrial practices, and advocating for policy reforms are essential to overcoming these challenges and promoting mercury-free environments.
Government Policy of the market
The Sri Lankan government regulates the mercury market to ensure public health and environmental safety. Policies focus on controlling mercury use and emissions, promoting safe handling and disposal practices, and supporting research and development in mercury-free alternatives.
Key Highlights of the Report:
- Sri Lanka Mercury Market Outlook
- Market Size of Sri Lanka Mercury Market, 2025
- Forecast of Sri Lanka Mercury Market, 2032
- Historical Data and Forecast of Sri Lanka Mercury Revenues & Volume for the Period 2022-2032F
- Sri Lanka Mercury Market Trend Evolution
- Sri Lanka Mercury Market Drivers and Challenges
- Sri Lanka Mercury Price Trends
- Sri Lanka Mercury Porter's Five Forces
- Sri Lanka Mercury Industry Life Cycle
- Historical Data and Forecast of Sri Lanka Mercury Market Revenues & Volume By Application for the Period 2022-2032F
- Historical Data and Forecast of Sri Lanka Mercury Market Revenues & Volume By Chemical manufacturing for the Period 2022-2032F
- Historical Data and Forecast of Sri Lanka Mercury Market Revenues & Volume By Artisanal gold mining for the Period 2022-2032F
- Historical Data and Forecast of Sri Lanka Mercury Market Revenues & Volume By Batteries for the Period 2022-2032F
- Historical Data and Forecast of Sri Lanka Mercury Market Revenues & Volume By Dentistry for the Period 2022-2032F
- Historical Data and Forecast of Sri Lanka Mercury Market Revenues & Volume By Measurement And Control Devices for the Period 2022-2032F
- Historical Data and Forecast of Sri Lanka Mercury Market Revenues & Volume By Electrical and lighting for the Period 2022-2032F
- Historical Data and Forecast of Sri Lanka Mercury Market Revenues & Volume By Others for the Period 2022-2032F
- Sri Lanka Mercury Import Export Trade Statistics
- Market Opportunity Assessment By Application
- Sri Lanka Mercury Top Companies Market Share
- Sri Lanka Mercury Competitive Benchmarking By Technical and Operational Parameters
- Sri Lanka Mercury Company Profiles
- Sri Lanka Mercury Key Strategic Recommendations
Sri Lanka Mercury Market (2026-2032): FAQs
6Wresearch actively monitors the Sri Lanka Mercury Market and publishes its comprehensive annual report, highlighting emerging trends, growth drivers, revenue analysis, and forecast outlook. Our insights help businesses to make data-backed strategic decisions with ongoing market dynamics. Our analysts track relevent industries related to the Sri Lanka Mercury Market, allowing our clients with actionable intelligence and reliable forecasts tailored to emerging regional needs.
Yes, we provide customisation as per your requirements. To learn more, feel free to contact us on sales@6wresearch.com
1 Executive Summary |
2 Introduction |
2.1 Key Highlights of the Report |
2.2 Report Description |
2.3 Market Scope & Segmentation |
2.4 Research Methodology |
2.5 Assumptions |
3 Sri Lanka Mercury Market Overview |
3.1 Sri Lanka Country Macro Economic Indicators |
3.2 Sri Lanka Mercury Market Revenues & Volume, 2022 & 2032F |
3.3 Sri Lanka Mercury Market - Industry Life Cycle |
3.4 Sri Lanka Mercury Market - Porter's Five Forces |
3.5 Sri Lanka Mercury Market Revenues & Volume Share, By Application, 2022 & 2032F |
4 Sri Lanka Mercury Market Dynamics |
4.1 Impact Analysis |
4.2 Market Drivers |
4.2.1 Increasing industrial applications of mercury in sectors such as healthcare, electronics, and agriculture. |
4.2.2 Growing demand for mercury in the manufacturing of thermometers, barometers, and other scientific equipment. |
4.2.3 Rise in mining activities leading to higher production and distribution of mercury. |
4.3 Market Restraints |
4.3.1 Environmental concerns and regulations regarding the use and disposal of mercury. |
4.3.2 Health risks associated with mercury exposure for both humans and wildlife. |
4.3.3 Shift towards alternative materials and technologies reducing the demand for mercury. |
5 Sri Lanka Mercury Market Trends |
6 Sri Lanka Mercury Market, By Types |
6.1 Sri Lanka Mercury Market, By Application |
6.1.1 Overview and Analysis |
6.1.2 Sri Lanka Mercury Market Revenues & Volume, By Application, 2022-2032F |
6.1.3 Sri Lanka Mercury Market Revenues & Volume, By Chemical manufacturing, 2022-2032F |
6.1.4 Sri Lanka Mercury Market Revenues & Volume, By Artisanal gold mining, 2022-2032F |
6.1.5 Sri Lanka Mercury Market Revenues & Volume, By Batteries, 2022-2032F |
6.1.6 Sri Lanka Mercury Market Revenues & Volume, By Dentistry, 2022-2032F |
6.1.7 Sri Lanka Mercury Market Revenues & Volume, By Measurement And Control Devices, 2022-2032F |
6.1.8 Sri Lanka Mercury Market Revenues & Volume, By Electrical and lighting, 2022-2032F |
7 Sri Lanka Mercury Market Import-Export Trade Statistics |
7.1 Sri Lanka Mercury Market Export to Major Countries |
7.2 Sri Lanka Mercury Market Imports from Major Countries |
8 Sri Lanka Mercury Market Key Performance Indicators |
8.1 Amount of mercury used in key industries in Sri Lanka. |
8.2 Number of mining permits issued for mercury extraction. |
8.3 Investments in research and development for mercury-free technologies. |
8.4 Compliance rate with environmental regulations related to mercury handling and disposal. |
8.5 Number of reported cases of mercury poisoning or contamination in Sri Lanka. |
9 Sri Lanka Mercury Market - Opportunity Assessment |
9.1 Sri Lanka Mercury Market Opportunity Assessment, By Application, 2022 & 2032F |
10 Sri Lanka Mercury Market - Competitive Landscape |
10.1 Sri Lanka Mercury Market Revenue Share, By Companies, 2025 |
10.2 Sri Lanka Mercury Market Competitive Benchmarking, By Operating and Technical Parameters |
11 Company Profiles |
12 Recommendations |
13 Disclaimer |
Global Go To Market Strategy - 2030
Export potential enables firms to identify high-growth global markets with greater confidence by combining advanced trade intelligence with a structured quantitative methodology. The framework analyzes emerging demand trends and country-level import patterns while integrating macroeconomic and trade datasets such as GDP and population forecasts, bilateral import–export flows, tariff structures, elasticity differentials between developed and developing economies, geographic distance, and import demand projections. Using weighted trade values from 2020–2024 as the base period to project country-to-country export potential for 2030, these inputs are operationalized through calculated drivers such as gravity model parameters, tariff impact factors, and projected GDP per-capita growth. Through an analysis of hidden potentials, demand hotspots, and market conditions that are most favorable to success, this method enables firms to focus on target countries, maximize returns, and global expansion with data, backed by accuracy.
By factoring in the projected importer demand gap that is currently unmet and could be potential opportunity, it identifies the potential for the Exporter (Country) among 190 countries, against the general trade analysis, which identifies the biggest importer or exporter.
To discover high-growth global markets and optimize your business strategy:
Click Here
Pricing
- Single User License$ 1,995
- Department License$ 2,400
- Site License$ 3,120
- Global License$ 3,795

Leadership Perspectives from Industry Events
Search
Thought Leadership and Analyst Meet


Our Clients
6WResearch In News
- India Air Conditioner Market Set for Strong Rebound in 2026 After Weather-Led Correction and GST-Driven Recovery: 6Wresearch
- ADAS in India: How Automatic Emergency Braking, Blind Spot Detection & Driver Monitoring are Transforming Road Safety
- Doha a strategic location for EV manufacturing hub: IPA Qatar
- Demand for luxury TVs surging in the GCC, says Samsung
- Empowering Growth: The Thriving Journey of Bangladesh’s Cable Industry
- Demand for luxury TVs surging in the GCC, says Samsung
Latest Reports
- Nicaragua RPG Gaming Market (2026-2032)
- New Zealand RPG Gaming Market (2026-2032)
- Netherlands RPG Gaming Market (2026-2032)
- Nauru RPG Gaming Market (2026-2032)
- Namibia RPG Gaming Market (2026-2032)
- Mozambique RPG Gaming Market (2026-2032)
- Montenegro RPG Gaming Market (2026-2032)
- Mongolia RPG Gaming Market (2026-2032)
- Monaco RPG Gaming Market (2026-2032)
- Micronesia RPG Gaming Market (2026-2032)
Industry Events and Analyst Meet

HIMTEX 2026

India Refining Summit 2026

India EV Show 2026

EV tech India Expo 2026

Auto Tech Asia 2026
Whitepaper
- Middle East & Africa Commercial Security Market Click here to view more.
- Middle East & Africa Fire Safety Systems & Equipment Market Click here to view more.
- GCC Drone Market Click here to view more.
- Middle East Lighting Fixture Market Click here to view more.
- GCC Physical & Perimeter Security Market Click here to view more.