Suriname Light Sensors Market (2026-2032) | Share, Trends, Size & Revenue, Forecast, Growth, Competitive Landscape, Outlook, Segmentation, Companies, Industry, Value, Analysis
Market Forecast By Function (Ambient Light Sensing, Proximity Detection, RGB Color Sensing, Gesture Recognition, UV/Infrared Light (IR) Detection), By Output (Analog, Digital), By Integration (Discrete, Combination), By End Use Industry (Consumer Electronics, Automotive, Home Automation, Industrial Automation, Healthcare, Entertainment, Others) And Competitive Landscape
| Product Code: ETC9515016 | Publication Date: Sep 2024 | Updated Date: Apr 2026 | Product Type: Market Research Report | |
| Publisher: 6Wresearch | Author: Dhaval Chaurasia | No. of Pages: 75 | No. of Figures: 35 | No. of Tables: 20 |
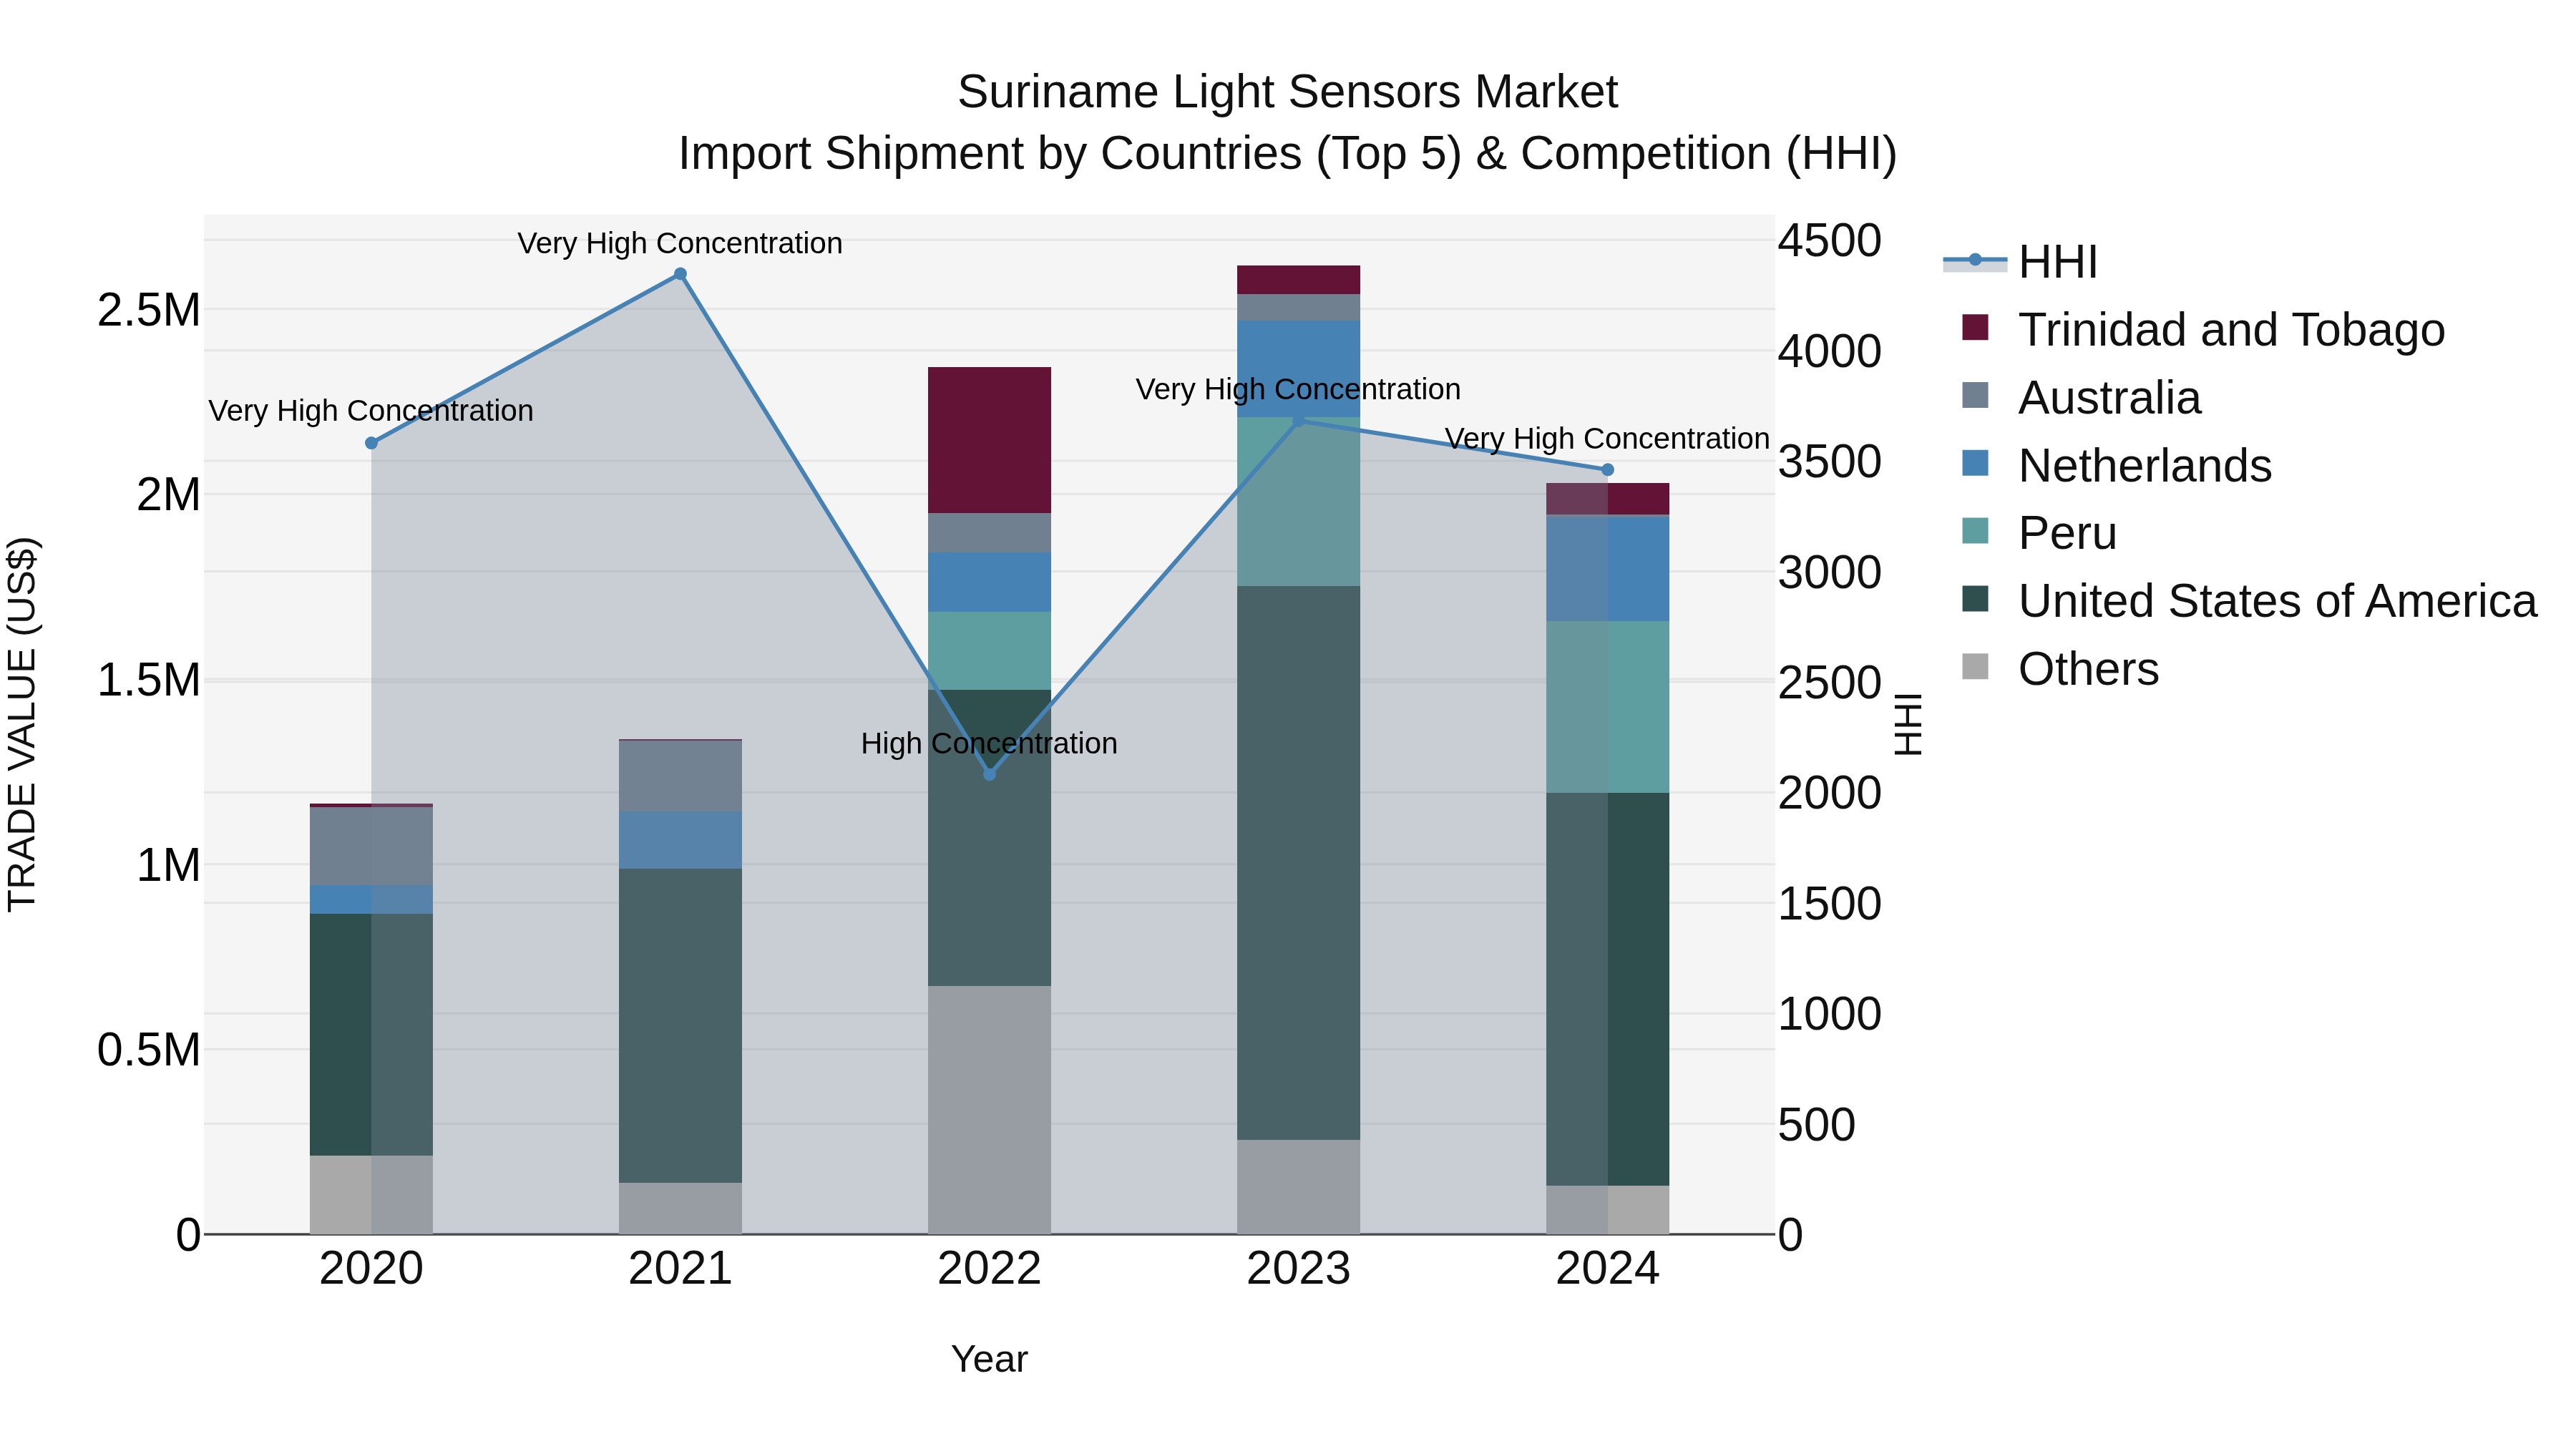
Suriname Light Sensors Market: Top 5 Importing Countries and Market Competition (HHI) Analysis
Suriname light sensors import market in 2024 continues to be dominated by top exporters such as the United States, Peru, and the Netherlands. Despite a significant decrease in growth rate from 2023 to 2024, the industry maintained a high level of market concentration, as indicated by the high HHI value. With a strong compound annual growth rate of 14.91% over the past four years, the market is poised for continued expansion and opportunities for both existing and new players in the coming years.
Key Highlights of the Report:
- Suriname Light Sensors Market Outlook
- Market Size of Suriname Light Sensors Market, 2025
- Forecast of Suriname Light Sensors Market, 2032
- Historical Data and Forecast of Suriname Light Sensors Revenues & Volume for the Period 2022 - 2032
- Suriname Light Sensors Market Trend Evolution
- Suriname Light Sensors Market Drivers and Challenges
- Suriname Light Sensors Price Trends
- Suriname Light Sensors Porter's Five Forces
- Suriname Light Sensors Industry Life Cycle
- Historical Data and Forecast of Suriname Light Sensors Market Revenues & Volume By Function for the Period 2022 - 2032
- Historical Data and Forecast of Suriname Light Sensors Market Revenues & Volume By Ambient Light Sensing for the Period 2022 - 2032
- Historical Data and Forecast of Suriname Light Sensors Market Revenues & Volume By Proximity Detection for the Period 2022 - 2032
- Historical Data and Forecast of Suriname Light Sensors Market Revenues & Volume By RGB Color Sensing for the Period 2022 - 2032
- Historical Data and Forecast of Suriname Light Sensors Market Revenues & Volume By Gesture Recognition for the Period 2022 - 2032
- Historical Data and Forecast of Suriname Light Sensors Market Revenues & Volume By UV/Infrared Light (IR) Detection for the Period 2022 - 2032
- Historical Data and Forecast of Suriname Light Sensors Market Revenues & Volume By Output for the Period 2022 - 2032
- Historical Data and Forecast of Suriname Light Sensors Market Revenues & Volume By Analog for the Period 2022 - 2032
- Historical Data and Forecast of Suriname Light Sensors Market Revenues & Volume By Digital for the Period 2022 - 2032
- Historical Data and Forecast of Suriname Light Sensors Market Revenues & Volume By Integration for the Period 2022 - 2032
- Historical Data and Forecast of Suriname Light Sensors Market Revenues & Volume By Discrete for the Period 2022 - 2032
- Historical Data and Forecast of Suriname Light Sensors Market Revenues & Volume By Combination for the Period 2022 - 2032
- Historical Data and Forecast of Suriname Light Sensors Market Revenues & Volume By End Use Industry for the Period 2022 - 2032
- Historical Data and Forecast of Suriname Light Sensors Market Revenues & Volume By Consumer Electronics for the Period 2022 - 2032
- Historical Data and Forecast of Suriname Light Sensors Market Revenues & Volume By Automotive for the Period 2022 - 2032
- Historical Data and Forecast of Suriname Light Sensors Market Revenues & Volume By Home Automation for the Period 2022 - 2032
- Historical Data and Forecast of Suriname Light Sensors Market Revenues & Volume By Industrial Automation for the Period 2022 - 2032
- Historical Data and Forecast of Suriname Light Sensors Market Revenues & Volume By Healthcare for the Period 2022 - 2032
- Historical Data and Forecast of Suriname Light Sensors Market Revenues & Volume By Entertainment for the Period 2022 - 2032
- Historical Data and Forecast of Suriname Light Sensors Market Revenues & Volume By Others for the Period 2022 - 2032
- Suriname Light Sensors Import Export Trade Statistics
- Market Opportunity Assessment By Function
- Market Opportunity Assessment By Output
- Market Opportunity Assessment By Integration
- Market Opportunity Assessment By End Use Industry
- Suriname Light Sensors Top Companies Market Share
- Suriname Light Sensors Competitive Benchmarking By Technical and Operational Parameters
- Suriname Light Sensors Company Profiles
- Suriname Light Sensors Key Strategic Recommendations
Frequently Asked Questions About the Market Study (FAQs):
6Wresearch actively monitors the Suriname Light Sensors Market and publishes its comprehensive annual report, highlighting emerging trends, growth drivers, revenue analysis, and forecast outlook. Our insights help businesses to make data-backed strategic decisions with ongoing market dynamics. Our analysts track relevent industries related to the Suriname Light Sensors Market, allowing our clients with actionable intelligence and reliable forecasts tailored to emerging regional needs.
Yes, we provide customisation as per your requirements. To learn more, feel free to contact us on sales@6wresearch.com
1 Executive Summary |
2 Introduction |
2.1 Key Highlights of the Report |
2.2 Report Description |
2.3 Market Scope & Segmentation |
2.4 Research Methodology |
2.5 Assumptions |
3 Suriname Light Sensors Market Overview |
3.1 Suriname Country Macro Economic Indicators |
3.2 Suriname Light Sensors Market Revenues & Volume, 2022 & 2032F |
3.3 Suriname Light Sensors Market - Industry Life Cycle |
3.4 Suriname Light Sensors Market - Porter's Five Forces |
3.5 Suriname Light Sensors Market Revenues & Volume Share, By Function, 2022 & 2032F |
3.6 Suriname Light Sensors Market Revenues & Volume Share, By Output, 2022 & 2032F |
3.7 Suriname Light Sensors Market Revenues & Volume Share, By Integration, 2022 & 2032F |
3.8 Suriname Light Sensors Market Revenues & Volume Share, By End Use Industry, 2022 & 2032F |
4 Suriname Light Sensors Market Dynamics |
4.1 Impact Analysis |
4.2 Market Drivers |
4.2.1 Increasing adoption of IoT (Internet of Things) technology in Suriname, leading to higher demand for light sensors for smart home and smart city applications. |
4.2.2 Growing awareness about energy efficiency and sustainability, driving the need for light sensors to optimize lighting systems. |
4.2.3 Government initiatives promoting the use of renewable energy sources, boosting the demand for light sensors in solar-powered lighting solutions. |
4.3 Market Restraints |
4.3.1 High initial costs associated with advanced light sensor technologies may limit adoption among cost-sensitive consumers and businesses. |
4.3.2 Lack of skilled workforce for installation and maintenance of light sensor systems could hinder market growth. |
4.3.3 Limited availability of local manufacturing facilities for light sensors, leading to dependency on imports and potential supply chain disruptions. |
5 Suriname Light Sensors Market Trends |
6 Suriname Light Sensors Market, By Types |
6.1 Suriname Light Sensors Market, By Function |
6.1.1 Overview and Analysis |
6.1.2 Suriname Light Sensors Market Revenues & Volume, By Function, 2022 - 2032F |
6.1.3 Suriname Light Sensors Market Revenues & Volume, By Ambient Light Sensing, 2022 - 2032F |
6.1.4 Suriname Light Sensors Market Revenues & Volume, By Proximity Detection, 2022 - 2032F |
6.1.5 Suriname Light Sensors Market Revenues & Volume, By RGB Color Sensing, 2022 - 2032F |
6.1.6 Suriname Light Sensors Market Revenues & Volume, By Gesture Recognition, 2022 - 2032F |
6.1.7 Suriname Light Sensors Market Revenues & Volume, By UV/Infrared Light (IR) Detection, 2022 - 2032F |
6.2 Suriname Light Sensors Market, By Output |
6.2.1 Overview and Analysis |
6.2.2 Suriname Light Sensors Market Revenues & Volume, By Analog, 2022 - 2032F |
6.2.3 Suriname Light Sensors Market Revenues & Volume, By Digital, 2022 - 2032F |
6.3 Suriname Light Sensors Market, By Integration |
6.3.1 Overview and Analysis |
6.3.2 Suriname Light Sensors Market Revenues & Volume, By Discrete, 2022 - 2032F |
6.3.3 Suriname Light Sensors Market Revenues & Volume, By Combination, 2022 - 2032F |
6.4 Suriname Light Sensors Market, By End Use Industry |
6.4.1 Overview and Analysis |
6.4.2 Suriname Light Sensors Market Revenues & Volume, By Consumer Electronics, 2022 - 2032F |
6.4.3 Suriname Light Sensors Market Revenues & Volume, By Automotive, 2022 - 2032F |
6.4.4 Suriname Light Sensors Market Revenues & Volume, By Home Automation, 2022 - 2032F |
6.4.5 Suriname Light Sensors Market Revenues & Volume, By Industrial Automation, 2022 - 2032F |
6.4.6 Suriname Light Sensors Market Revenues & Volume, By Healthcare, 2022 - 2032F |
6.4.7 Suriname Light Sensors Market Revenues & Volume, By Entertainment, 2022 - 2032F |
7 Suriname Light Sensors Market Import-Export Trade Statistics |
7.1 Suriname Light Sensors Market Export to Major Countries |
7.2 Suriname Light Sensors Market Imports from Major Countries |
8 Suriname Light Sensors Market Key Performance Indicators |
8.1 Energy savings achieved by the implementation of light sensors in Suriname. |
8.2 Number of new smart home and smart city projects integrating light sensors. |
8.3 Percentage increase in the use of solar-powered lighting solutions in Suriname. |
8.4 Adoption rate of energy-efficient lighting technologies in the commercial sector. |
8.5 Number of partnerships and collaborations between government agencies and light sensor manufacturers for promoting sustainable lighting solutions. |
9 Suriname Light Sensors Market - Opportunity Assessment |
9.1 Suriname Light Sensors Market Opportunity Assessment, By Function, 2022 & 2032F |
9.2 Suriname Light Sensors Market Opportunity Assessment, By Output, 2022 & 2032F |
9.3 Suriname Light Sensors Market Opportunity Assessment, By Integration, 2022 & 2032F |
9.4 Suriname Light Sensors Market Opportunity Assessment, By End Use Industry, 2022 & 2032F |
10 Suriname Light Sensors Market - Competitive Landscape |
10.1 Suriname Light Sensors Market Revenue Share, By Companies, 2025 |
10.2 Suriname Light Sensors Market Competitive Benchmarking, By Operating and Technical Parameters |
11 Company Profiles |
12 Recommendations |
13 Disclaimer |
Export potential assessment - trade Analytics for 2030
Export potential enables firms to identify high-growth global markets with greater confidence by combining advanced trade intelligence with a structured quantitative methodology. The framework analyzes emerging demand trends and country-level import patterns while integrating macroeconomic and trade datasets such as GDP and population forecasts, bilateral import–export flows, tariff structures, elasticity differentials between developed and developing economies, geographic distance, and import demand projections. Using weighted trade values from 2020–2024 as the base period to project country-to-country export potential for 2030, these inputs are operationalized through calculated drivers such as gravity model parameters, tariff impact factors, and projected GDP per-capita growth. Through an analysis of hidden potentials, demand hotspots, and market conditions that are most favorable to success, this method enables firms to focus on target countries, maximize returns, and global expansion with data, backed by accuracy.
By factoring in the projected importer demand gap that is currently unmet and could be potential opportunity, it identifies the potential for the Exporter (Country) among 190 countries, against the general trade analysis, which identifies the biggest importer or exporter.
To discover high-growth global markets and optimize your business strategy:
Click Here
Pricing
- Single User License$ 1,995
- Department License$ 2,400
- Site License$ 3,120
- Global License$ 3,795

Search
Thought Leadership and Analyst Meet


Our Clients
Latest Reports
- China Electric Appliance Rental Market (2026-2032) | Trends, Revenue, Growth, Challenges, Size, Value, Outlook, Pricing, Strategy, Insights, Restraints, segmentation, Companies, Investment Opportunities, Analysis, Demand, Drivers, Competition, Forecast, Share
- Chile Electric Appliance Rental Market (2026-2032) | Outlook, Competition, Drivers, Strategy, Revenue, Analysis, Value, Pricing, Restraints, Size, Demand, Share, Growth, Forecast, Challenges, Insights, Investment Opportunities, Companies, Trends, segmentation
- Cambodia Electric Appliance Rental Market (2026-2032) | Companies, Analysis, Restraints, Pricing, Insights, Challenges, Outlook, Strategy, Forecast, Trends, Competition, Value, Revenue, Investment Opportunities, segmentation, Drivers, Size, Demand, Growth, Share
- Brazil Electric Appliance Rental Market (2026-2032) | Revenue, Strategy, Forecast, Companies, segmentation, Competition, Size, Investment Opportunities, Pricing, Restraints, Outlook, Challenges, Analysis, Drivers, Value, Demand, Insights, Trends, Growth, Share
- Bangladesh Electric Appliance Rental Market (2026-2032) | Drivers, Forecast, Investment Opportunities, Strategy, Insights, Demand, Challenges, Outlook, Trends, Competition, Value, Revenue, Size, Pricing, Analysis, Companies, Restraints, segmentation, Share, Growth
- Bahrain Electric Appliance Rental Market (2026-2032) | Outlook, Size, Competition, Restraints, Drivers, Value, Trends, Investment Opportunities, Insights, Forecast, Revenue, Strategy, Growth, Share, Demand, Analysis, Challenges, Companies, segmentation, Pricing
- Azerbaijan Electric Appliance Rental Market (2026-2032) | Trends, Investment Opportunities, Restraints, Insights, Strategy, Competition, Value, Growth, Demand, Drivers, Analysis, Forecast, Size, Share, Outlook, segmentation, Pricing, Challenges, Revenue, Companies
- Australia Electric Appliance Rental Market (2026-2032) | Challenges, Restraints, Forecast, Demand, Size, Competition, Pricing, Investment Opportunities, Revenue, Trends, Drivers, Growth, Outlook, Analysis, Strategy, Value, segmentation, Insights, Companies, Share
- Argentina Electric Appliance Rental Market (2026-2032) | Growth, Trends, Insights, Outlook, Forecast, Size, Drivers, Analysis, Restraints, Challenges, Share, Revenue, Investment Opportunities, Strategy, Demand, Value, Companies, segmentation, Competition, Pricing
- Algeria Electric Appliance Rental Market (2026-2032) | Share, Size, Value, Strategy, Competition, Outlook, Challenges, Companies, Trends, Pricing, Insights, Forecast, Investment Opportunities, Revenue, Growth, Restraints, segmentation, Analysis, Demand, Drivers
Industry Events and Analyst Meet

HIMTEX 2026

India Refining Summit 2026

India EV Show 2026

EV tech India Expo 2026

Auto Tech Asia 2026
Whitepaper
- Middle East & Africa Commercial Security Market Click here to view more.
- Middle East & Africa Fire Safety Systems & Equipment Market Click here to view more.
- GCC Drone Market Click here to view more.
- Middle East Lighting Fixture Market Click here to view more.
- GCC Physical & Perimeter Security Market Click here to view more.
6WResearch In News
- Doha a strategic location for EV manufacturing hub: IPA Qatar
- Demand for luxury TVs surging in the GCC, says Samsung
- Empowering Growth: The Thriving Journey of Bangladesh’s Cable Industry
- Demand for luxury TVs surging in the GCC, says Samsung
- Video call with a traditional healer? Once unthinkable, it’s now common in South Africa
- Intelligent Buildings To Smooth GCC’s Path To Net Zero