Sweden Rennet Market (2025-2031) | Companies, Trends, Value, Growth, Share, Size, Outlook, Analysis, Revenue, Forecast, Industry & Segmentation
Market Forecast By Type (Animal-derived Rennet, Microbial Rennet, Fermentation Produced Chymosin Rennet, Vegetable Rennet), By Form (Liquid, Powder, Paste), By End-Users (Food & Beverages, Pharmaceuticals, Industrial, Chemicals, Others), By Sales Channel (Online, Offline) And Competitive Landscape
| Product Code: ETC5046394 | Publication Date: Nov 2023 | Updated Date: Apr 2026 | Product Type: Market Research Report | |
| Publisher: 6Wresearch | Author: Sachin Kumar Rai | No. of Pages: 60 | No. of Figures: 30 | No. of Tables: 5 |
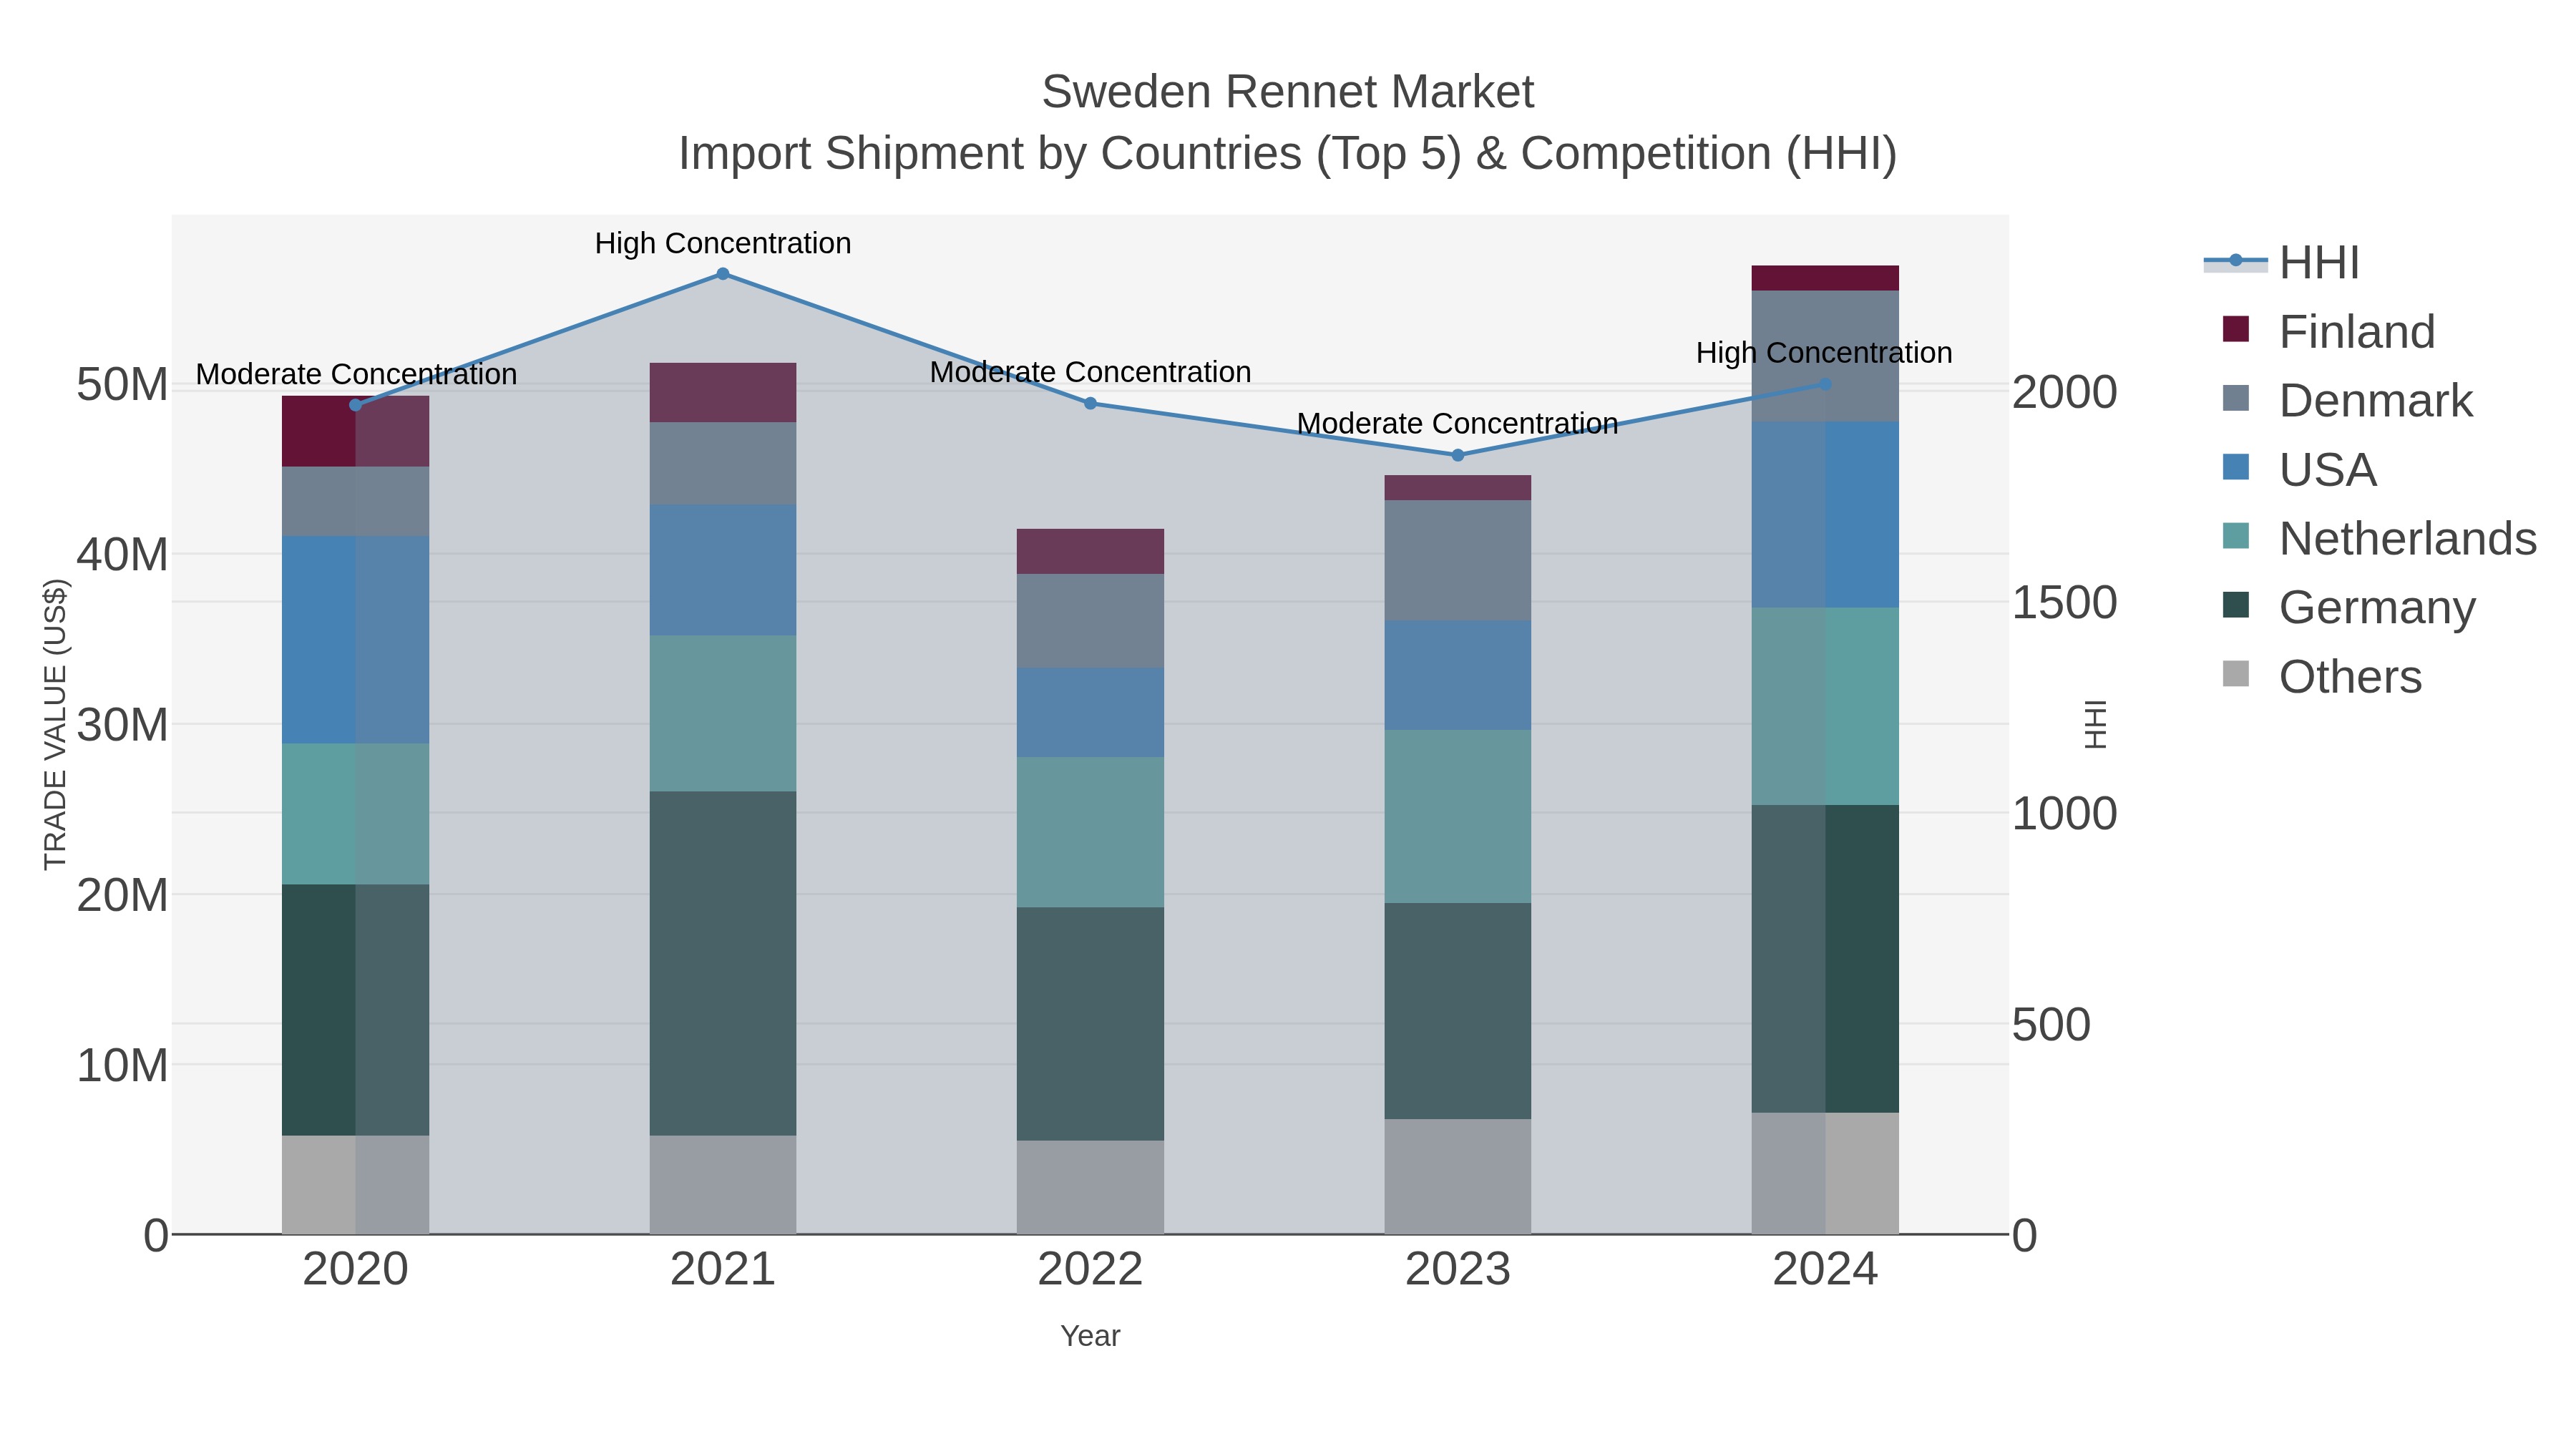
Sweden Rennet Market Top 5 Importing Countries and Market Competition (HHI) Analysis
Sweden`s rennet import market experienced a significant shift in 2024, with top exporting countries including Germany, Netherlands, USA, Denmark, and Metropolitan France. The Herfindahl-Hirschman Index (HHI) indicated a transition from moderate to high concentration within the market. The Compound Annual Growth Rate (CAGR) from 2020 to 2024 stood at 3.67%, while the growth rate spiked to 27.6% from 2023 to 2024. These trends suggest a dynamic and evolving landscape in Sweden`s rennet import sector, potentially signaling new opportunities and challenges for market players.
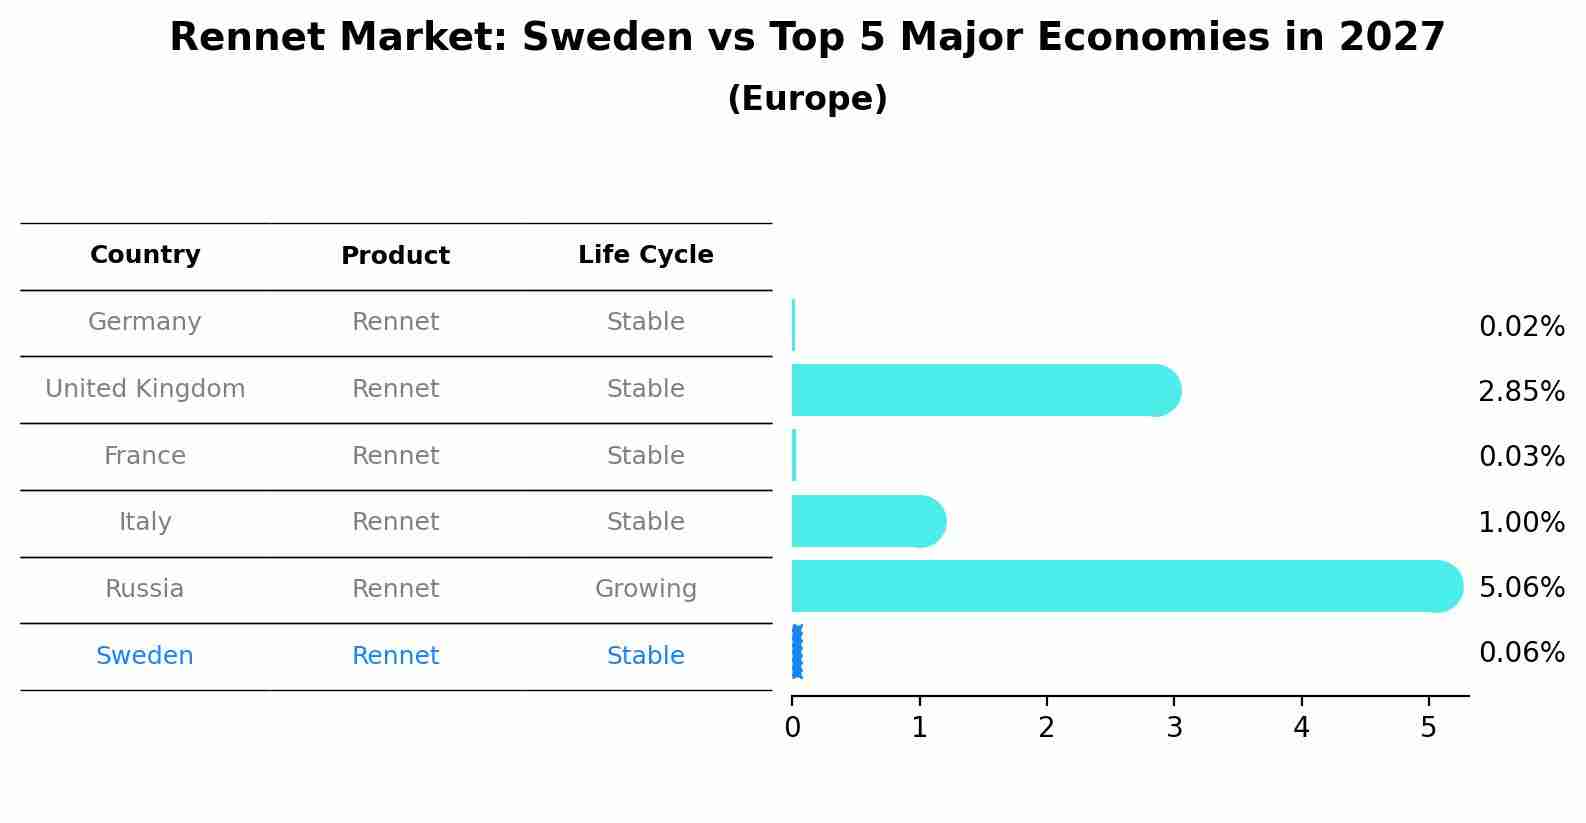
Rennet Market: Sweden vs Top 5 Major Economies in 2027 (Europe)
The Rennet market in Sweden is projected to grow at a stable growth rate of 0.06% by 2027, within the Europe region led by Germany, along with other countries like United Kingdom, France, Italy and Russia, collectively shaping a dynamic and evolving market environment driven by innovation and increasing adoption of emerging technologies.
Sweden Rennet Market Overview
The rennet market in Sweden is driven by its use in the dairy industry, particularly in cheese production. Rennet is an enzyme used to curdle milk during the cheese-making process. With Swedens strong dairy sector and the growing popularity of artisanal and specialty cheeses, the demand for both animal and microbial rennet continues to grow.
Drivers of the market
The rennet market in Sweden is influenced by the increasing demand for cheese and dairy products, which utilize rennet as a key ingredient in the cheese-making process. The growing popularity of specialty cheeses and the expansion of the dairy industry drive the demand for high-quality rennet products. Additionally, advancements in fermentation technologies and the availability of vegetarian and microbial rennet options contribute to market growth. The strong consumer preference for natural and organic products further supports the rennet market.
Challenges of the market
The rennet market faces challenges related to fluctuations in demand and competition from alternative coagulants. As the dairy industry evolves, manufacturers must adapt to changing consumer preferences and production processes. Additionally, competition from plant-based coagulants and other alternatives can pressure prices and profit margins. Regulatory compliance concerning food safety and labeling requirements adds complexity to market operations, requiring companies to ensure product quality and transparency while managing costs effectively.
Government Policy of the market
The rennet market in Sweden is influenced by government policies focused on food safety and quality assurance in dairy production. The Swedish government promotes regulations ensuring that rennet products meet stringent safety standards, fostering consumer trust in cheese production. Additionally, policies supporting the development of innovative dairy technologies drive demand for advanced rennet solutions. The government initiatives to promote local cheese production also contribute to the growth of the rennet market.
Key Highlights of the Report:
- Sweden Rennet Market Outlook
- Market Size of Sweden Rennet Market, 2024
- Forecast of Sweden Rennet Market, 2031
- Historical Data and Forecast of Sweden Rennet Revenues & Volume for the Period 2021-2031
- Sweden Rennet Market Trend Evolution
- Sweden Rennet Market Drivers and Challenges
- Sweden Rennet Price Trends
- Sweden Rennet Porter`s Five Forces
- Sweden Rennet Industry Life Cycle
- Historical Data and Forecast of Sweden Rennet Market Revenues & Volume By Type for the Period 2021-2031
- Historical Data and Forecast of Sweden Rennet Market Revenues & Volume By Animal-derived Rennet for the Period 2021-2031
- Historical Data and Forecast of Sweden Rennet Market Revenues & Volume By Microbial Rennet for the Period 2021-2031
- Historical Data and Forecast of Sweden Rennet Market Revenues & Volume By Fermentation Produced Chymosin Rennet for the Period 2021-2031
- Historical Data and Forecast of Sweden Rennet Market Revenues & Volume By Vegetable Rennet for the Period 2021-2031
- Historical Data and Forecast of Sweden Rennet Market Revenues & Volume By Form for the Period 2021-2031
- Historical Data and Forecast of Sweden Rennet Market Revenues & Volume By Liquid for the Period 2021-2031
- Historical Data and Forecast of Sweden Rennet Market Revenues & Volume By Powder for the Period 2021-2031
- Historical Data and Forecast of Sweden Rennet Market Revenues & Volume By Paste for the Period 2021-2031
- Historical Data and Forecast of Sweden Rennet Market Revenues & Volume By End-Users for the Period 2021-2031
- Historical Data and Forecast of Sweden Rennet Market Revenues & Volume By Food & Beverages for the Period 2021-2031
- Historical Data and Forecast of Sweden Rennet Market Revenues & Volume By Pharmaceuticals for the Period 2021-2031
- Historical Data and Forecast of Sweden Rennet Market Revenues & Volume By Industrial for the Period 2021-2031
- Historical Data and Forecast of Sweden Rennet Market Revenues & Volume By Chemicals for the Period 2021-2031
- Historical Data and Forecast of Sweden Rennet Market Revenues & Volume By Others for the Period 2021-2031
- Historical Data and Forecast of Sweden Rennet Market Revenues & Volume By Sales Channel for the Period 2021-2031
- Historical Data and Forecast of Sweden Rennet Market Revenues & Volume By Online for the Period 2021-2031
- Historical Data and Forecast of Sweden Rennet Market Revenues & Volume By Offline for the Period 2021-2031
- Sweden Rennet Import Export Trade Statistics
- Market Opportunity Assessment By Type
- Market Opportunity Assessment By Form
- Market Opportunity Assessment By End-Users
- Market Opportunity Assessment By Sales Channel
- Sweden Rennet Top Companies Market Share
- Sweden Rennet Competitive Benchmarking By Technical and Operational Parameters
- Sweden Rennet Company Profiles
- Sweden Rennet Key Strategic Recommendations
Frequently Asked Questions About the Market Study (FAQs):
6Wresearch actively monitors the Sweden Rennet Market and publishes its comprehensive annual report, highlighting emerging trends, growth drivers, revenue analysis, and forecast outlook. Our insights help businesses to make data-backed strategic decisions with ongoing market dynamics. Our analysts track relevent industries related to the Sweden Rennet Market, allowing our clients with actionable intelligence and reliable forecasts tailored to emerging regional needs.
Yes, we provide customisation as per your requirements. To learn more, feel free to contact us on sales@6wresearch.com
1 Executive Summary |
2 Introduction |
2.1 Key Highlights of the Report |
2.2 Report Description |
2.3 Market Scope & Segmentation |
2.4 Research Methodology |
2.5 Assumptions |
3 Sweden Rennet Market Overview |
3.1 Sweden Country Macro Economic Indicators |
3.2 Sweden Rennet Market Revenues & Volume, 2021 & 2031F |
3.3 Sweden Rennet Market - Industry Life Cycle |
3.4 Sweden Rennet Market - Porter's Five Forces |
3.5 Sweden Rennet Market Revenues & Volume Share, By Type, 2021 & 2031F |
3.6 Sweden Rennet Market Revenues & Volume Share, By Form, 2021 & 2031F |
3.7 Sweden Rennet Market Revenues & Volume Share, By End-Users, 2021 & 2031F |
3.8 Sweden Rennet Market Revenues & Volume Share, By Sales Channel, 2021 & 2031F |
4 Sweden Rennet Market Dynamics |
4.1 Impact Analysis |
4.2 Market Drivers |
4.2.1 Increasing demand for natural and organic food products, leading to a preference for rennet from Sweden. |
4.2.2 Growing awareness among consumers about the health benefits of using rennet in food preparation. |
4.2.3 Rise in the number of specialty cheese makers in Sweden, driving the demand for rennet as a key ingredient. |
4.3 Market Restraints |
4.3.1 Fluctuations in milk prices, impacting the cost of production for cheese makers using rennet. |
4.3.2 Stringent regulations regarding the production and usage of rennet in food products. |
4.3.3 Competition from alternative sources of rennet, such as microbial or vegetable rennet. |
5 Sweden Rennet Market Trends |
6 Sweden Rennet Market Segmentations |
6.1 Sweden Rennet Market, By Type |
6.1.1 Overview and Analysis |
6.1.2 Sweden Rennet Market Revenues & Volume, By Animal-derived Rennet, 2021-2031F |
6.1.3 Sweden Rennet Market Revenues & Volume, By Microbial Rennet, 2021-2031F |
6.1.4 Sweden Rennet Market Revenues & Volume, By Fermentation Produced Chymosin Rennet, 2021-2031F | 6.1.6 Sweden Rennet Market Revenues & Volume, By Vegetable Rennet, 2021-2031F |
6.2 Sweden Rennet Market, By Form |
6.2.1 Overview and Analysis |
6.2.2 Sweden Rennet Market Revenues & Volume, By Liquid, 2021-2031F |
6.2.3 Sweden Rennet Market Revenues & Volume, By Powder, 2021-2031F |
6.2.4 Sweden Rennet Market Revenues & Volume, By Paste, 2021-2031F |
6.3 Sweden Rennet Market, By End-Users |
6.3.1 Overview and Analysis |
6.3.2 Sweden Rennet Market Revenues & Volume, By Food & Beverages, 2021-2031F |
6.3.3 Sweden Rennet Market Revenues & Volume, By Pharmaceuticals, 2021-2031F |
6.3.4 Sweden Rennet Market Revenues & Volume, By Industrial, 2021-2031F |
6.3.5 Sweden Rennet Market Revenues & Volume, By Chemicals, 2021-2031F |
6.3.6 Sweden Rennet Market Revenues & Volume, By Others, 2021-2031F |
6.4 Sweden Rennet Market, By Sales Channel |
6.4.1 Overview and Analysis |
6.4.2 Sweden Rennet Market Revenues & Volume, By Online, 2021-2031F |
6.4.3 Sweden Rennet Market Revenues & Volume, By Offline, 2021-2031F |
7 Sweden Rennet Market Import-Export Trade Statistics |
7.1 Sweden Rennet Market Export to Major Countries |
7.2 Sweden Rennet Market Imports from Major Countries |
8 Sweden Rennet Market Key Performance Indicators |
8.1 Number of new product launches featuring Swedish rennet. |
8.2 Consumer perception surveys on the quality and authenticity of Swedish rennet. |
8.3 Adoption rate of Swedish rennet among commercial cheese producers. |
8.4 Average time taken for product development cycles incorporating Swedish rennet. |
9 Sweden Rennet Market - Opportunity Assessment |
9.1 Sweden Rennet Market Opportunity Assessment, By Type, 2021 & 2031F |
9.2 Sweden Rennet Market Opportunity Assessment, By Form, 2021 & 2031F |
9.3 Sweden Rennet Market Opportunity Assessment, By End-Users, 2021 & 2031F |
9.4 Sweden Rennet Market Opportunity Assessment, By Sales Channel, 2021 & 2031F |
10 Sweden Rennet Market - Competitive Landscape |
10.1 Sweden Rennet Market Revenue Share, By Companies, 2024 |
10.2 Sweden Rennet Market Competitive Benchmarking, By Operating and Technical Parameters |
11 Company Profiles |
12 Recommendations | 13 Disclaimer |
Export potential assessment - trade Analytics for 2030
Export potential enables firms to identify high-growth global markets with greater confidence by combining advanced trade intelligence with a structured quantitative methodology. The framework analyzes emerging demand trends and country-level import patterns while integrating macroeconomic and trade datasets such as GDP and population forecasts, bilateral import–export flows, tariff structures, elasticity differentials between developed and developing economies, geographic distance, and import demand projections. Using weighted trade values from 2020–2024 as the base period to project country-to-country export potential for 2030, these inputs are operationalized through calculated drivers such as gravity model parameters, tariff impact factors, and projected GDP per-capita growth. Through an analysis of hidden potentials, demand hotspots, and market conditions that are most favorable to success, this method enables firms to focus on target countries, maximize returns, and global expansion with data, backed by accuracy.
By factoring in the projected importer demand gap that is currently unmet and could be potential opportunity, it identifies the potential for the Exporter (Country) among 190 countries, against the general trade analysis, which identifies the biggest importer or exporter.
To discover high-growth global markets and optimize your business strategy:
Click Here
Pricing
- Single User License$ 1,995
- Department License$ 2,400
- Site License$ 3,120
- Global License$ 3,795

Search
Thought Leadership and Analyst Meet


Our Clients
Latest Reports
- Canada Cloud CFD Market (2026-2032) | Size & Revenue, Industry, Growth, Competitive Landscape, Forecast, Segmentation, Value, Outlook, Trends, Share, Analysis, Companies
- Taiwan Food Delivery Platform Market (2026-2032) | Companies, Outlook, Analysis, Trends, Value, Revenue, Segmentation, Share, Forecast, Competitive Landscape, Growth, Size & Forecast
- United Kingdom (UK) Long-term Care Insurance Market (2026-2032) | Growth, Share, Consumer Insights, Drivers, Opportunities, Competition, Pricing Analysis, Segments, Restraints, Companies, Competitive, Value, Outlook, Size, Demand, Analysis, Challenges, Strategic Insights, Investment Trends, Revenue, Trends, Supply, Forecast
- United Kingdom (UK) Long Term Care Market (2026-2032) | Companies, Outlook, Analysis, Trends, Value, Revenue, Segmentation, Share, Forecast, Competitive Landscape, Growth, Size & Forecast
- Iraq Insulation and Waterproofing Market (2026-2032) | Outlook, Drivers, Growth, Size, Share, Industry, Revenue, Trends, Demand, Competitive, Strategic Insights, Opportunities, Segments, Companies, Challenges, Strategy, Consumer Insights, Analysis, Investment Trends, Value, Segmentation, Forecast, Restraints
- India Switchgear Market Outlook (2026-2032) | Size, Share, Trends, Growth, Revenue, Forecast, Analysis, Value, Outlook
- Pakistan Contraceptive Implants Market (2025-2031) | Demand, Growth, Size, Share, Industry, Pricing Analysis, Competitive, Strategic Insights, Strategy, Consumer Insights, Analysis, Investment Trends, Opportunities, Revenue, Segments, Value, Segmentation, Supply, Forecast, Restraints, Outlook, Competition, Drivers, Trends, Companies, Challenges
- Sri Lanka Packaging Market (2026-2032) | Outlook, Competition, Drivers, Trends, Demand, Pricing Analysis, Competitive, Strategic Insights, Companies, Challenges, Strategy, Consumer Insights, Analysis, Investment Trends, Opportunities, Growth, Size, Share, Industry, Revenue, Segments, Value, Segmentation, Supply, Forecast, Restraints
- India Kids Watches Market (2026-2032) | Strategy, Consumer Insights, Analysis, Investment Trends, Opportunities, Growth, Size, Share, Industry, Revenue, Segments, Value, Segmentation, Supply, Forecast, Restraints, Outlook, Competition, Drivers, Trends, Demand, Pricing Analysis, Competitive, Strategic Insights, Companies, Challenges
- Saudi Arabia Core Assurance Service Market (2025-2031) | Strategy, Consumer Insights, Analysis, Investment Trends, Opportunities, Growth, Size, Share, Industry, Revenue, Segments, Value, Segmentation, Supply, Forecast, Restraints, Outlook, Competition, Drivers, Trends, Demand, Pricing Analysis, Competitive, Strategic Insights, Companies, Challenges
Industry Events and Analyst Meet

India EV Show 2026

EV tech India Expo 2026

Auto Tech Asia 2026

Battery Tech India 2026

Smart Production Solutions Guangzhou 2026
Whitepaper
- Middle East & Africa Commercial Security Market Click here to view more.
- Middle East & Africa Fire Safety Systems & Equipment Market Click here to view more.
- GCC Drone Market Click here to view more.
- Middle East Lighting Fixture Market Click here to view more.
- GCC Physical & Perimeter Security Market Click here to view more.
6WResearch In News
- Doha a strategic location for EV manufacturing hub: IPA Qatar
- Demand for luxury TVs surging in the GCC, says Samsung
- Empowering Growth: The Thriving Journey of Bangladesh’s Cable Industry
- Demand for luxury TVs surging in the GCC, says Samsung
- Video call with a traditional healer? Once unthinkable, it’s now common in South Africa
- Intelligent Buildings To Smooth GCC’s Path To Net Zero