Tanzania Ceramic Tableware Market (2025-2031) | Size, Companies, Value, Growth, Revenue, Analysis, COVID-19 IMPACT, Industry, Trends, Forecast, Outlook & Share
Market Forecast By Products (Ceramic Dinnerware, Ceramic Beverageware, Ceramic Flatware), By Materials (China, Stoneware, Porcelain, Others), By Applications (Household Purpose, Commercial Purpose), By Distribution Channels (Online Channel, Offline Channel) And Competitive Landscape
| Product Code: ETC042755 | Publication Date: Jan 2021 | Updated Date: Apr 2025 | Product Type: Report | |
| Publisher: 6Wresearch | Author: Ravi Bhandari | No. of Pages: 70 | No. of Figures: 35 | No. of Tables: 5 |
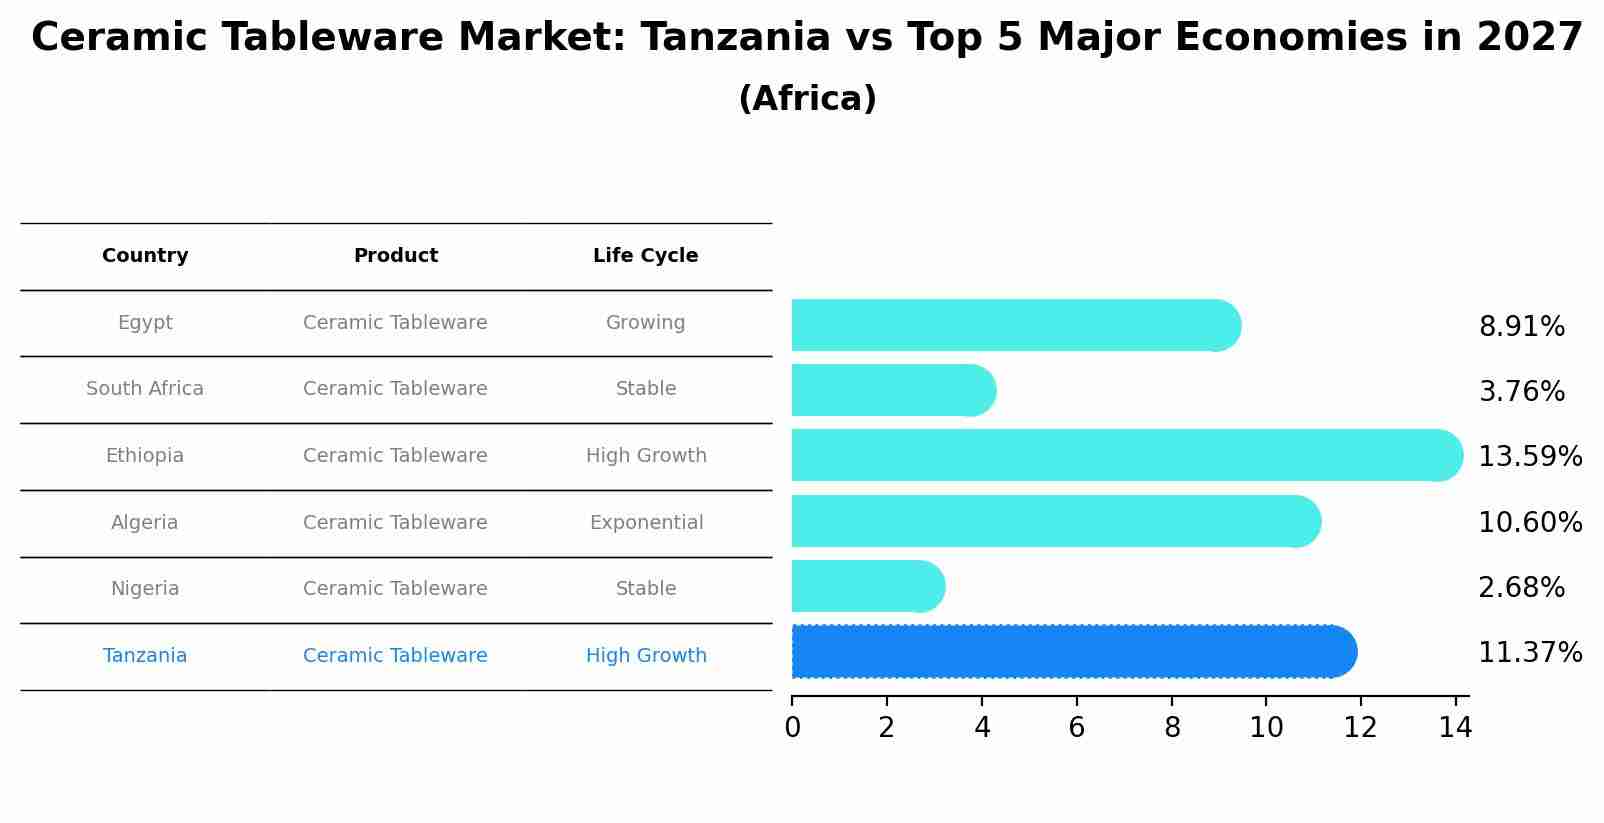
Ceramic Tableware Market: Tanzania vs Top 5 Major Economies in 2027 (Africa)
By 2027, Tanzania's Ceramic Tableware market is forecasted to achieve a high growth rate of 11.37%, with Egypt leading the Africa region, followed by South Africa, Ethiopia, Algeria and Nigeria.
Tanzania Ceramic Tableware Market Overview
The ceramic tableware market in Tanzania is buoyed by a growing middle class and changing lifestyle trends. Demand for aesthetically pleasing and durable tableware is rising, with consumers favoring ceramic due to its versatility and variety in design. The market also benefits from the hospitality sector, which requires high-quality tableware.
Drivers of the market
The Tanzania Ceramic Tableware Market is driven by the rising disposable incomes and changing lifestyle preferences, leading to increased demand for high-quality and aesthetically appealing tableware products. The growth of the hospitality industry, including hotels and restaurants, also contributes to the market expansion. Additionally, the increasing trend of home dining and entertaining guests at home boosts the demand for ceramic tableware.
Challenges of the market
The ceramic tableware market in Tanzania faces significant challenges due to high production costs, import competition, and low local demand. Local manufacturers struggle with the high costs of raw materials and energy, making their products less competitive compared to imported tableware. Additionally, there is limited consumer awareness and preference for high-quality ceramic tableware, which affects market growth. The lack of skilled artisans and advanced production technology also hampers the ability to produce intricate and high-quality designs.
Government Policy of the market
Government policies in Tanzania concerning the ceramic tableware market emphasize consumer protection, food safety regulations, and export quality standards. These policies aim to ensure product safety and hygiene, promote cultural craftsmanship in tableware production, and regulate international trade to maintain market competitiveness.
Key Highlights of the Report:
- Tanzania Ceramic Tableware Market Outlook
- Market Size of Tanzania Ceramic Tableware Market, 2024
- Forecast of Tanzania Ceramic Tableware Market, 2031
- Historical Data and Forecast of Tanzania Ceramic Tableware Revenues & Volume for the Period 2021-2031
- Tanzania Ceramic Tableware Market Trend Evolution
- Tanzania Ceramic Tableware Market Drivers and Challenges
- Tanzania Ceramic Tableware Price Trends
- Tanzania Ceramic Tableware Porter's Five Forces
- Tanzania Ceramic Tableware Industry Life Cycle
- Historical Data and Forecast of Tanzania Ceramic Tableware Market Revenues & Volume By Products for the Period 2021-2031
- Historical Data and Forecast of Tanzania Ceramic Tableware Market Revenues & Volume By Ceramic Dinnerware for the Period 2021-2031
- Historical Data and Forecast of Tanzania Ceramic Tableware Market Revenues & Volume By Ceramic Beverageware for the Period 2021-2031
- Historical Data and Forecast of Tanzania Ceramic Tableware Market Revenues & Volume By Ceramic Flatware for the Period 2021-2031
- Historical Data and Forecast of Tanzania Ceramic Tableware Market Revenues & Volume By Materials for the Period 2021-2031
- Historical Data and Forecast of Tanzania Ceramic Tableware Market Revenues & Volume By China for the Period 2021-2031
- Historical Data and Forecast of Tanzania Ceramic Tableware Market Revenues & Volume By Stoneware for the Period 2021-2031
- Historical Data and Forecast of Tanzania Ceramic Tableware Market Revenues & Volume By Porcelain for the Period 2021-2031
- Historical Data and Forecast of Tanzania Ceramic Tableware Market Revenues & Volume By Others for the Period 2021-2031
- Historical Data and Forecast of Tanzania Ceramic Tableware Market Revenues & Volume By Applications for the Period 2021-2031
- Historical Data and Forecast of Tanzania Ceramic Tableware Market Revenues & Volume By Household Purpose for the Period 2021-2031
- Historical Data and Forecast of Tanzania Ceramic Tableware Market Revenues & Volume By Commercial Purpose for the Period 2021-2031
- Historical Data and Forecast of Tanzania Ceramic Tableware Market Revenues & Volume By Distribution Channels for the Period 2021-2031
- Historical Data and Forecast of Tanzania Ceramic Tableware Market Revenues & Volume By Online Channel for the Period 2021-2031
- Historical Data and Forecast of Tanzania Ceramic Tableware Market Revenues & Volume By Offline Channel for the Period 2021-2031
- Tanzania Ceramic Tableware Import Export Trade Statistics
- Market Opportunity Assessment By Products
- Market Opportunity Assessment By Materials
- Market Opportunity Assessment By Applications
- Market Opportunity Assessment By Distribution Channels
- Tanzania Ceramic Tableware Top Companies Market Share
- Tanzania Ceramic Tableware Competitive Benchmarking By Technical and Operational Parameters
- Tanzania Ceramic Tableware Company Profiles
- Tanzania Ceramic Tableware Key Strategic Recommendations
Frequently Asked Questions About the Market Study (FAQs):
6Wresearch actively monitors the Tanzania Ceramic Tableware Market and publishes its comprehensive annual report, highlighting emerging trends, growth drivers, revenue analysis, and forecast outlook. Our insights help businesses to make data-backed strategic decisions with ongoing market dynamics. Our analysts track relevent industries related to the Tanzania Ceramic Tableware Market, allowing our clients with actionable intelligence and reliable forecasts tailored to emerging regional needs.
Yes, we provide customisation as per your requirements. To learn more, feel free to contact us on sales@6wresearch.com
1 Executive Summary |
2 Introduction |
2.1 Key Highlights of the Report |
2.2 Report Description |
2.3 Market Scope & Segmentation |
2.4 Research Methodology |
2.5 Assumptions |
3 Tanzania Ceramic Tableware Market Overview |
3.1 Tanzania Country Macro Economic Indicators |
3.2 Tanzania Ceramic Tableware Market Revenues & Volume, 2021 & 2031F |
3.3 Tanzania Ceramic Tableware Market - Industry Life Cycle |
3.4 Tanzania Ceramic Tableware Market - Porter's Five Forces |
3.5 Tanzania Ceramic Tableware Market Revenues & Volume Share, By Products, 2021 & 2031F |
3.6 Tanzania Ceramic Tableware Market Revenues & Volume Share, By Materials, 2021 & 2031F |
3.7 Tanzania Ceramic Tableware Market Revenues & Volume Share, By Applications, 2021 & 2031F |
3.8 Tanzania Ceramic Tableware Market Revenues & Volume Share, By Distribution Channels, 2021 & 2031F |
4 Tanzania Ceramic Tableware Market Dynamics |
4.1 Impact Analysis |
4.2 Market Drivers |
4.3 Market Restraints |
5 Tanzania Ceramic Tableware Market Trends |
6 Tanzania Ceramic Tableware Market, By Types |
6.1 Tanzania Ceramic Tableware Market, By Products |
6.1.1 Overview and Analysis |
6.1.2 Tanzania Ceramic Tableware Market Revenues & Volume, By Products, 2021-2031F |
6.1.3 Tanzania Ceramic Tableware Market Revenues & Volume, By Ceramic Dinnerware, 2021-2031F |
6.1.4 Tanzania Ceramic Tableware Market Revenues & Volume, By Ceramic Beverageware, 2021-2031F |
6.1.5 Tanzania Ceramic Tableware Market Revenues & Volume, By Ceramic Flatware, 2021-2031F |
6.2 Tanzania Ceramic Tableware Market, By Materials |
6.2.1 Overview and Analysis |
6.2.2 Tanzania Ceramic Tableware Market Revenues & Volume, By China, 2021-2031F |
6.2.3 Tanzania Ceramic Tableware Market Revenues & Volume, By Stoneware, 2021-2031F |
6.2.4 Tanzania Ceramic Tableware Market Revenues & Volume, By Porcelain, 2021-2031F |
6.2.5 Tanzania Ceramic Tableware Market Revenues & Volume, By Others, 2021-2031F |
6.3 Tanzania Ceramic Tableware Market, By Applications |
6.3.1 Overview and Analysis |
6.3.2 Tanzania Ceramic Tableware Market Revenues & Volume, By Household Purpose, 2021-2031F |
6.3.3 Tanzania Ceramic Tableware Market Revenues & Volume, By Commercial Purpose, 2021-2031F |
6.4 Tanzania Ceramic Tableware Market, By Distribution Channels |
6.4.1 Overview and Analysis |
6.4.2 Tanzania Ceramic Tableware Market Revenues & Volume, By Online Channel, 2021-2031F |
6.4.3 Tanzania Ceramic Tableware Market Revenues & Volume, By Offline Channel, 2021-2031F |
7 Tanzania Ceramic Tableware Market Import-Export Trade Statistics |
7.1 Tanzania Ceramic Tableware Market Export to Major Countries |
7.2 Tanzania Ceramic Tableware Market Imports from Major Countries |
8 Tanzania Ceramic Tableware Market Key Performance Indicators |
9 Tanzania Ceramic Tableware Market - Opportunity Assessment |
9.1 Tanzania Ceramic Tableware Market Opportunity Assessment, By Products, 2021 & 2031F |
9.2 Tanzania Ceramic Tableware Market Opportunity Assessment, By Materials, 2021 & 2031F |
9.3 Tanzania Ceramic Tableware Market Opportunity Assessment, By Applications, 2021 & 2031F |
9.4 Tanzania Ceramic Tableware Market Opportunity Assessment, By Distribution Channels, 2021 & 2031F |
10 Tanzania Ceramic Tableware Market - Competitive Landscape |
10.1 Tanzania Ceramic Tableware Market Revenue Share, By Companies, 2024 |
10.2 Tanzania Ceramic Tableware Market Competitive Benchmarking, By Operating and Technical Parameters |
11 Company Profiles |
12 Recommendations |
13 Disclaimer |
Export potential assessment - trade Analytics for 2030
Export potential enables firms to identify high-growth global markets with greater confidence by combining advanced trade intelligence with a structured quantitative methodology. The framework analyzes emerging demand trends and country-level import patterns while integrating macroeconomic and trade datasets such as GDP and population forecasts, bilateral import–export flows, tariff structures, elasticity differentials between developed and developing economies, geographic distance, and import demand projections. Using weighted trade values from 2020–2024 as the base period to project country-to-country export potential for 2030, these inputs are operationalized through calculated drivers such as gravity model parameters, tariff impact factors, and projected GDP per-capita growth. Through an analysis of hidden potentials, demand hotspots, and market conditions that are most favorable to success, this method enables firms to focus on target countries, maximize returns, and global expansion with data, backed by accuracy.
By factoring in the projected importer demand gap that is currently unmet and could be potential opportunity, it identifies the potential for the Exporter (Country) among 190 countries, against the general trade analysis, which identifies the biggest importer or exporter.
To discover high-growth global markets and optimize your business strategy:
Click Here
Pricing
- Single User License$ 1,995
- Department License$ 2,400
- Site License$ 3,120
- Global License$ 3,795

Search
Thought Leadership and Analyst Meet


Our Clients
Latest Reports
- Philippines Polyhydroxybutyrate-co-Hydroxyvalerate Market (2026-2032) | Trends, Insights, Challenges, Restraints, Competition, Size, Value, Forecast, Pricing, Share, Outlook, Revenue, Investment Opportunities, Strategy, Drivers, Demand, Growth, segmentation, Analysis, Companies
- Peru Polyhydroxybutyrate-co-Hydroxyvalerate Market (2026-2032) | Growth, Demand, Challenges, Share, Trends, Analysis, Pricing, Investment Opportunities, Drivers, Value, Forecast, Competition, Size, Companies, Insights, Outlook, Restraints, segmentation, Revenue, Strategy
- Pakistan Polyhydroxybutyrate-co-Hydroxyvalerate Market (2026-2032) | Restraints, segmentation, Pricing, Forecast, Share, Strategy, Competition, Trends, Insights, Drivers, Challenges, Growth, Revenue, Outlook, Value, Investment Opportunities, Companies, Size, Analysis, Demand
- Oman Polyhydroxybutyrate-co-Hydroxyvalerate Market (2026-2032) | Drivers, segmentation, Insights, Competition, Pricing, Outlook, Size, Revenue, Challenges, Forecast, Analysis, Growth, Value, Share, Trends, Investment Opportunities, Strategy, Restraints, Companies, Demand
- Nigeria Polyhydroxybutyrate-co-Hydroxyvalerate Market (2026-2032) | Value, Investment Opportunities, Analysis, Revenue, Restraints, Pricing, Outlook, Competition, Demand, Growth, Forecast, Companies, Trends, Challenges, segmentation, Drivers, Insights, Share, Size, Strategy
- Nepal Polyhydroxybutyrate-co-Hydroxyvalerate Market (2026-2032) | Insights, Analysis, Drivers, Share, Revenue, Demand, segmentation, Investment Opportunities, Competition, Forecast, Growth, Pricing, Companies, Strategy, Trends, Restraints, Challenges, Outlook, Size, Value
- Myanmar Polyhydroxybutyrate-co-Hydroxyvalerate Market (2026-2032) | Outlook, Revenue, Strategy, Restraints, Drivers, segmentation, Share, Forecast, Competition, Insights, Growth, Pricing, Size, Demand, Value, Companies, Trends, Challenges, Investment Opportunities, Analysis
- Morocco Polyhydroxybutyrate-co-Hydroxyvalerate Market (2026-2032) | Outlook, Investment Opportunities, Restraints, Strategy, Forecast, Challenges, Drivers, Growth, Companies, segmentation, Trends, Size, Competition, Revenue, Demand, Insights, Share, Analysis, Value, Pricing
- Mexico Polyhydroxybutyrate-co-Hydroxyvalerate Market (2026-2032) | Size, Drivers, Outlook, Share, Strategy, Growth, Pricing, Challenges, Companies, Demand, Value, Investment Opportunities, Restraints, Trends, Forecast, segmentation, Analysis, Insights, Competition, Revenue
- Malaysia Polyhydroxybutyrate-co-Hydroxyvalerate Market (2026-2032) | Share, segmentation, Size, Companies, Analysis, Insights, Forecast, Value, Revenue, Drivers, Restraints, Challenges, Investment Opportunities, Trends, Competition, Strategy, Demand, Growth, Outlook, Pricing
Industry Events and Analyst Meet

HIMTEX 2026

India Refining Summit 2026

India EV Show 2026

EV tech India Expo 2026

Auto Tech Asia 2026
Whitepaper
- Middle East & Africa Commercial Security Market Click here to view more.
- Middle East & Africa Fire Safety Systems & Equipment Market Click here to view more.
- GCC Drone Market Click here to view more.
- Middle East Lighting Fixture Market Click here to view more.
- GCC Physical & Perimeter Security Market Click here to view more.
6WResearch In News
- Doha a strategic location for EV manufacturing hub: IPA Qatar
- Demand for luxury TVs surging in the GCC, says Samsung
- Empowering Growth: The Thriving Journey of Bangladesh’s Cable Industry
- Demand for luxury TVs surging in the GCC, says Samsung
- Video call with a traditional healer? Once unthinkable, it’s now common in South Africa
- Intelligent Buildings To Smooth GCC’s Path To Net Zero