Tanzania Chatbot Market Size & Growth Rate (2026-2032)
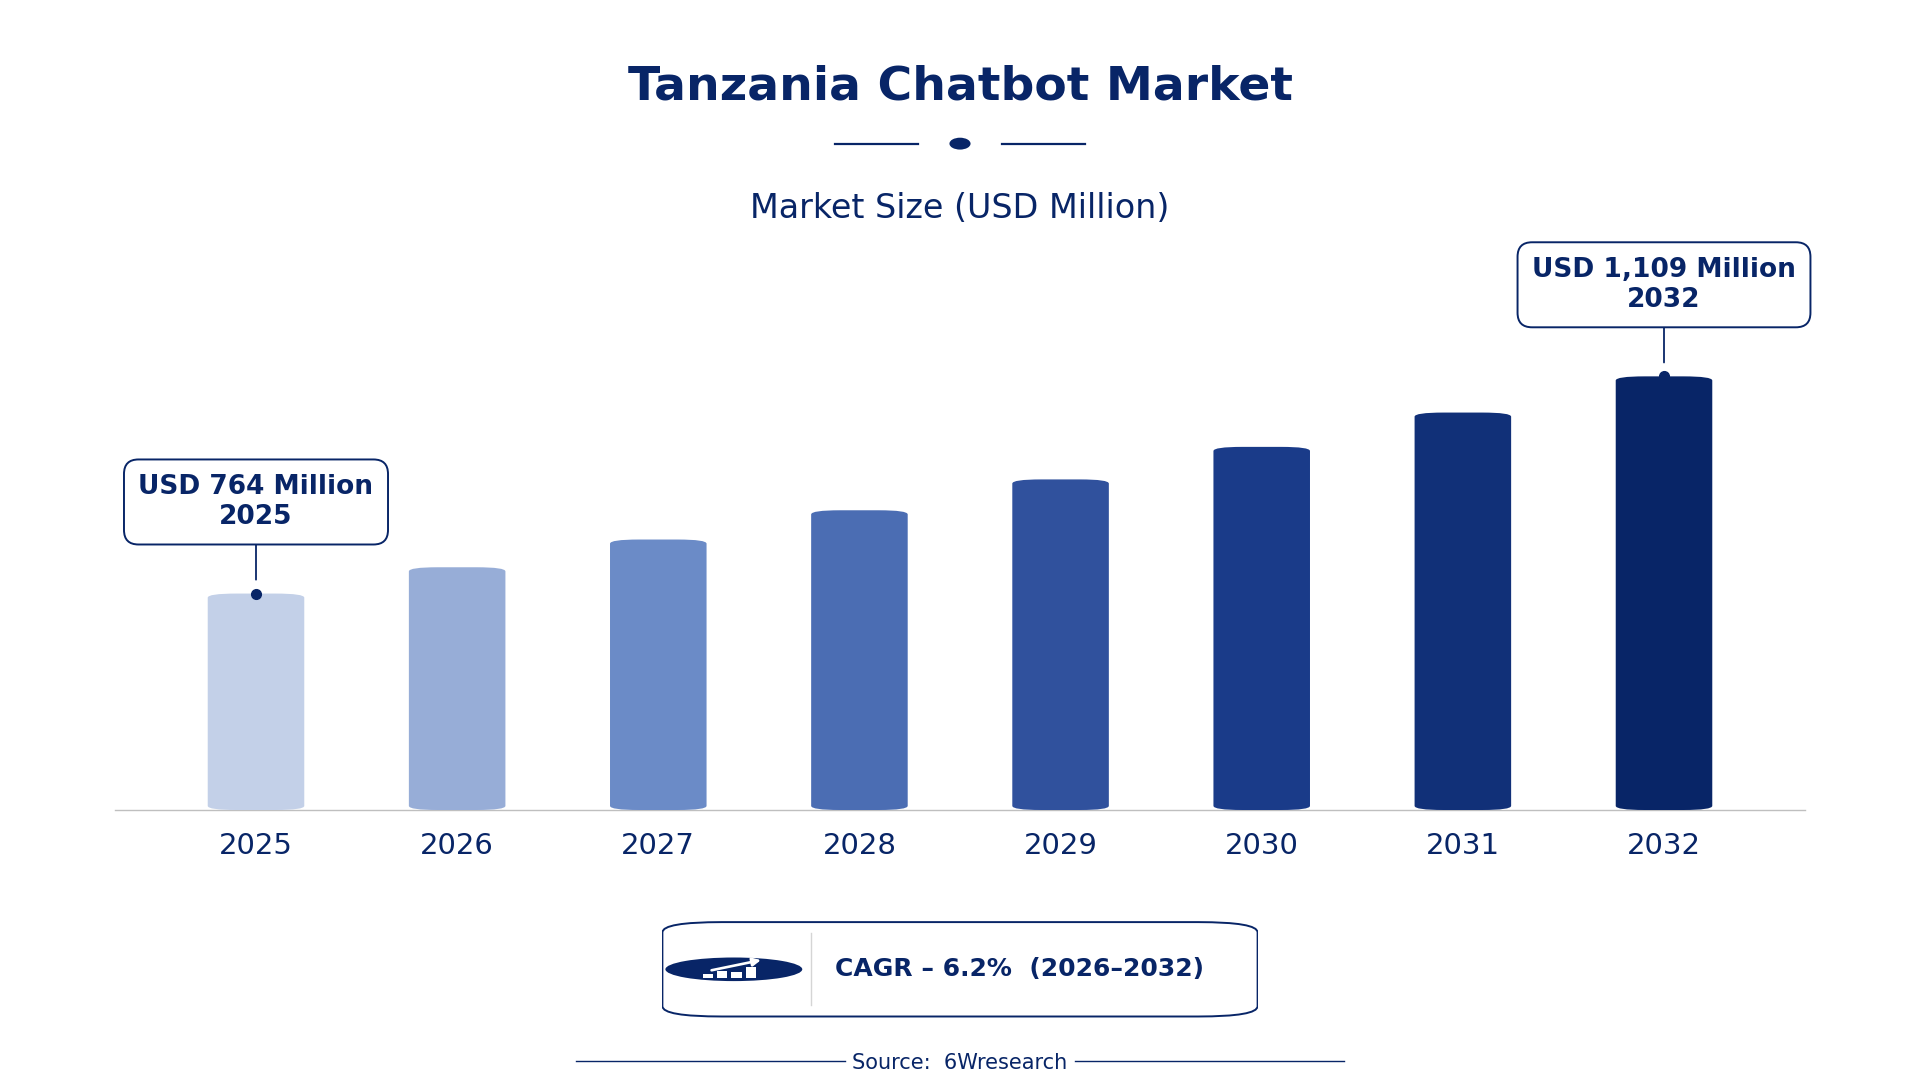
The Tanzania Chatbot Market was estimated at USD 764 Million in 2025 and is projected to reach USD 1109 Million by 2032, growing at a CAGR of 6.2% from 2026 to 2032.
Tanzania Chatbot Market Synopsis
The increasing adoption of digital technologies is reshaping the customer service landscape in Tanzania. Companies across various sectors, including banking and healthcare, are implementing chatbots to enhance customer interactions and operational efficiency.
As mobile internet usage climbs, businesses are leveraging chatbots to deliver personalized services that cater to the unique needs of Tanzanian consumers. This trend is prompting a competitive environment where both local and international providers are vying to meet market demand.
Tanzania Chatbot Market Year-wise Growth Rate and Key Drivers
This graph illustrates the annual growth rates of the Tanzania Chatbot Market from 2021 to 2032, highlighting a steady upward trajectory and projected expansion over the forecast period.
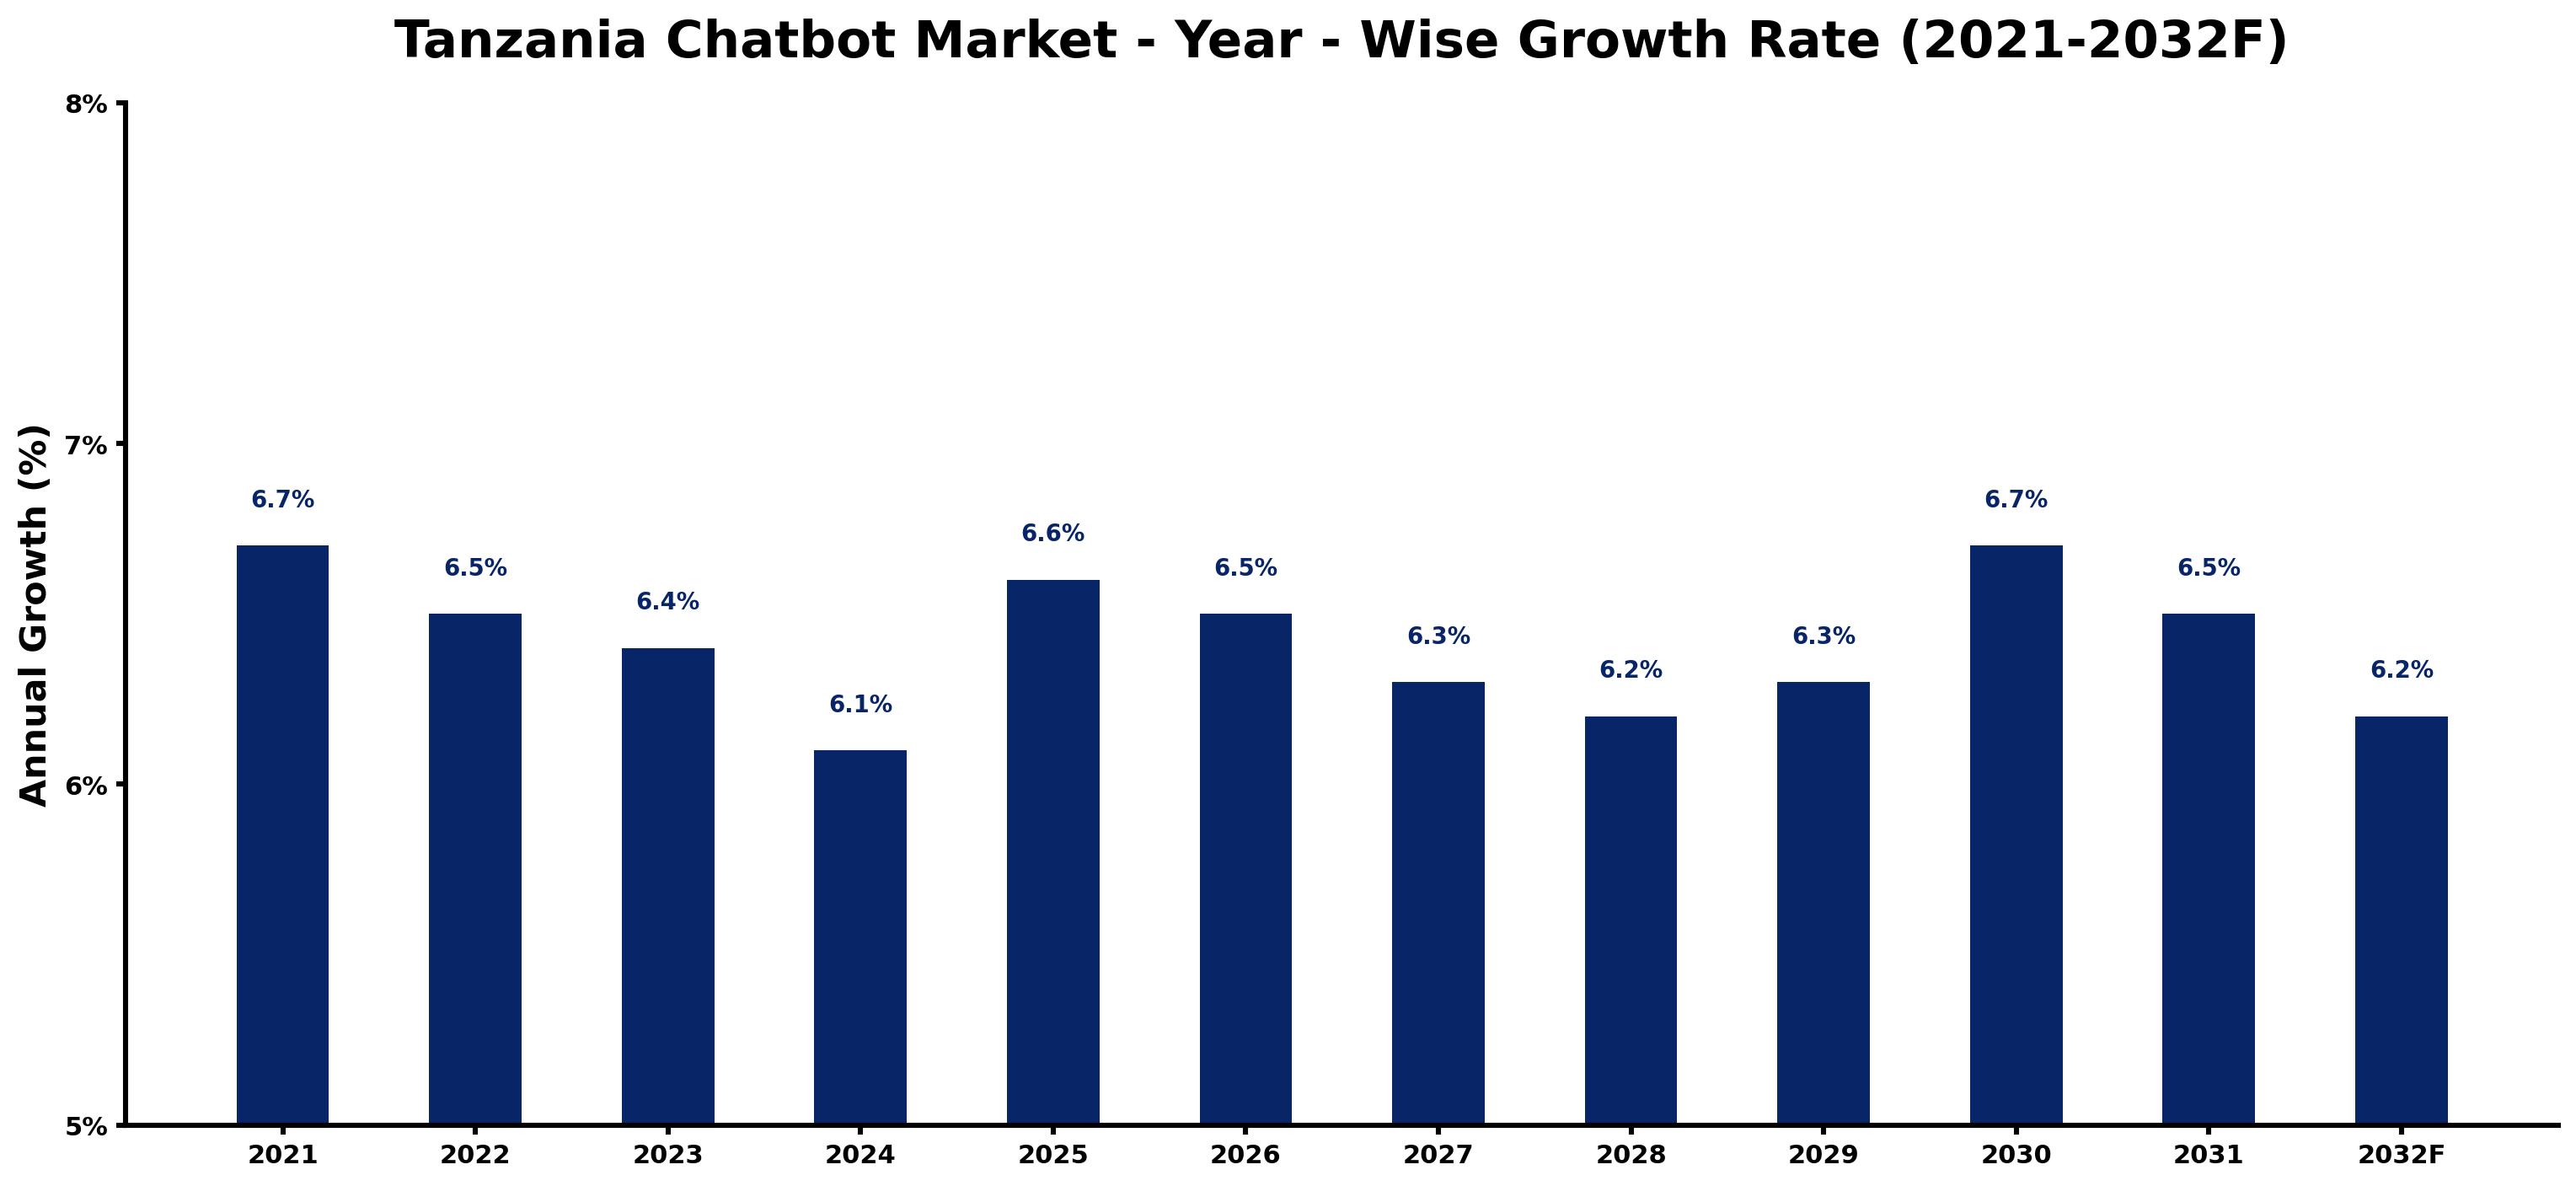
The table below presents the year‑wise growth rates along with the key drivers influencing the market
| Year | Growth Rate | Major Drivers |
| 2021 | 6.7% | National ICT policy encouraging innovation and digital tools. |
| 2022 | 6.5% | Rise of e-commerce driving need for responsive chat solutions. |
| 2023 | 6.4% | Corporate investment in customer engagement technology increases. |
| 2024 | 6.1% | Increased internet accessibility fuels chatbot adoption. |
| 2025 | 6.6% | Regulatory support for fintech solutions spurs chatbot development. |
| 2026 | 6.5% | Local startups focused on AI chatbots gain traction. |
| 2027 | 6.3% | Demand for multilingual support enhances chatbot capabilities. |
| 2028 | 6.2% | Increased awareness of AI benefits among businesses. |
| 2029 | 6.3% | Growing urbanization leads to higher customer service expectations. |
| 2030 | 6.7% | Corporate training programs emphasize AI and automation tools. |
| 2031 | 6.5% | Rising competition in retail sector boosts AI usage. |
| 2032 | 6.2% | Investment in mobile technology spurs chatbot enhancements. |
Note: Market size estimations and growth projections presented in this report are based on 6Wresearch's proprietary forecasting methodology, utilizing the latest available industry data, government publications, and primary research inputs.
Tanzania Chatbot Market Key Takeaways
Below are some of the specific key takeaways from the market, including:
- The market is seeing growth driven by the rise in digital technology adoption.
- Integration of chatbots with popular messaging platforms is becoming increasingly common.
- There is a noticeable shift towards conversational AI-driven user experiences.
- Industries such as e-commerce and telecommunications are investing heavily in chatbot solutions.
- Government initiatives are fostering an environment conducive to technological innovation.
Evaluation of Restraints in Tanzania Chatbot Market
Despite its growth potential, the Tanzania chatbot market faces significant barriers. Limited internet access, especially in rural regions, hampers widespread chatbot adoption. Additionally, the country's linguistic diversity presents challenges in developing effective chatbot communication tailored to local languages.
Concerns around data privacy and security further complicate market trust. Many consumers and businesses remain unaware of how chatbots can enhance service delivery, resulting in a hesitancy to implement these technologies.
Tanzania Chatbot Market Trends
Several trends are shaping the Tanzania chatbot market. The integration with messaging platforms like WhatsApp and Facebook Messenger is gaining traction, allowing businesses to reach consumers where they are most active. on top of that, there’s a growing focus on creating personalized chatbot experiences that foster deeper customer engagement.
The application of chatbots is expanding beyond customer support into sales and marketing realms, reflecting a shift towards automation in business operations. Companies are increasingly recognizing the efficiency gains and cost savings that chatbot solutions can deliver.
Tanzania Chatbot Market Opportunities
There are ample opportunities for growth in the Tanzania chatbot market. Industries such as banking, e-commerce, and healthcare present fertile ground for chatbot integration, enabling companies to streamline operations and enhance customer service.
The tech-savvy population of Tanzania is driving demand for real-time, personalized interactions, pushing businesses to adopt innovative chatbot solutions. Additionally, small and medium enterprises are increasingly looking to harness chatbots to improve operational efficiency and customer engagement.
Government Initiatives in the Tanzania Chatbot Market
Government policy in Tanzania is increasingly supportive of digital transformation initiatives, which directly influences the chatbot market. The government's focus on fostering technological innovation and entrepreneurship is crucial in creating a conducive environment for growth. Strengthening data privacy regulations also plays a key role in building trust among users.
- A national digital economy strategy launched in late 2025 aims to enhance technology adoption across sectors.
- Current initiatives include a nationwide digital infrastructure upgrade to improve internet access in underserved areas.
- Recent policies emphasize the importance of local talent development in emerging technologies, benefiting the chatbot sector.
- A regulatory framework focused on data privacy and cybersecurity is currently being strengthened to protect consumer information.
- Upcoming public-private partnerships are expected to expand access to digital services, including chatbot applications, by 2028.
Future Insights of the Tanzania Chatbot Market
Looking ahead to 2026-2032, the Tanzania chatbot market is set for significant advancement. As businesses recognize the value of AI-powered chatbots in enhancing customer engagement and operational efficiency, adoption rates will likely accelerate. The ongoing improvements in internet and smartphone penetration will further drive demand for these technologies.
With the government’s commitment to digital transformation, the market will see a plethora of opportunities for innovation. This combination of factors positions the Tanzania chatbot market for sustained growth and development in the coming years.
Tanzania Chatbot Market Latest Developments
Recent activity in the Tanzania chatbot market reflects a surge in innovation and adoption. Over the past year, various sectors have shown increased interest in chatbot solutions as a means to enhance customer interactions and streamline processes.
- A leading regional operator launched a new chatbot service in Q1 2025 aimed at improving customer support in the telecommunications sector.
- An ongoing initiative by a major technology vendor focuses on integrating AI-driven chatbots with local e-commerce platforms, enhancing user experience.
- A planned rollout of chatbot training programs for small businesses is expected to commence in early 2026, aimed at boosting local capabilities.
- In late 2025, a significant partnership was formed between local banks and tech companies to develop financial chatbots for improved customer service.
- A chatbot technology upgrade initiative, currently in progress, is set to enhance language capabilities to better serve diverse Tanzanian users.
Tanzania Chatbot Market - Key Attractiveness of the Report
- 10 Years of Market Numbers
- Historical Data Starting from 2022 to 2025
- Base Year: 2025
- Forecast Data until 2032
- Key Performance Indicators Impacting the Market
- Major Upcoming Developments and Projects
Key Highlights of the Report:
- Tanzania Chatbot Market Outlook
- Market Size of Tanzania Chatbot Market, 2025
- Forecast of Tanzania Chatbot Market, 2032
- Historical Data and Forecast of Tanzania Chatbot Revenues & Volume for the Period 2022-2032F
- Tanzania Chatbot Market Trend Evolution
- Tanzania Chatbot Market Drivers and Challenges
- Tanzania Chatbot Price Trends
- Tanzania Chatbot Porter's Five Forces
- Tanzania Chatbot Industry Life Cycle
- Historical Data and Forecast of Tanzania Chatbot Market Revenues & Volume By Component for the Period 2022-2032F
- Historical Data and Forecast of Tanzania Chatbot Market Revenues & Volume By Solutions for the Period 2022-2032F
- Historical Data and Forecast of Tanzania Chatbot Market Revenues & Volume By Services for the Period 2022-2032F
- Historical Data and Forecast of Tanzania Chatbot Market Revenues & Volume By Type for the Period 2022-2032F
- Historical Data and Forecast of Tanzania Chatbot Market Revenues & Volume By Rule Based for the Period 2022-2032F
- Historical Data and Forecast of Tanzania Chatbot Market Revenues & Volume By AI Based for the Period 2022-2032F
- Historical Data and Forecast of Tanzania Chatbot Market Revenues & Volume By Deployment Mode for the Period 2022-2032F
- Historical Data and Forecast of Tanzania Chatbot Market Revenues & Volume By On-premises for the Period 2022-2032F
- Historical Data and Forecast of Tanzania Chatbot Market Revenues & Volume By Cloud for the Period 2022-2032F
- Historical Data and Forecast of Tanzania Chatbot Market Revenues & Volume By Channel Integration for the Period 2022-2032F
- Historical Data and Forecast of Tanzania Chatbot Market Revenues & Volume By Websites for the Period 2022-2032F
- Historical Data and Forecast of Tanzania Chatbot Market Revenues & Volume By Contact Centers for the Period 2022-2032F
- Historical Data and Forecast of Tanzania Chatbot Market Revenues & Volume By Social Media for the Period 2022-2032F
- Historical Data and Forecast of Tanzania Chatbot Market Revenues & Volume By Mobile Applications for the Period 2022-2032F
- Historical Data and Forecast of Tanzania Chatbot Market Revenues & Volume By Organization Size for the Period 2022-2032F
- Historical Data and Forecast of Tanzania Chatbot Market Revenues & Volume By Large Enterprises for the Period 2022-2032F
- Historical Data and Forecast of Tanzania Chatbot Market Revenues & Volume By SMEs for the Period 2022-2032F
- Historical Data and Forecast of Tanzania Chatbot Market Revenues & Volume By Business Function for the Period 2022-2032F
- Historical Data and Forecast of Tanzania Chatbot Market Revenues & Volume By Information Technology Service Management for the Period 2022-2032F
- Historical Data and Forecast of Tanzania Chatbot Market Revenues & Volume By Human Resources for the Period 2022-2032F
- Historical Data and Forecast of Tanzania Chatbot Market Revenues & Volume By Sales and Marketing for the Period 2022-2032F
- Historical Data and Forecast of Tanzania Chatbot Market Revenues & Volume By Finance for the Period 2022-2032F
- Historical Data and Forecast of Tanzania Chatbot Market Revenues & Volume By Application for the Period 2022-2032F
- Historical Data and Forecast of Tanzania Chatbot Market Revenues & Volume By Customer Service for the Period 2022-2032F
- Historical Data and Forecast of Tanzania Chatbot Market Revenues & Volume By Personal Assistant for the Period 2022-2032F
- Historical Data and Forecast of Tanzania Chatbot Market Revenues & Volume By Branding and Advertisement for the Period 2022-2032F
- Historical Data and Forecast of Tanzania Chatbot Market Revenues & Volume By Customer Engagement and Retention for the Period 2022-2032F
- Historical Data and Forecast of Tanzania Chatbot Market Revenues & Volume By Data Privacy and Compliance for the Period 2022-2032F
- Historical Data and Forecast of Tanzania Chatbot Market Revenues & Volume By Employee Engagement and On Boarding for the Period 2022-2032F
- Historical Data and Forecast of Tanzania Chatbot Market Revenues & Volume By Payment Processing for the Period 2022-2032F
- Historical Data and Forecast of Tanzania Chatbot Market Revenues & Volume By Others for the Period 2022-2032F
- Historical Data and Forecast of Tanzania Chatbot Market Revenues & Volume By Vertical for the Period 2022-2032F
- Historical Data and Forecast of Tanzania Chatbot Market Revenues & Volume By BFSI for the Period 2022-2032F
- Historical Data and Forecast of Tanzania Chatbot Market Revenues & Volume By IT and Telecom for the Period 2022-2032F
- Historical Data and Forecast of Tanzania Chatbot Market Revenues & Volume By Retail and Ecommerce for the Period 2022-2032F
- Historical Data and Forecast of Tanzania Chatbot Market Revenues & Volume By Healthcare and Life Sciences for the Period 2022-2032F
- Historical Data and Forecast of Tanzania Chatbot Market Revenues & Volume By Transportation and Logistics for the Period 2022-2032F
- Historical Data and Forecast of Tanzania Chatbot Market Revenues & Volume By Government for the Period 2022-2032F
- Historical Data and Forecast of Tanzania Chatbot Market Revenues & Volume By Travel and Hospitality for the Period 2022-2032F
- Historical Data and Forecast of Tanzania Chatbot Market Revenues & Volume By Media and Entertainment for the Period 2022-2032F
- Tanzania Chatbot Import Export Trade Statistics
- Market Opportunity Assessment By Component
- Market Opportunity Assessment By Type
- Market Opportunity Assessment By Deployment Mode
- Market Opportunity Assessment By Channel Integration
- Market Opportunity Assessment By Organization Size
- Market Opportunity Assessment By Business Function
- Market Opportunity Assessment By Application
- Market Opportunity Assessment By Vertical
- Tanzania Chatbot Top Companies Market Share
- Tanzania Chatbot Competitive Benchmarking By Technical and Operational Parameters
- Tanzania Chatbot Company Profiles
- Tanzania Chatbot Key Strategic Recommendations






































