Tanzania Milk Replacers Market (2025-2031) Outlook | Value, Forecast, Share, Companies, Industry, Revenue, Size, Analysis, Trends & Growth
Market Forecast By Type (Medicated, Non-Medicated), By Livestock (Ruminants, Swine), By Source (Milk-based, Non milk-based, Blended) And Competitive Landscape
| Product Code: ETC4596596 | Publication Date: Jul 2023 | Updated Date: Nov 2025 | Product Type: Report | |
| Publisher: 6Wresearch | Author: Summon Dutta | No. of Pages: 85 | No. of Figures: 45 | No. of Tables: 25 |
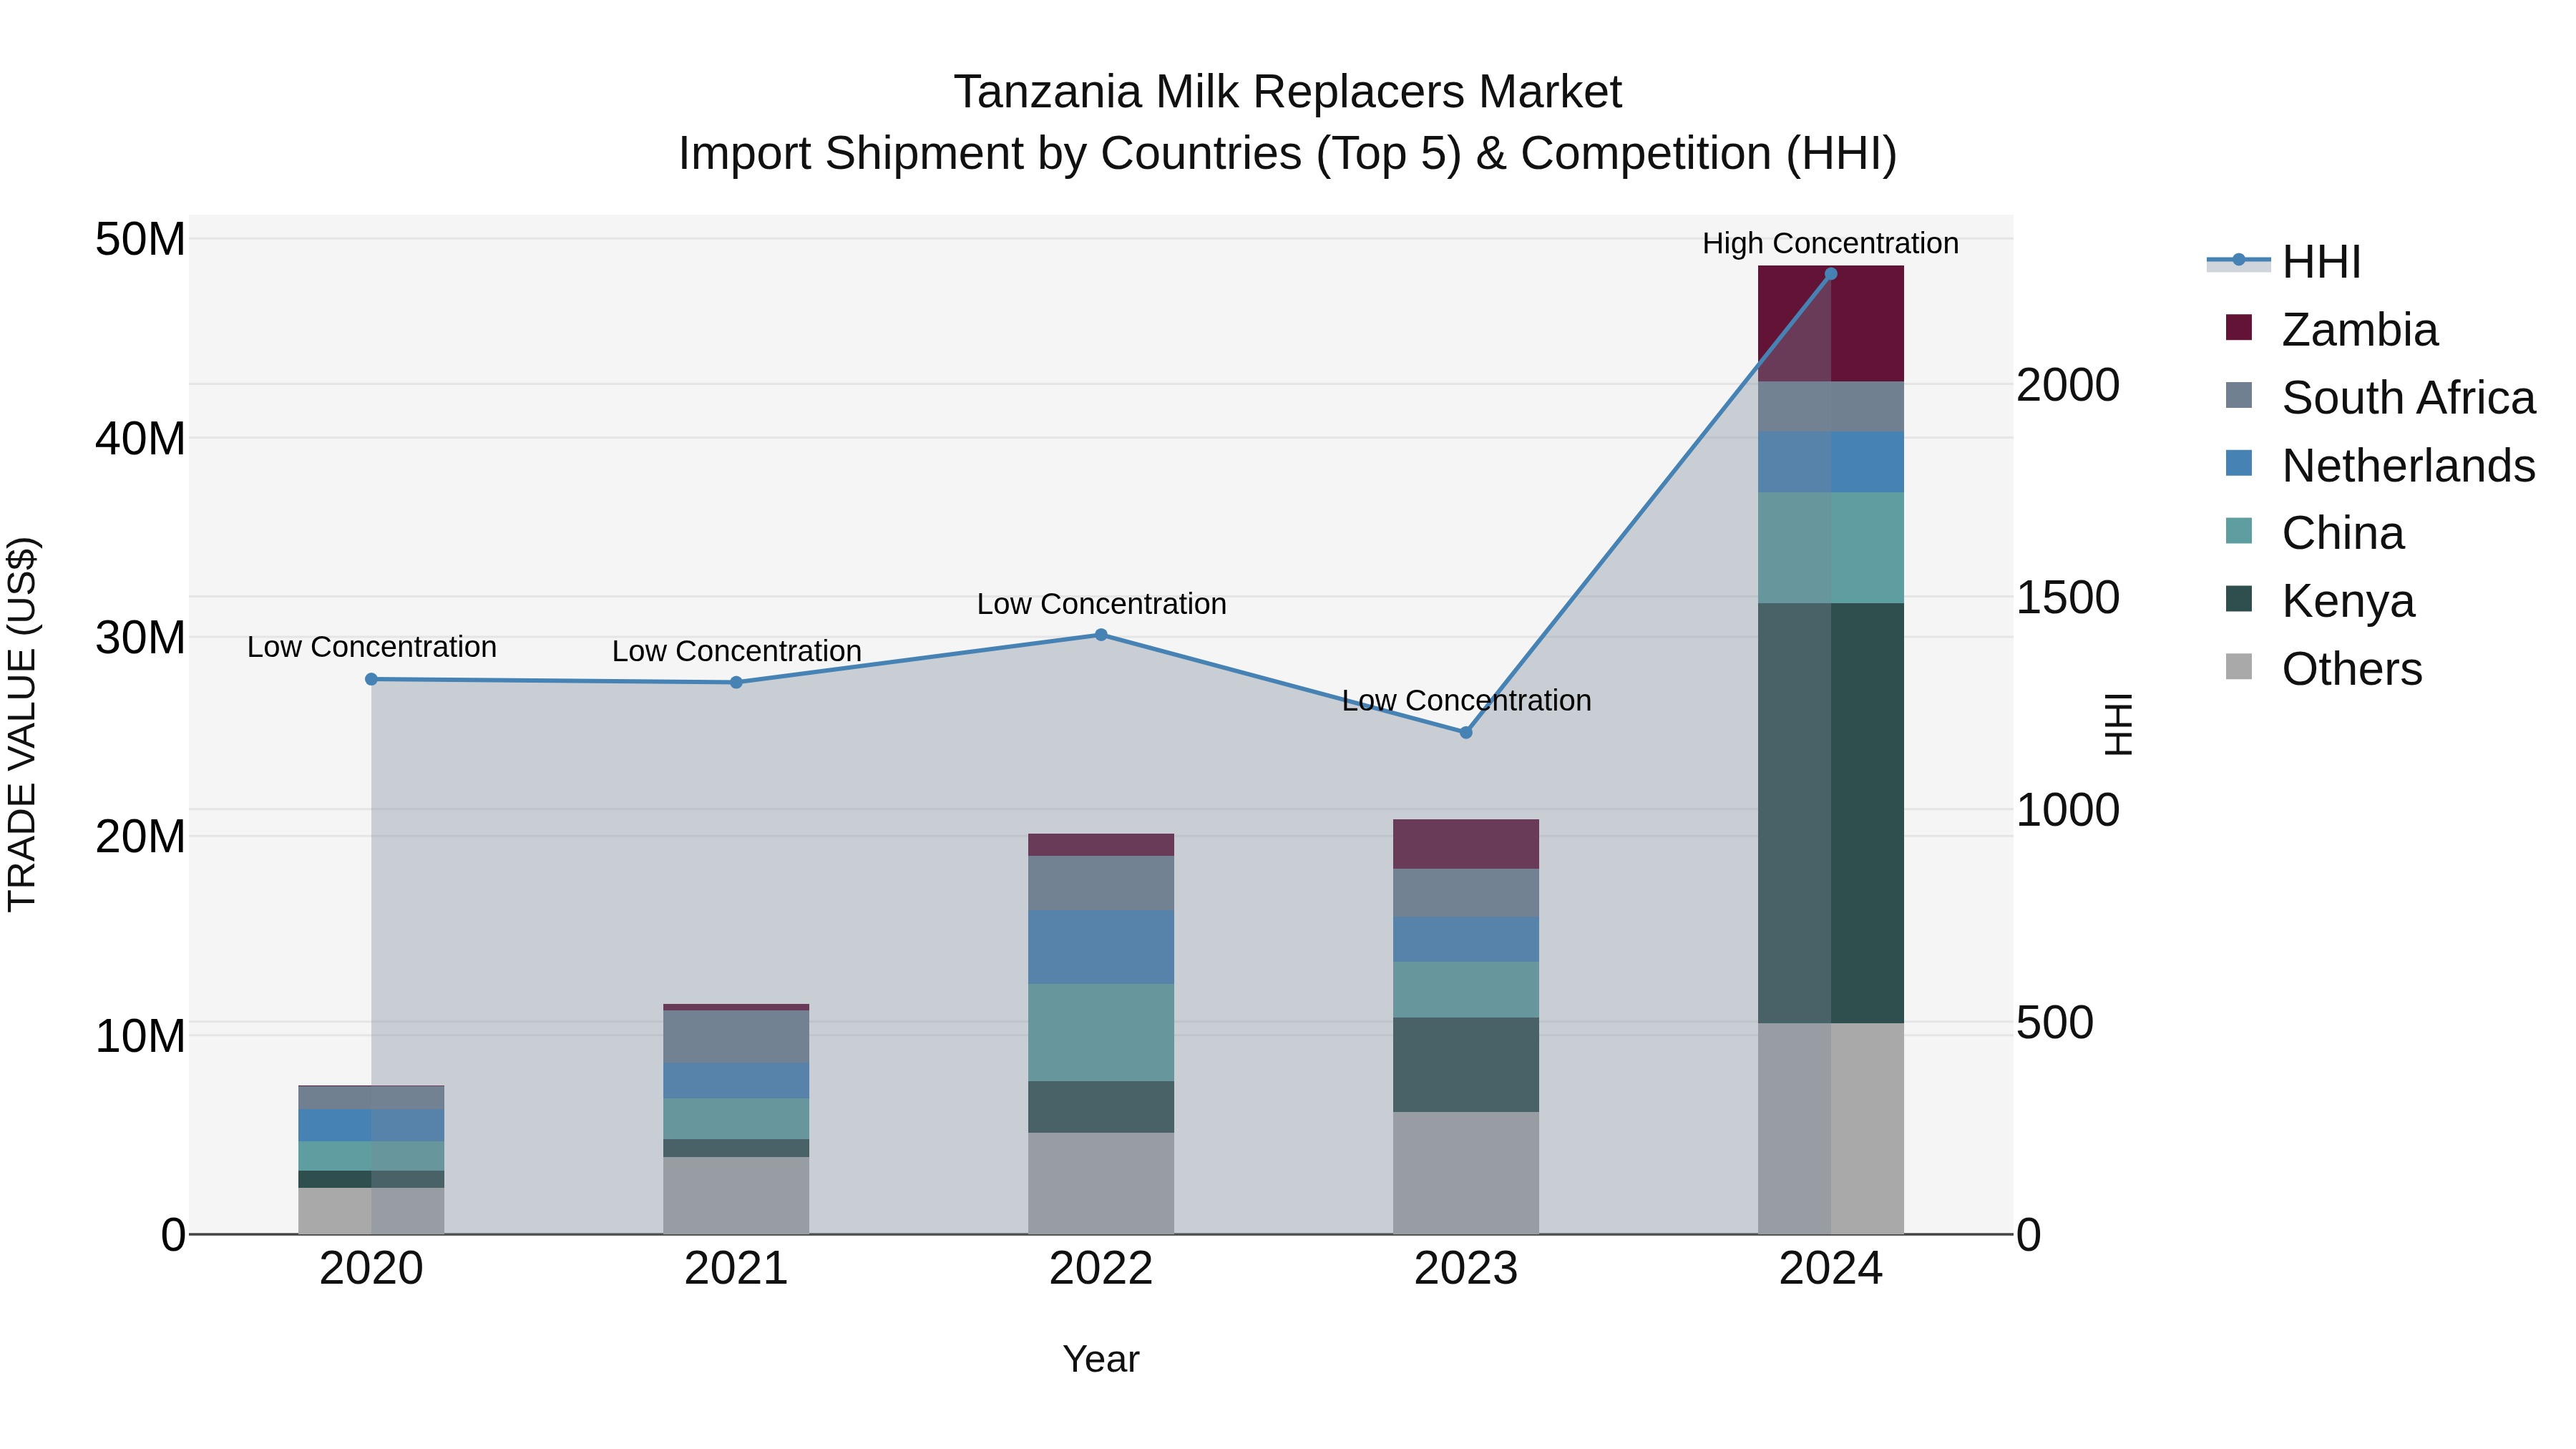
Tanzania Milk Replacers Market: Top 5 Importing Countries and Market Competition (HHI) Analysis
The import shipments of milk replacers to Tanzania have shown significant growth in 2024, with top exporting countries being Kenya, Zambia, China, Netherlands, and South Africa. The market concentration, as measured by the HHI, has transitioned from low to high in just one year, indicating increasing dominance of key players. The impressive compound annual growth rate (CAGR) of 59.73% from 2020 to 2024 and a remarkable growth rate of 133.58% in 2024 alone highlight the expanding demand for milk replacers in the Tanzanian market. This trend suggests a lucrative opportunity for market players to capitalize on the growing demand in the region.
Tanzania Milk Replacers Market Overview
The Tanzania Milk Replacers Market provides alternatives to natural milk for feeding young livestock. These products are essential for ensuring the healthy growth and development of animals. The market is driven by the need for consistent and high-quality nutrition, the challenges of natural milk supply, and advancements in formulation technologies.
Drivers of the market
The Tanzania milk replacers market is driven by the increasing need for cost-effective and nutritionally balanced alternatives to whole milk for animal rearing. Milk replacers are commonly used in the livestock industry to ensure the healthy growth of young animals. Advancements in formulation and the rising focus on animal health and productivity drive market demand.
Challenges of the market
The milk replacers market in Tanzania struggles with issues related to production costs and the availability of raw materials. Producing high-quality milk replacers requires advanced technology and a consistent supply of ingredients, which are limited locally. Importing these ingredients is expensive and subject to supply chain disruptions. There are also challenges related to ensuring the nutritional quality and safety of milk replacers. Additionally, competition from imported products and the need to educate consumers about the benefits of milk replacers further complicate the market.
Government Policy of the market
To support the livestock industry, the government is promoting the use of milk replacers. Policies include research grants for developing high-quality milk replacers and subsidies to make these products more affordable for farmers.
Key Highlights of the Report:
- Tanzania Milk Replacers Market Outlook
- Market Size of Tanzania Milk Replacers Market, 2024
- Forecast of Tanzania Milk Replacers Market, 2031
- Historical Data and Forecast of Tanzania Milk Replacers Revenues & Volume for the Period 2021-2031
- Tanzania Milk Replacers Market Trend Evolution
- Tanzania Milk Replacers Market Drivers and Challenges
- Tanzania Milk Replacers Price Trends
- Tanzania Milk Replacers Porter's Five Forces
- Tanzania Milk Replacers Industry Life Cycle
- Historical Data and Forecast of Tanzania Milk Replacers Market Revenues & Volume By Type for the Period 2021-2031
- Historical Data and Forecast of Tanzania Milk Replacers Market Revenues & Volume By Medicated for the Period 2021-2031
- Historical Data and Forecast of Tanzania Milk Replacers Market Revenues & Volume By Non-Medicated for the Period 2021-2031
- Historical Data and Forecast of Tanzania Milk Replacers Market Revenues & Volume By Livestock for the Period 2021-2031
- Historical Data and Forecast of Tanzania Milk Replacers Market Revenues & Volume By Ruminants for the Period 2021-2031
- Historical Data and Forecast of Tanzania Milk Replacers Market Revenues & Volume By Swine for the Period 2021-2031
- Historical Data and Forecast of Tanzania Milk Replacers Market Revenues & Volume By Source for the Period 2021-2031
- Historical Data and Forecast of Tanzania Milk Replacers Market Revenues & Volume By Milk-based for the Period 2021-2031
- Historical Data and Forecast of Tanzania Milk Replacers Market Revenues & Volume By Non milk-based for the Period 2021-2031
- Historical Data and Forecast of Tanzania Milk Replacers Market Revenues & Volume By Blended for the Period 2021-2031
- Tanzania Milk Replacers Import Export Trade Statistics
- Market Opportunity Assessment By Type
- Market Opportunity Assessment By Livestock
- Market Opportunity Assessment By Source
- Tanzania Milk Replacers Top Companies Market Share
- Tanzania Milk Replacers Competitive Benchmarking By Technical and Operational Parameters
- Tanzania Milk Replacers Company Profiles
- Tanzania Milk Replacers Key Strategic Recommendations
What are the key factors driving growth in the Tanzania milk replacers market?
The increasing adoption of dairy farming practices by small-scale farmers and the rising demand for high-quality milk replacers, such as those offered by companies like Biomin and Trouw Nutrition, are significant contributors to the market's growth.
The Tanzania milk replacers market is expected to witness steady growth in the coming years, driven by increasing adoption of products like Nestle's Beba milk replacer and Promasidor's Loya milk. Rising consumer awareness about nutritional benefits and the focus on improving livestock productivity are key factors shaping the future direction of this market.
Consumers in Tanzania are increasingly seeking milk replacer products that are organic and free from artificial additives. Companies like Azam Dairy are responding to this trend by introducing organic milk replacers made from locally sourced ingredients. Additionally, there is a growing demand for lactose-free options, with brands like Juhayna launching lactose-free milk replacers to cater to this consumer segment.
The Tanzania milk replacers market encompasses various products such as powdered milk substitutes for calves, lambs, and piglets, along with liquid formulations from companies like Milkivit and Trouw Nutrition. This market caters to livestock farmers seeking high-quality nutritional alternatives to natural milk for young animals, playing a crucial role in ensuring proper growth and health of livestock in the region.
Customer preferences in the Tanzania milk replacers market are increasingly leaning towards products that offer organic and natural ingredients, such as those offered by local brands like Dairy Fresh Tanzania. Consumers are also showing a preference for milk replacers that cater to specific dietary requirements, such as lactose-free options like those provided by Nutra-Lac. Additionally, there is a growing demand for milk replacers fortified with vitamins and minerals to enhance nutritional benefits, reflecting a shift towards healthier alternatives among Tanzanian consumers.
6Wresearch actively monitors the Tanzania Milk Replacers Market and publishes its comprehensive annual report, highlighting emerging trends, growth drivers, revenue analysis, and forecast outlook. Our insights help businesses to make data-backed strategic decisions with ongoing market dynamics. Our analysts track relevent industries related to the Tanzania Milk Replacers Market, allowing our clients with actionable intelligence and reliable forecasts tailored to emerging regional needs.
Yes, we provide customisation as per your requirements. To learn more, feel free to contact us on sales@6wresearch.com
1 Executive Summary |
2 Introduction |
2.1 Key Highlights of the Report |
2.2 Report Description |
2.3 Market Scope & Segmentation |
2.4 Research Methodology |
2.5 Assumptions |
3 Tanzania Milk Replacers Market Overview |
3.1 Tanzania Country Macro Economic Indicators |
3.2 Tanzania Milk Replacers Market Revenues & Volume, 2021 & 2031F |
3.3 Tanzania Milk Replacers Market - Industry Life Cycle |
3.4 Tanzania Milk Replacers Market - Porter's Five Forces |
3.5 Tanzania Milk Replacers Market Revenues & Volume Share, By Type, 2021 & 2031F |
3.6 Tanzania Milk Replacers Market Revenues & Volume Share, By Livestock, 2021 & 2031F |
3.7 Tanzania Milk Replacers Market Revenues & Volume Share, By Source, 2021 & 2031F |
4 Tanzania Milk Replacers Market Dynamics |
4.1 Impact Analysis |
4.2 Market Drivers |
4.2.1 Increasing awareness of the nutritional benefits of milk replacers |
4.2.2 Growth in the livestock farming industry in Tanzania |
4.2.3 Rising demand for dairy products in the region |
4.3 Market Restraints |
4.3.1 Fluctuating prices of raw materials used in milk replacers |
4.3.2 Lack of proper infrastructure for distribution and storage |
4.3.3 Competition from traditional milk products |
5 Tanzania Milk Replacers Market Trends |
6 Tanzania Milk Replacers Market, By Types |
6.1 Tanzania Milk Replacers Market, By Type |
6.1.1 Overview and Analysis |
6.1.2 Tanzania Milk Replacers Market Revenues & Volume, By Type, 2021-2031F |
6.1.3 Tanzania Milk Replacers Market Revenues & Volume, By Medicated, 2021-2031F |
6.1.4 Tanzania Milk Replacers Market Revenues & Volume, By Non-Medicated, 2021-2031F |
6.2 Tanzania Milk Replacers Market, By Livestock |
6.2.1 Overview and Analysis |
6.2.2 Tanzania Milk Replacers Market Revenues & Volume, By Ruminants, 2021-2031F |
6.2.3 Tanzania Milk Replacers Market Revenues & Volume, By Swine, 2021-2031F |
6.3 Tanzania Milk Replacers Market, By Source |
6.3.1 Overview and Analysis |
6.3.2 Tanzania Milk Replacers Market Revenues & Volume, By Milk-based, 2021-2031F |
6.3.3 Tanzania Milk Replacers Market Revenues & Volume, By Non milk-based, 2021-2031F |
6.3.4 Tanzania Milk Replacers Market Revenues & Volume, By Blended, 2021-2031F |
7 Tanzania Milk Replacers Market Import-Export Trade Statistics |
7.1 Tanzania Milk Replacers Market Export to Major Countries |
7.2 Tanzania Milk Replacers Market Imports from Major Countries |
8 Tanzania Milk Replacers Market Key Performance Indicators |
8.1 Adoption rate of milk replacers by livestock farmers |
8.2 Percentage of increase in dairy product consumption in Tanzania |
8.3 Number of new product innovations in the milk replacers market |
9 Tanzania Milk Replacers Market - Opportunity Assessment |
9.1 Tanzania Milk Replacers Market Opportunity Assessment, By Type, 2021 & 2031F |
9.2 Tanzania Milk Replacers Market Opportunity Assessment, By Livestock, 2021 & 2031F |
9.3 Tanzania Milk Replacers Market Opportunity Assessment, By Source, 2021 & 2031F |
10 Tanzania Milk Replacers Market - Competitive Landscape |
10.1 Tanzania Milk Replacers Market Revenue Share, By Companies, 2024 |
10.2 Tanzania Milk Replacers Market Competitive Benchmarking, By Operating and Technical Parameters |
11 Company Profiles |
12 Recommendations |
13 Disclaimer |
Export potential assessment - trade Analytics for 2030
Export potential enables firms to identify high-growth global markets with greater confidence by combining advanced trade intelligence with a structured quantitative methodology. The framework analyzes emerging demand trends and country-level import patterns while integrating macroeconomic and trade datasets such as GDP and population forecasts, bilateral import–export flows, tariff structures, elasticity differentials between developed and developing economies, geographic distance, and import demand projections. Using weighted trade values from 2020–2024 as the base period to project country-to-country export potential for 2030, these inputs are operationalized through calculated drivers such as gravity model parameters, tariff impact factors, and projected GDP per-capita growth. Through an analysis of hidden potentials, demand hotspots, and market conditions that are most favorable to success, this method enables firms to focus on target countries, maximize returns, and global expansion with data, backed by accuracy.
By factoring in the projected importer demand gap that is currently unmet and could be potential opportunity, it identifies the potential for the Exporter (Country) among 190 countries, against the general trade analysis, which identifies the biggest importer or exporter.
To discover high-growth global markets and optimize your business strategy:
Click Here
Pricing
- Single User License$ 1,995
- Department License$ 2,400
- Site License$ 3,120
- Global License$ 3,795

Search
Thought Leadership and Analyst Meet


Our Clients
Latest Reports
- India Ultrasonic Smart Water Meter Market (2026-2032) | Outlook, Competition, Drivers, Trends, Demand, Competitive, Strategic Insights, Companies, Challenges, Strategy, Consumer Insights, Analysis, Opportunities, Growth, Size, Share, Industry, Revenue, Segments, Value, Segmentation, Supply, Forecast, Restraints,
- India Electromagnetic Bulk Flow Meter Market (2026-2032) | Analysis, Challenges, Strategic Insights, Supply, Forecast, Growth, Share, Consumer Insights, Competitive, Value, Outlook, Size & Demand,
- India Battery Powered Bulk Flow Meter Market (2026-2032) | Outlook, Analysis, Competitive Landscape, Growth, Size, Trends, Value, Revenue, Companies, Segmentation, Share & Forecast
- Bosnia and Herzegovina Fuel-Efficient Winglets Market (2026-2032) | Growth, Competition, Strategy, Restraints, Trends, Challenges, segmentation, Value, Outlook, Investment Opportunities, Analysis, Revenue, Companies, Insights, Pricing, Size, Drivers, Demand, Share, Forecast
- Canada Cloud CFD Market (2026-2032) | Size & Revenue, Industry, Growth, Competitive Landscape, Forecast, Segmentation, Value, Outlook, Trends, Share, Analysis, Companies
- Taiwan Food Delivery Platform Market (2026-2032) | Companies, Outlook, Analysis, Trends, Value, Revenue, Segmentation, Share, Forecast, Competitive Landscape, Growth, Size & Forecast
- United Kingdom (UK) Long-term Care Insurance Market (2026-2032) | Growth, Share, Consumer Insights, Drivers, Opportunities, Competition, Pricing Analysis, Segments, Restraints, Companies, Competitive, Value, Outlook, Size, Demand, Analysis, Challenges, Strategic Insights, Investment Trends, Revenue, Trends, Supply, Forecast
- United Kingdom (UK) Long Term Care Market (2026-2032) | Companies, Outlook, Analysis, Trends, Value, Revenue, Segmentation, Share, Forecast, Competitive Landscape, Growth, Size & Forecast
- Iraq Insulation and Waterproofing Market (2026-2032) | Outlook, Drivers, Growth, Size, Share, Industry, Revenue, Trends, Demand, Competitive, Strategic Insights, Opportunities, Segments, Companies, Challenges, Strategy, Consumer Insights, Analysis, Investment Trends, Value, Segmentation, Forecast, Restraints
- India Switchgear Market Outlook (2026-2032) | Size, Share, Trends, Growth, Revenue, Forecast, Analysis, Value, Outlook
Industry Events and Analyst Meet

India EV Show 2026

EV tech India Expo 2026

Auto Tech Asia 2026

Battery Tech India 2026

Smart Production Solutions Guangzhou 2026
Whitepaper
- Middle East & Africa Commercial Security Market Click here to view more.
- Middle East & Africa Fire Safety Systems & Equipment Market Click here to view more.
- GCC Drone Market Click here to view more.
- Middle East Lighting Fixture Market Click here to view more.
- GCC Physical & Perimeter Security Market Click here to view more.
6WResearch In News
- Doha a strategic location for EV manufacturing hub: IPA Qatar
- Demand for luxury TVs surging in the GCC, says Samsung
- Empowering Growth: The Thriving Journey of Bangladesh’s Cable Industry
- Demand for luxury TVs surging in the GCC, says Samsung
- Video call with a traditional healer? Once unthinkable, it’s now common in South Africa
- Intelligent Buildings To Smooth GCC’s Path To Net Zero