Tanzania Phosphonates Market (2025-2031) Outlook | Value, Trends, Share, Companies, Industry, Size, Analysis, Revenue, Forecast & Growth
Market Forecast By Product (ATMP, BHMT, HEDP, DTPMP, Others), By Function (Chemical Intermediates, Metal chelating agents, Scale Inhibitor, Bleach Stabilizer, Concrete Retarder, Others), By End-Use (Pharmaceutical, Water Treatment, Oil & Gas, Detergents & cleaning agents, Paper & Pulp, Textile, Agriculture, Others) And Competitive Landscape
| Product Code: ETC338935 | Publication Date: Aug 2022 | Updated Date: Aug 2025 | Product Type: Market Research Report | |
| Publisher: 6Wresearch | Author: Shubham Padhi | No. of Pages: 75 | No. of Figures: 35 | No. of Tables: 20 |
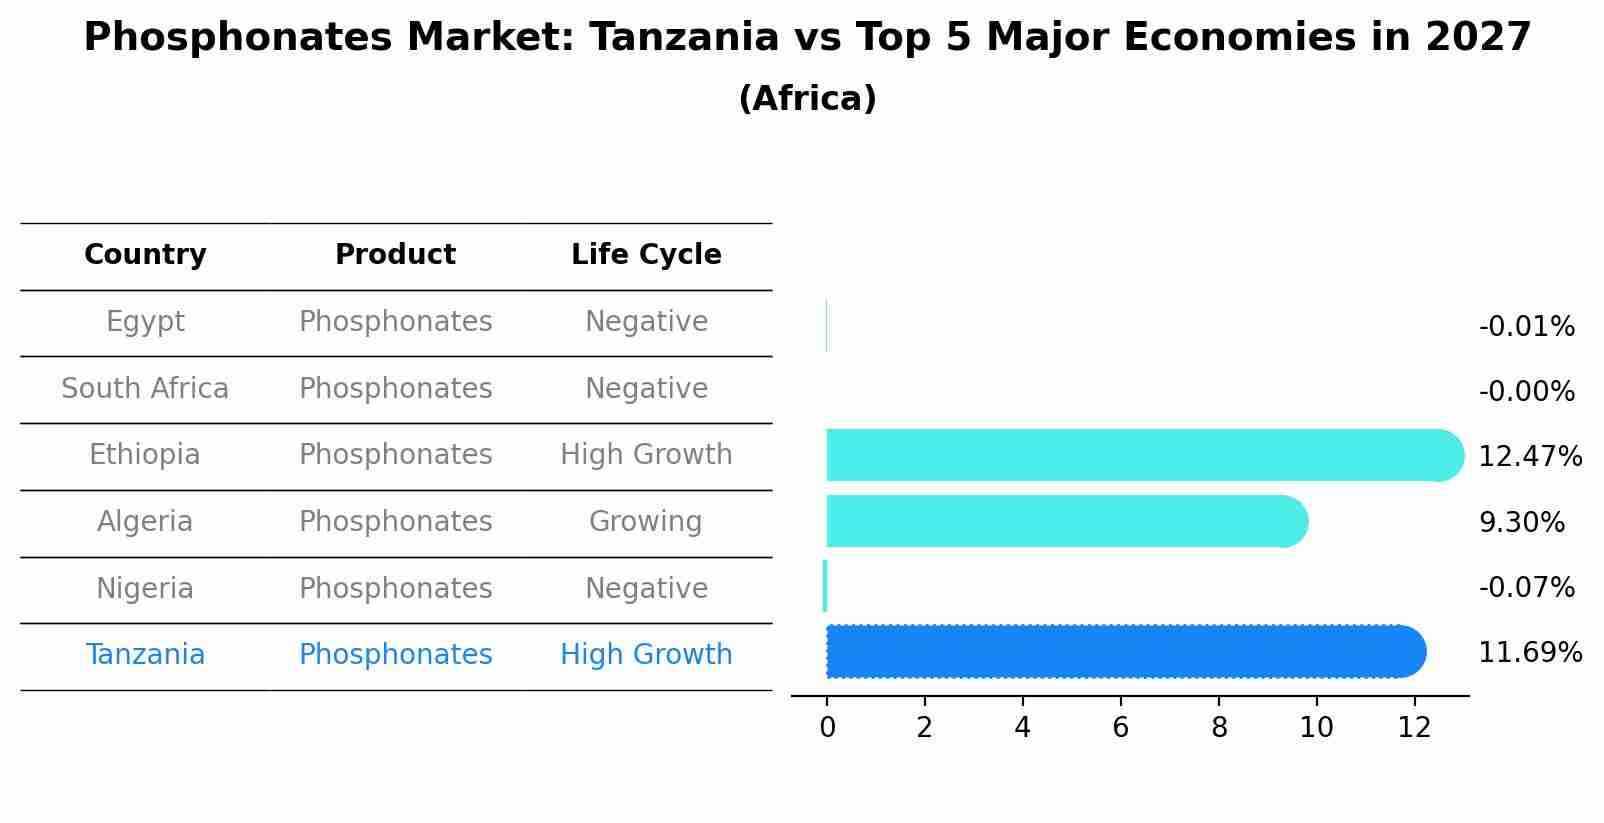
Phosphonates Market: Tanzania vs Top 5 Major Economies in 2027 (Africa)
By 2027, Tanzania's Phosphonates market is forecasted to achieve a high growth rate of 11.69%, with Egypt leading the Africa region, followed by South Africa, Ethiopia, Algeria and Nigeria.
Tanzania Phosphonates Market Synopsis
The Tanzania Phosphonates Market is experiencing steady growth attributed to the increased demand for water treatment chemicals and detergents in the country. Phosphonates are widely used as corrosion inhibitors and scale control agents in various industrial applications, driving their market expansion. Additionally, the agriculture sector`s reliance on phosphonates for fertilizers is further contributing to market growth. The key players in the Tanzania Phosphonates Market include manufacturers such as Italmatch Chemicals, Aquapharm Chemicals, and Sigma-Aldrich Corporation. The market is characterized by a competitive landscape with a focus on product innovation, quality, and sustainability. As the industrial and agricultural sectors continue to expand in Tanzania, the demand for phosphonates is expected to rise, offering lucrative opportunities for market players in the coming years.
Tanzania Phosphonates Market Trends
The Tanzania Phosphonates Market is witnessing a growing demand due to the increasing use of phosphonates in various industries such as agriculture, water treatment, and personal care. The market is seeing a trend towards the adoption of environmentally friendly and sustainable phosphonate products to meet regulatory requirements and address concerns about environmental impact. Additionally, there is a rising awareness among consumers about the benefits of phosphonates in improving water quality and agricultural productivity, driving the market growth. Key players in the Tanzania Phosphonates Market are focusing on research and development activities to introduce innovative products and expand their market presence, further contributing to the market`s upward trajectory.
Tanzania Phosphonates Market Challenges
In the Tanzania Phosphonates Market, some of the key challenges faced include limited awareness and understanding of the benefits of phosphonates among potential users, lack of standardized regulations and guidelines for phosphonate usage in various industries, and competition from alternative water treatment chemicals. Additionally, issues related to affordability and availability of high-quality phosphonate products can also hinder market growth. Addressing these challenges will require targeted marketing efforts to educate consumers, collaboration with regulatory bodies to set industry standards, and investments in research and development to improve product quality and cost-effectiveness. Overall, overcoming these obstacles will be crucial for the Tanzania Phosphonates Market to realize its full potential and meet the growing demand for water treatment solutions in various sectors.
Tanzania Phosphonates Market Investment Opportunities
One promising investment opportunity in the Tanzania Phosphonates market lies in the agriculture sector. Phosphonates are essential components in agricultural fertilizers and have a significant impact on crop yield and quality. With the growing demand for high-quality agricultural products in Tanzania, there is a need for innovative and sustainable farming practices that utilize phosphonates to enhance soil health and plant growth. Investors can explore opportunities in manufacturing and supplying phosphonate-based fertilizers to the agriculture industry in Tanzania. Additionally, investing in research and development to create new, more effective phosphonate products tailored to the local agricultural needs could also prove to be a lucrative opportunity in the market.
Jordan Agar Market Government Policies
Government policies related to the Tanzania Phosphonates Market aim to promote sustainable agricultural practices and protect the environment. The government has implemented regulations to control the use of phosphonates in agriculture, ensuring that these chemicals are used safely and in accordance with recommended guidelines to minimize environmental impact. Additionally, the government encourages research and development in the agricultural sector to explore alternative and more environmentally friendly solutions to reduce reliance on phosphonates. Compliance with these policies is monitored through inspections and enforcement measures to safeguard public health and the ecosystem while supporting the growth of the agricultural industry in Tanzania.
Tanzania Phosphonates Market Future Outlook
The Tanzania Phosphonates Market is expected to witness steady growth in the coming years driven by increasing demand from various end-use industries such as water treatment, agriculture, and industrial cleaning. The market is likely to be influenced by factors such as population growth, urbanization, and industrial development, which will boost the need for phosphonates as water treatment chemicals and as corrosion inhibitors in industrial processes. Additionally, growing awareness about the benefits of phosphonates in improving crop yield and soil health is expected to further drive market growth. However, challenges such as environmental concerns and regulatory restrictions may impact market dynamics. Overall, the Tanzania Phosphonates Market is anticipated to expand at a moderate pace, with opportunities for innovation and product development to cater to evolving consumer needs and preferences.
Key Highlights of the Report:
- Tanzania Phosphonates Market Outlook
- Market Size of Tanzania Phosphonates Market, 2024
- Forecast of Tanzania Phosphonates Market, 2031
- Historical Data and Forecast of Tanzania Phosphonates Revenues & Volume for the Period 2021 - 2031
- Tanzania Phosphonates Market Trend Evolution
- Tanzania Phosphonates Market Drivers and Challenges
- Tanzania Phosphonates Price Trends
- Tanzania Phosphonates Porter's Five Forces
- Tanzania Phosphonates Industry Life Cycle
- Historical Data and Forecast of Tanzania Phosphonates Market Revenues & Volume By Product for the Period 2021 - 2031
- Historical Data and Forecast of Tanzania Phosphonates Market Revenues & Volume By ATMP for the Period 2021 - 2031
- Historical Data and Forecast of Tanzania Phosphonates Market Revenues & Volume By BHMT for the Period 2021 - 2031
- Historical Data and Forecast of Tanzania Phosphonates Market Revenues & Volume By HEDP for the Period 2021 - 2031
- Historical Data and Forecast of Tanzania Phosphonates Market Revenues & Volume By DTPMP for the Period 2021 - 2031
- Historical Data and Forecast of Tanzania Phosphonates Market Revenues & Volume By Others for the Period 2021 - 2031
- Historical Data and Forecast of Tanzania Phosphonates Market Revenues & Volume By Function for the Period 2021 - 2031
- Historical Data and Forecast of Tanzania Phosphonates Market Revenues & Volume By Chemical Intermediates for the Period 2021 - 2031
- Historical Data and Forecast of Tanzania Phosphonates Market Revenues & Volume By Metal chelating agents for the Period 2021 - 2031
- Historical Data and Forecast of Tanzania Phosphonates Market Revenues & Volume By Scale Inhibitor for the Period 2021 - 2031
- Historical Data and Forecast of Tanzania Phosphonates Market Revenues & Volume By Bleach Stabilizer for the Period 2021 - 2031
- Historical Data and Forecast of Tanzania Phosphonates Market Revenues & Volume By Concrete Retarder for the Period 2021 - 2031
- Historical Data and Forecast of Tanzania Phosphonates Market Revenues & Volume By Others for the Period 2021 - 2031
- Historical Data and Forecast of Tanzania Phosphonates Market Revenues & Volume By End-Use for the Period 2021 - 2031
- Historical Data and Forecast of Tanzania Phosphonates Market Revenues & Volume By Pharmaceutical for the Period 2021 - 2031
- Historical Data and Forecast of Tanzania Phosphonates Market Revenues & Volume By Water Treatment for the Period 2021 - 2031
- Historical Data and Forecast of Tanzania Phosphonates Market Revenues & Volume By Oil & Gas for the Period 2021 - 2031
- Historical Data and Forecast of Tanzania Phosphonates Market Revenues & Volume By Detergents & cleaning agents for the Period 2021 - 2031
- Historical Data and Forecast of Tanzania Phosphonates Market Revenues & Volume By Paper & Pulp for the Period 2021 - 2031
- Historical Data and Forecast of Tanzania Phosphonates Market Revenues & Volume By Textile for the Period 2021 - 2031
- Historical Data and Forecast of Tanzania Phosphonates Market Revenues & Volume By Agriculture for the Period 2021 - 2031
- Historical Data and Forecast of Tanzania Phosphonates Market Revenues & Volume By Others for the Period 2021 - 2031
- Tanzania Phosphonates Import Export Trade Statistics
- Market Opportunity Assessment By Product
- Market Opportunity Assessment By Function
- Market Opportunity Assessment By End-Use
- Tanzania Phosphonates Top Companies Market Share
- Tanzania Phosphonates Competitive Benchmarking By Technical and Operational Parameters
- Tanzania Phosphonates Company Profiles
- Tanzania Phosphonates Key Strategic Recommendations
Frequently Asked Questions About the Market Study (FAQs):
6Wresearch actively monitors the Tanzania Phosphonates Market and publishes its comprehensive annual report, highlighting emerging trends, growth drivers, revenue analysis, and forecast outlook. Our insights help businesses to make data-backed strategic decisions with ongoing market dynamics. Our analysts track relevent industries related to the Tanzania Phosphonates Market, allowing our clients with actionable intelligence and reliable forecasts tailored to emerging regional needs.
Yes, we provide customisation as per your requirements. To learn more, feel free to contact us on sales@6wresearch.com
1 Executive Summary |
2 Introduction |
2.1 Key Highlights of the Report |
2.2 Report Description |
2.3 Market Scope & Segmentation |
2.4 Research Methodology |
2.5 Assumptions |
3 Tanzania Phosphonates Market Overview |
3.1 Tanzania Country Macro Economic Indicators |
3.2 Tanzania Phosphonates Market Revenues & Volume, 2021 & 2031F |
3.3 Tanzania Phosphonates Market - Industry Life Cycle |
3.4 Tanzania Phosphonates Market - Porter's Five Forces |
3.5 Tanzania Phosphonates Market Revenues & Volume Share, By Product, 2021 & 2031F |
3.6 Tanzania Phosphonates Market Revenues & Volume Share, By Function, 2021 & 2031F |
3.7 Tanzania Phosphonates Market Revenues & Volume Share, By End-Use, 2021 & 2031F |
4 Tanzania Phosphonates Market Dynamics |
4.1 Impact Analysis |
4.2 Market Drivers |
4.2.1 Increasing demand for phosphonates in agriculture sector for crop protection and soil enhancement. |
4.2.2 Rising awareness about water treatment and the use of phosphonates in industrial applications for water conditioning. |
4.2.3 Government initiatives and regulations promoting the use of phosphonates in various industries. |
4.3 Market Restraints |
4.3.1 Fluctuating prices of raw materials used in phosphonates production. |
4.3.2 Environmental concerns and regulations regarding the use of phosphonates. |
4.3.3 Competition from alternative products and technologies in the market. |
5 Tanzania Phosphonates Market Trends |
6 Tanzania Phosphonates Market, By Types |
6.1 Tanzania Phosphonates Market, By Product |
6.1.1 Overview and Analysis |
6.1.2 Tanzania Phosphonates Market Revenues & Volume, By Product, 2021 - 2031F |
6.1.3 Tanzania Phosphonates Market Revenues & Volume, By ATMP, 2021 - 2031F |
6.1.4 Tanzania Phosphonates Market Revenues & Volume, By BHMT, 2021 - 2031F |
6.1.5 Tanzania Phosphonates Market Revenues & Volume, By HEDP, 2021 - 2031F |
6.1.6 Tanzania Phosphonates Market Revenues & Volume, By DTPMP, 2021 - 2031F |
6.1.7 Tanzania Phosphonates Market Revenues & Volume, By Others, 2021 - 2031F |
6.2 Tanzania Phosphonates Market, By Function |
6.2.1 Overview and Analysis |
6.2.2 Tanzania Phosphonates Market Revenues & Volume, By Chemical Intermediates, 2021 - 2031F |
6.2.3 Tanzania Phosphonates Market Revenues & Volume, By Metal chelating agents, 2021 - 2031F |
6.2.4 Tanzania Phosphonates Market Revenues & Volume, By Scale Inhibitor, 2021 - 2031F |
6.2.5 Tanzania Phosphonates Market Revenues & Volume, By Bleach Stabilizer, 2021 - 2031F |
6.2.6 Tanzania Phosphonates Market Revenues & Volume, By Concrete Retarder, 2021 - 2031F |
6.2.7 Tanzania Phosphonates Market Revenues & Volume, By Others, 2021 - 2031F |
6.3 Tanzania Phosphonates Market, By End-Use |
6.3.1 Overview and Analysis |
6.3.2 Tanzania Phosphonates Market Revenues & Volume, By Pharmaceutical, 2021 - 2031F |
6.3.3 Tanzania Phosphonates Market Revenues & Volume, By Water Treatment, 2021 - 2031F |
6.3.4 Tanzania Phosphonates Market Revenues & Volume, By Oil & Gas, 2021 - 2031F |
6.3.5 Tanzania Phosphonates Market Revenues & Volume, By Detergents & cleaning agents, 2021 - 2031F |
6.3.6 Tanzania Phosphonates Market Revenues & Volume, By Paper & Pulp, 2021 - 2031F |
6.3.7 Tanzania Phosphonates Market Revenues & Volume, By Textile, 2021 - 2031F |
6.3.8 Tanzania Phosphonates Market Revenues & Volume, By Others, 2021 - 2031F |
6.3.9 Tanzania Phosphonates Market Revenues & Volume, By Others, 2021 - 2031F |
7 Tanzania Phosphonates Market Import-Export Trade Statistics |
7.1 Tanzania Phosphonates Market Export to Major Countries |
7.2 Tanzania Phosphonates Market Imports from Major Countries |
8 Tanzania Phosphonates Market Key Performance Indicators |
8.1 Number of new agricultural projects utilizing phosphonates. |
8.2 Percentage increase in adoption of phosphonates in water treatment facilities. |
8.3 Research and development investment in phosphonates technology and applications. |
8.4 Number of government policies supporting the use of phosphonates in industries. |
8.5 Percentage of customer satisfaction and retention rate for phosphonates suppliers. |
9 Tanzania Phosphonates Market - Opportunity Assessment |
9.1 Tanzania Phosphonates Market Opportunity Assessment, By Product, 2021 & 2031F |
9.2 Tanzania Phosphonates Market Opportunity Assessment, By Function, 2021 & 2031F |
9.3 Tanzania Phosphonates Market Opportunity Assessment, By End-Use, 2021 & 2031F |
10 Tanzania Phosphonates Market - Competitive Landscape |
10.1 Tanzania Phosphonates Market Revenue Share, By Companies, 2024 |
10.2 Tanzania Phosphonates Market Competitive Benchmarking, By Operating and Technical Parameters |
11 Company Profiles |
12 Recommendations |
13 Disclaimer |
Global Go To Market Strategy - 2030
Export potential enables firms to identify high-growth global markets with greater confidence by combining advanced trade intelligence with a structured quantitative methodology. The framework analyzes emerging demand trends and country-level import patterns while integrating macroeconomic and trade datasets such as GDP and population forecasts, bilateral import–export flows, tariff structures, elasticity differentials between developed and developing economies, geographic distance, and import demand projections. Using weighted trade values from 2020–2024 as the base period to project country-to-country export potential for 2030, these inputs are operationalized through calculated drivers such as gravity model parameters, tariff impact factors, and projected GDP per-capita growth. Through an analysis of hidden potentials, demand hotspots, and market conditions that are most favorable to success, this method enables firms to focus on target countries, maximize returns, and global expansion with data, backed by accuracy.
By factoring in the projected importer demand gap that is currently unmet and could be potential opportunity, it identifies the potential for the Exporter (Country) among 190 countries, against the general trade analysis, which identifies the biggest importer or exporter.
To discover high-growth global markets and optimize your business strategy:
Click Here
Pricing
- Single User License$ 1,995
- Department License$ 2,400
- Site License$ 3,120
- Global License$ 3,795

Leadership Perspectives from Industry Events
Search
Thought Leadership and Analyst Meet


Our Clients
6WResearch In News
- Doha a strategic location for EV manufacturing hub: IPA Qatar
- Demand for luxury TVs surging in the GCC, says Samsung
- Empowering Growth: The Thriving Journey of Bangladesh’s Cable Industry
- Demand for luxury TVs surging in the GCC, says Samsung
- Video call with a traditional healer? Once unthinkable, it’s now common in South Africa
- Intelligent Buildings To Smooth GCC’s Path To Net Zero
Latest Reports
- Cape Verde Portable Hand-Thrown Extinguisher Market (2026-2032)
- Canada Portable Hand-Thrown Extinguisher Market (2026-2032)
- Cameroon Portable Hand-Thrown Extinguisher Market (2026-2032)
- Burundi Portable Hand-Thrown Extinguisher Market (2026-2032)
- Burkina Faso Portable Hand-Thrown Extinguisher Market (2026-2032)
- Bulgaria Portable Hand-Thrown Extinguisher Market (2026-2032)
- Brunei Portable Hand-Thrown Extinguisher Market (2026-2032)
- Botswana Portable Hand-Thrown Extinguisher Market (2026-2032)
- Bosnia and Herzegovina Portable Hand-Thrown Extinguisher Market (2026-2032)
- Bolivia Portable Hand-Thrown Extinguisher Market (2026-2032)
Industry Events and Analyst Meet

HIMTEX 2026

India Refining Summit 2026

India EV Show 2026

EV tech India Expo 2026

Auto Tech Asia 2026
Whitepaper
- Middle East & Africa Commercial Security Market Click here to view more.
- Middle East & Africa Fire Safety Systems & Equipment Market Click here to view more.
- GCC Drone Market Click here to view more.
- Middle East Lighting Fixture Market Click here to view more.
- GCC Physical & Perimeter Security Market Click here to view more.