Tanzania Pressure Labels Market (2025-2031) Outlook | Industry, Companies, Forecast, Growth, Trends, Analysis, Size, Revenue, Share & Value
Market Forecast By Type (Release Liner, Linerless), By Composition (Facestock, Adhesives, Others), By Printing technology (Digital Printing, Flexography, Others) And Competitive Landscape
| Product Code: ETC4601516 | Publication Date: Jul 2023 | Updated Date: Nov 2025 | Product Type: Report | |
| Publisher: 6Wresearch | Author: Summon Dutta | No. of Pages: 85 | No. of Figures: 45 | No. of Tables: 25 |
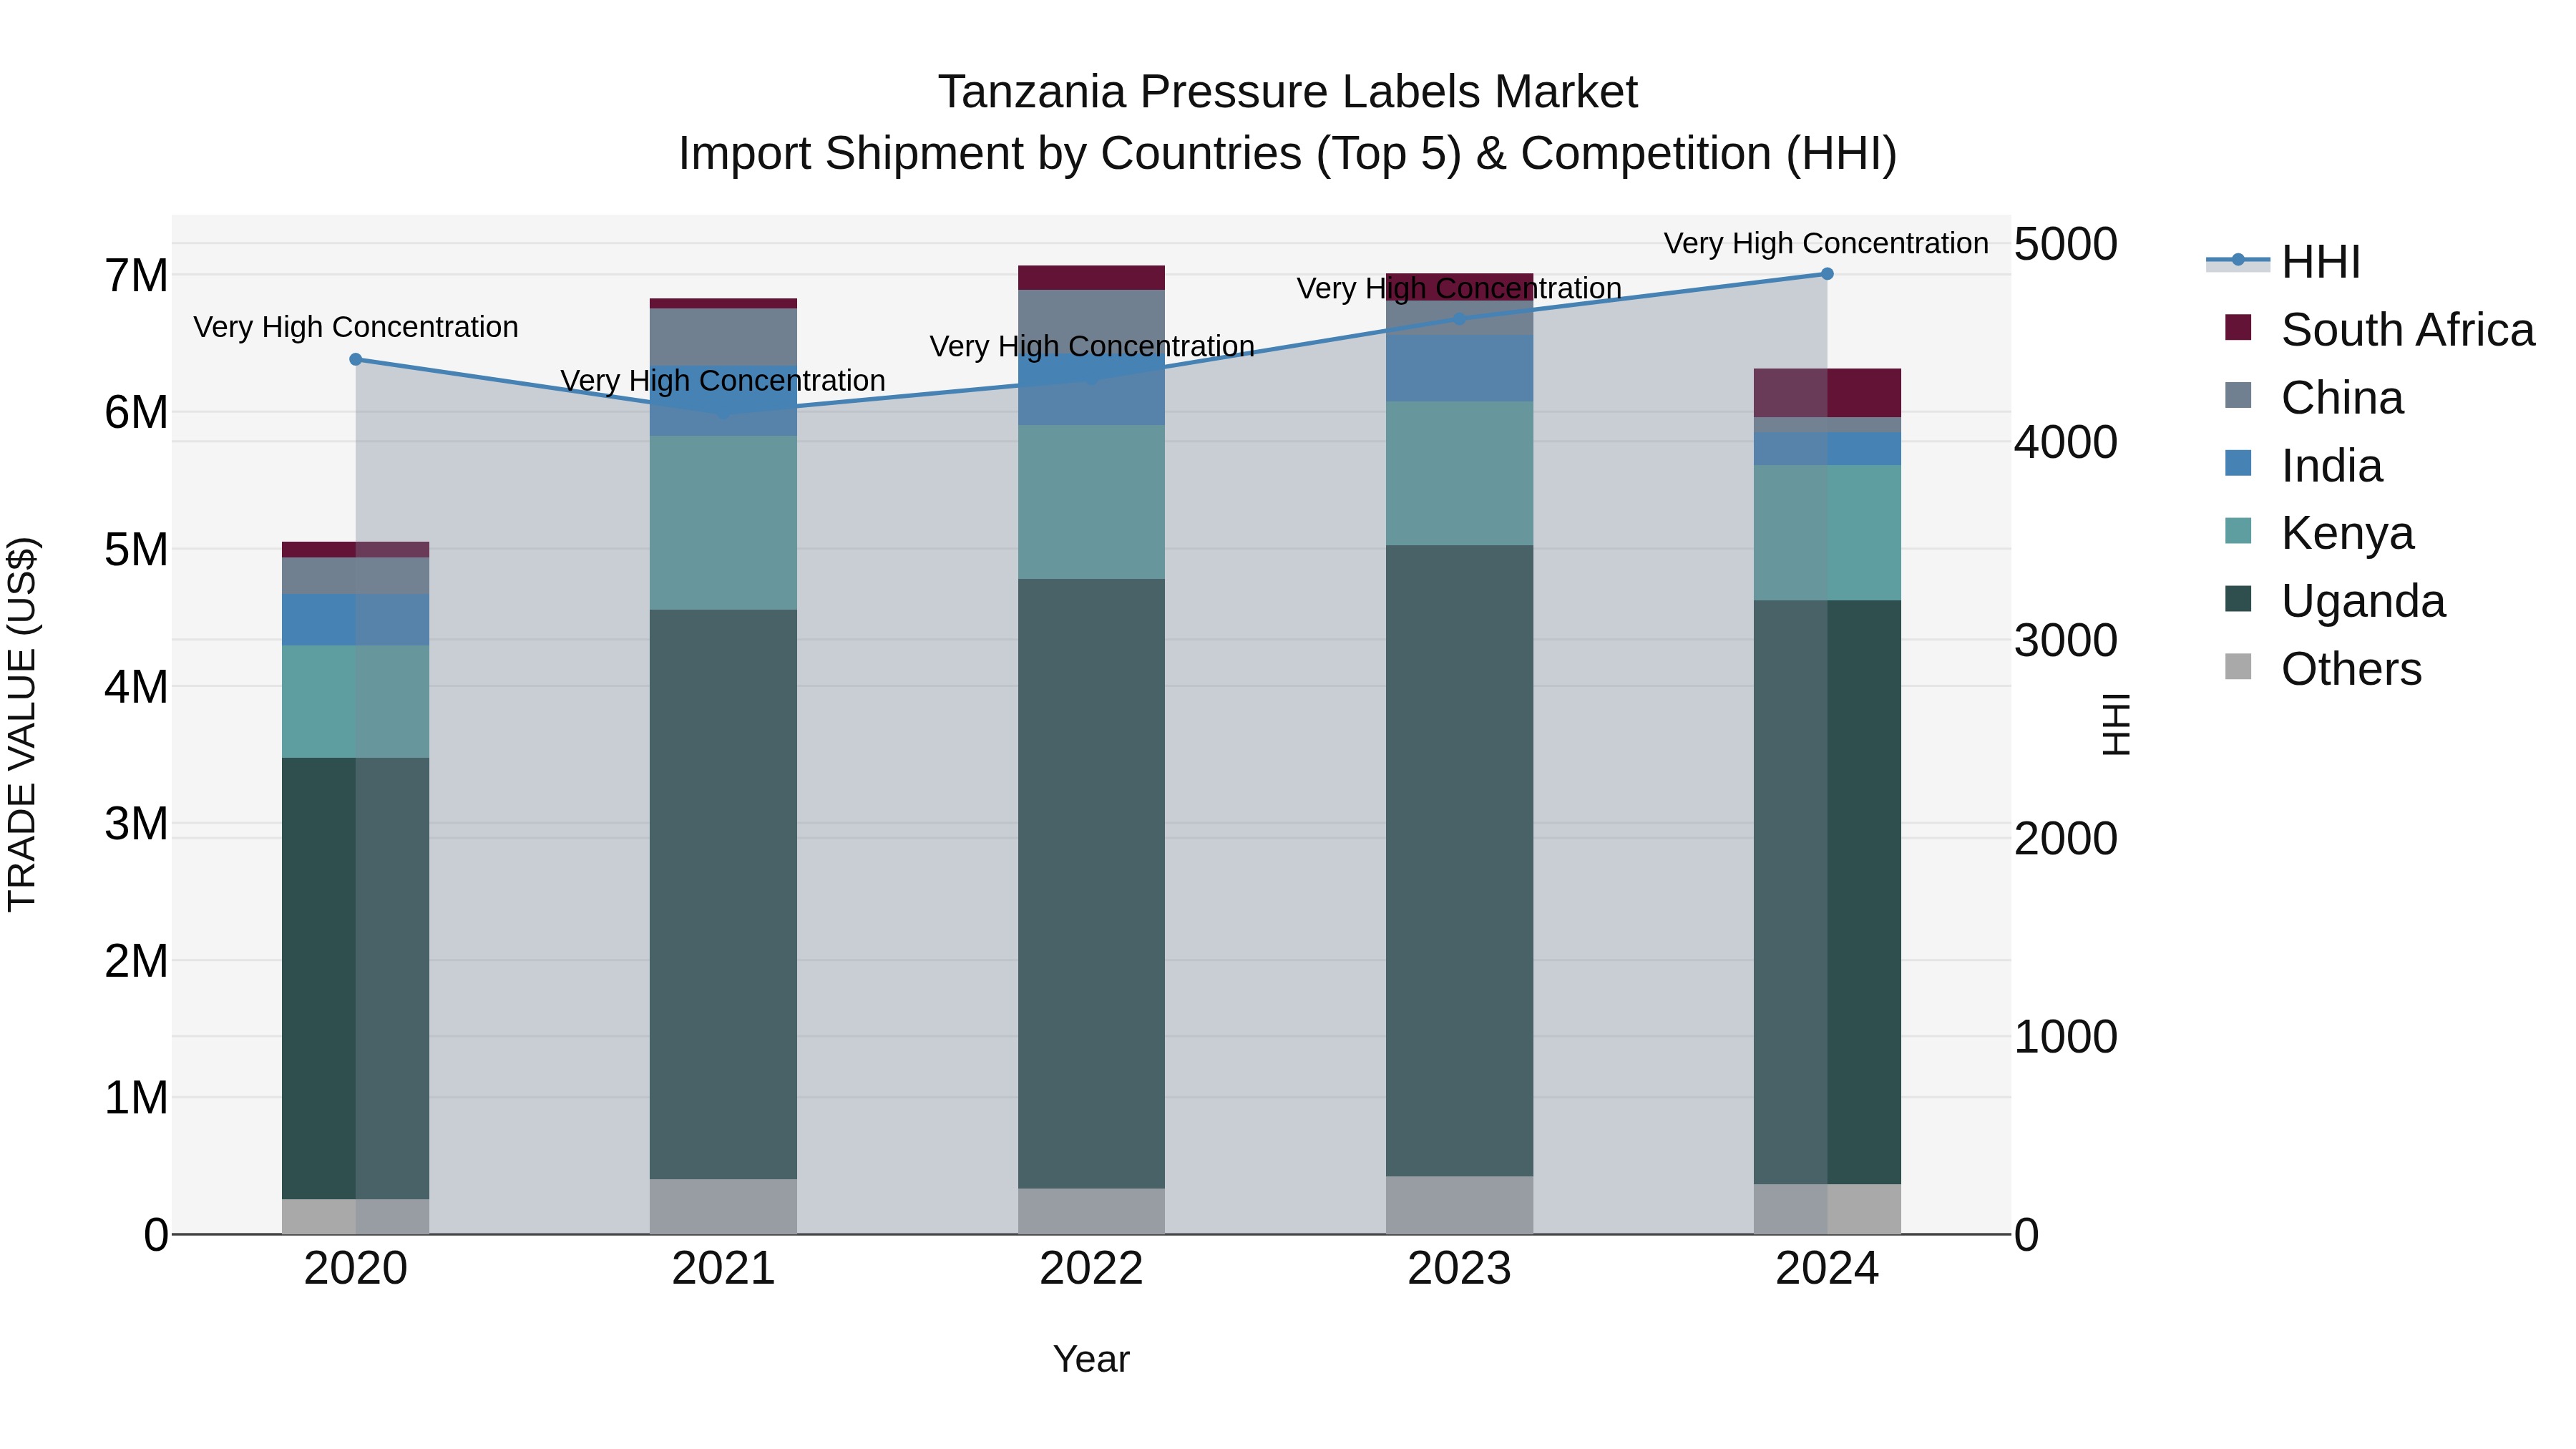
Tanzania Pressure Labels Market: Top 5 Importing Countries and Market Competition (HHI) Analysis
In 2024, Tanzania continued to see a high concentration of pressure labels imports, with top exporting countries including Uganda, Kenya, South Africa, India, and the United States of America. Despite a moderate Compound Annual Growth Rate (CAGR) of 5.73% from 2020 to 2024, there was a notable decline in growth rate from 2023 to 2024 at -9.94%. The market dynamics suggest a competitive landscape, with opportunities for market players to innovate and differentiate their offerings to adapt to changing consumer demands in Tanzania.
Tanzania Pressure Labels Market Overview
Pressure-sensitive labels in Tanzania are used in packaging and product labeling applications for their adhesive properties and ability to adhere to various surfaces, enhancing brand visibility, information communication, and consumer engagement.
Drivers of the market
The Tanzania Pressure Labels Market growth is driven by packaging requirements in food & beverage, pharmaceuticals, and consumer goods sectors. Regulatory compliance, product differentiation, and demand for durable labeling solutions support market expansion.
Challenges of the market
Challenges in the pressure labels market include technological advancements in printing and labeling solutions that meet evolving customer demands. Regulatory compliance and adherence to labeling standards pose challenges for manufacturers and suppliers. Educating end-users about the benefits of pressure-sensitive labels and their applications in various industries remains essential for market growth.
Government Policy of the market
In Tanzania, the Pressure Labels market is influenced by government policies that regulate labeling standards, product identification, and consumer information. These policies include standards for label accuracy, adhesive properties, and regulatory compliance in Pressure Labels applications. Government initiatives may involve incentives for adopting labeling technologies, investment in labeling infrastructure, and regulatory oversight to ensure compliance with packaging regulations. Regulatory frameworks oversee import and export activities to maintain market stability and uphold labeling standards. Consumer protection policies focus on ensuring product traceability, promoting information transparency, and enhancing consumer confidence through Pressure Labels innovations.
Key Highlights of the Report:
- Tanzania Pressure Labels Market Outlook
- Market Size of Tanzania Pressure Labels Market, 2024
- Forecast of Tanzania Pressure Labels Market, 2031
- Historical Data and Forecast of Tanzania Pressure Labels Revenues & Volume for the Period 2021-2031
- Tanzania Pressure Labels Market Trend Evolution
- Tanzania Pressure Labels Market Drivers and Challenges
- Tanzania Pressure Labels Price Trends
- Tanzania Pressure Labels Porter's Five Forces
- Tanzania Pressure Labels Industry Life Cycle
- Historical Data and Forecast of Tanzania Pressure Labels Market Revenues & Volume By Type for the Period 2021-2031
- Historical Data and Forecast of Tanzania Pressure Labels Market Revenues & Volume By Release Liner for the Period 2021-2031
- Historical Data and Forecast of Tanzania Pressure Labels Market Revenues & Volume By Linerless for the Period 2021-2031
- Historical Data and Forecast of Tanzania Pressure Labels Market Revenues & Volume By Composition for the Period 2021-2031
- Historical Data and Forecast of Tanzania Pressure Labels Market Revenues & Volume By Facestock for the Period 2021-2031
- Historical Data and Forecast of Tanzania Pressure Labels Market Revenues & Volume By Adhesives for the Period 2021-2031
- Historical Data and Forecast of Tanzania Pressure Labels Market Revenues & Volume By Others for the Period 2021-2031
- Historical Data and Forecast of Tanzania Pressure Labels Market Revenues & Volume By Printing technology for the Period 2021-2031
- Historical Data and Forecast of Tanzania Pressure Labels Market Revenues & Volume By Digital Printing for the Period 2021-2031
- Historical Data and Forecast of Tanzania Pressure Labels Market Revenues & Volume By Flexography for the Period 2021-2031
- Historical Data and Forecast of Tanzania Pressure Labels Market Revenues & Volume By Others for the Period 2021-2031
- Tanzania Pressure Labels Import Export Trade Statistics
- Market Opportunity Assessment By Type
- Market Opportunity Assessment By Composition
- Market Opportunity Assessment By Printing technology
- Tanzania Pressure Labels Top Companies Market Share
- Tanzania Pressure Labels Competitive Benchmarking By Technical and Operational Parameters
- Tanzania Pressure Labels Company Profiles
- Tanzania Pressure Labels Key Strategic Recommendations
What are some key customer preferences driving the Tanzania pressure labels market?
In the Tanzania pressure labels market, customers are increasingly gravitating towards eco-friendly options, leading to a rise in demand for sustainable labeling solutions. Companies like Green Label Co. have gained popularity by offering labels made from recycled materials, aligning with the growing consumer trend towards sustainability.
The increasing demand for packaged goods in Tanzania, driven by the rising population and urbanization, is a significant factor contributing to the growth of the pressure labels market. Companies like Tanzanian Breweries Limited and Akber International Labels are expanding their product lines and utilizing advanced labeling technologies to meet the growing consumer demands, thus fueling market growth.
There are significant opportunities for companies to capitalize on the growing demand for innovative labeling solutions in Tanzania. For example, Label Makers Ltd, a local company, has seen success by providing premium quality pressure labels to a range of industries including food and beverage, pharmaceuticals, and personal care. Investing in advanced printing technologies and sustainable label materials can help businesses position themselves as leaders in this market.
The Tanzania pressure labels market encompasses a wide range of applications across various industries such as food and beverage, pharmaceuticals, cosmetics, and automotive. Key players in the market include companies like Artpack Limited and De La Rue, offering a diverse range of pressure-sensitive labels that cater to different customer requirements. This market is driven by the growing demand for product labeling solutions that provide durability, quality printing, and customization options.
The Tanzania pressure labels market is primarily driven by the growing demand for packaged goods in the country, with companies like Azania Group expanding their product lines and requiring more labeling solutions. However, challenges such as regulatory changes impacting labeling requirements and the increasing competition from international players like UPM Raflatac entering the market are shaping the dynamics of the industry. To succeed, local label manufacturers need to innovate and offer competitive pricing while ensuring compliance with evolving standards.
6Wresearch actively monitors the Tanzania Pressure Labels Market and publishes its comprehensive annual report, highlighting emerging trends, growth drivers, revenue analysis, and forecast outlook. Our insights help businesses to make data-backed strategic decisions with ongoing market dynamics. Our analysts track relevent industries related to the Tanzania Pressure Labels Market, allowing our clients with actionable intelligence and reliable forecasts tailored to emerging regional needs.
Yes, we provide customisation as per your requirements. To learn more, feel free to contact us on sales@6wresearch.com
1 Executive Summary |
2 Introduction |
2.1 Key Highlights of the Report |
2.2 Report Description |
2.3 Market Scope & Segmentation |
2.4 Research Methodology |
2.5 Assumptions |
3 Tanzania Pressure Labels Market Overview |
3.1 Tanzania Country Macro Economic Indicators |
3.2 Tanzania Pressure Labels Market Revenues & Volume, 2021 & 2031F |
3.3 Tanzania Pressure Labels Market - Industry Life Cycle |
3.4 Tanzania Pressure Labels Market - Porter's Five Forces |
3.5 Tanzania Pressure Labels Market Revenues & Volume Share, By Type, 2021 & 2031F |
3.6 Tanzania Pressure Labels Market Revenues & Volume Share, By Composition, 2021 & 2031F |
3.7 Tanzania Pressure Labels Market Revenues & Volume Share, By Printing technology, 2021 & 2031F |
4 Tanzania Pressure Labels Market Dynamics |
4.1 Impact Analysis |
4.2 Market Drivers |
4.2.1 Increasing demand for packaged products in Tanzania |
4.2.2 Growth in the manufacturing sector leading to higher demand for pressure labels |
4.2.3 Adoption of advanced labeling technologies in the packaging industry |
4.3 Market Restraints |
4.3.1 Fluctuations in raw material prices impacting production costs |
4.3.2 Lack of skilled labor for label printing and application |
4.3.3 Stringent regulations and standards for labeling in Tanzania |
5 Tanzania Pressure Labels Market Trends |
6 Tanzania Pressure Labels Market, By Types |
6.1 Tanzania Pressure Labels Market, By Type |
6.1.1 Overview and Analysis |
6.1.2 Tanzania Pressure Labels Market Revenues & Volume, By Type, 2021-2031F |
6.1.3 Tanzania Pressure Labels Market Revenues & Volume, By Release Liner, 2021-2031F |
6.1.4 Tanzania Pressure Labels Market Revenues & Volume, By Linerless, 2021-2031F |
6.2 Tanzania Pressure Labels Market, By Composition |
6.2.1 Overview and Analysis |
6.2.2 Tanzania Pressure Labels Market Revenues & Volume, By Facestock, 2021-2031F |
6.2.3 Tanzania Pressure Labels Market Revenues & Volume, By Adhesives, 2021-2031F |
6.2.4 Tanzania Pressure Labels Market Revenues & Volume, By Others, 2021-2031F |
6.3 Tanzania Pressure Labels Market, By Printing technology |
6.3.1 Overview and Analysis |
6.3.2 Tanzania Pressure Labels Market Revenues & Volume, By Digital Printing, 2021-2031F |
6.3.3 Tanzania Pressure Labels Market Revenues & Volume, By Flexography, 2021-2031F |
6.3.4 Tanzania Pressure Labels Market Revenues & Volume, By Others, 2021-2031F |
7 Tanzania Pressure Labels Market Import-Export Trade Statistics |
7.1 Tanzania Pressure Labels Market Export to Major Countries |
7.2 Tanzania Pressure Labels Market Imports from Major Countries |
8 Tanzania Pressure Labels Market Key Performance Indicators |
8.1 Average turnaround time for label printing and application |
8.2 Percentage of market share held by digital printing technologies |
8.3 Number of new product launches requiring pressure labels |
8.4 Overall customer satisfaction with the quality of pressure labels |
9 Tanzania Pressure Labels Market - Opportunity Assessment |
9.1 Tanzania Pressure Labels Market Opportunity Assessment, By Type, 2021 & 2031F |
9.2 Tanzania Pressure Labels Market Opportunity Assessment, By Composition, 2021 & 2031F |
9.3 Tanzania Pressure Labels Market Opportunity Assessment, By Printing technology, 2021 & 2031F |
10 Tanzania Pressure Labels Market - Competitive Landscape |
10.1 Tanzania Pressure Labels Market Revenue Share, By Companies, 2024 |
10.2 Tanzania Pressure Labels Market Competitive Benchmarking, By Operating and Technical Parameters |
11 Company Profiles |
12 Recommendations |
13 Disclaimer |
Export potential assessment - trade Analytics for 2030
Export potential enables firms to identify high-growth global markets with greater confidence by combining advanced trade intelligence with a structured quantitative methodology. The framework analyzes emerging demand trends and country-level import patterns while integrating macroeconomic and trade datasets such as GDP and population forecasts, bilateral import–export flows, tariff structures, elasticity differentials between developed and developing economies, geographic distance, and import demand projections. Using weighted trade values from 2020–2024 as the base period to project country-to-country export potential for 2030, these inputs are operationalized through calculated drivers such as gravity model parameters, tariff impact factors, and projected GDP per-capita growth. Through an analysis of hidden potentials, demand hotspots, and market conditions that are most favorable to success, this method enables firms to focus on target countries, maximize returns, and global expansion with data, backed by accuracy.
By factoring in the projected importer demand gap that is currently unmet and could be potential opportunity, it identifies the potential for the Exporter (Country) among 190 countries, against the general trade analysis, which identifies the biggest importer or exporter.
To discover high-growth global markets and optimize your business strategy:
Click Here
Pricing
- Single User License$ 1,995
- Department License$ 2,400
- Site License$ 3,120
- Global License$ 3,795

Search
Thought Leadership and Analyst Meet


Our Clients
Latest Reports
- Canada Cloud CFD Market (2026-2032) | Size & Revenue, Industry, Growth, Competitive Landscape, Forecast, Segmentation, Value, Outlook, Trends, Share, Analysis, Companies
- Taiwan Food Delivery Platform Market (2026-2032) | Companies, Outlook, Analysis, Trends, Value, Revenue, Segmentation, Share, Forecast, Competitive Landscape, Growth, Size & Forecast
- United Kingdom (UK) Long-term Care Insurance Market (2026-2032) | Growth, Share, Consumer Insights, Drivers, Opportunities, Competition, Pricing Analysis, Segments, Restraints, Companies, Competitive, Value, Outlook, Size, Demand, Analysis, Challenges, Strategic Insights, Investment Trends, Revenue, Trends, Supply, Forecast
- United Kingdom (UK) Long Term Care Market (2026-2032) | Companies, Outlook, Analysis, Trends, Value, Revenue, Segmentation, Share, Forecast, Competitive Landscape, Growth, Size & Forecast
- Iraq Insulation and Waterproofing Market (2026-2032) | Outlook, Drivers, Growth, Size, Share, Industry, Revenue, Trends, Demand, Competitive, Strategic Insights, Opportunities, Segments, Companies, Challenges, Strategy, Consumer Insights, Analysis, Investment Trends, Value, Segmentation, Forecast, Restraints
- India Switchgear Market Outlook (2026-2032) | Size, Share, Trends, Growth, Revenue, Forecast, Analysis, Value, Outlook
- Pakistan Contraceptive Implants Market (2025-2031) | Demand, Growth, Size, Share, Industry, Pricing Analysis, Competitive, Strategic Insights, Strategy, Consumer Insights, Analysis, Investment Trends, Opportunities, Revenue, Segments, Value, Segmentation, Supply, Forecast, Restraints, Outlook, Competition, Drivers, Trends, Companies, Challenges
- Sri Lanka Packaging Market (2026-2032) | Outlook, Competition, Drivers, Trends, Demand, Pricing Analysis, Competitive, Strategic Insights, Companies, Challenges, Strategy, Consumer Insights, Analysis, Investment Trends, Opportunities, Growth, Size, Share, Industry, Revenue, Segments, Value, Segmentation, Supply, Forecast, Restraints
- India Kids Watches Market (2026-2032) | Strategy, Consumer Insights, Analysis, Investment Trends, Opportunities, Growth, Size, Share, Industry, Revenue, Segments, Value, Segmentation, Supply, Forecast, Restraints, Outlook, Competition, Drivers, Trends, Demand, Pricing Analysis, Competitive, Strategic Insights, Companies, Challenges
- Saudi Arabia Core Assurance Service Market (2025-2031) | Strategy, Consumer Insights, Analysis, Investment Trends, Opportunities, Growth, Size, Share, Industry, Revenue, Segments, Value, Segmentation, Supply, Forecast, Restraints, Outlook, Competition, Drivers, Trends, Demand, Pricing Analysis, Competitive, Strategic Insights, Companies, Challenges
Industry Events and Analyst Meet

India EV Show 2026

EV tech India Expo 2026

Auto Tech Asia 2026

Battery Tech India 2026

Smart Production Solutions Guangzhou 2026
Whitepaper
- Middle East & Africa Commercial Security Market Click here to view more.
- Middle East & Africa Fire Safety Systems & Equipment Market Click here to view more.
- GCC Drone Market Click here to view more.
- Middle East Lighting Fixture Market Click here to view more.
- GCC Physical & Perimeter Security Market Click here to view more.
6WResearch In News
- Doha a strategic location for EV manufacturing hub: IPA Qatar
- Demand for luxury TVs surging in the GCC, says Samsung
- Empowering Growth: The Thriving Journey of Bangladesh’s Cable Industry
- Demand for luxury TVs surging in the GCC, says Samsung
- Video call with a traditional healer? Once unthinkable, it’s now common in South Africa
- Intelligent Buildings To Smooth GCC’s Path To Net Zero