Togo Smart E-Drive Market (2026-2032) | Pricing Analysis, Size, Segmentation, Forecast, Competition, Value, Revenue, Restraints, Competitive, Drivers, Challenges, Industry, Companies, Strategy, Analysis, Strategic Insights, Growth, Demand, Investment Trends, Outlook, Trends, Share, Segments, Supply, Consumer Insights, Opportunities
Market Forecast By Component Type (Battery Pack, Motor Controller, Inverter, Transmission System, Power Electronics), By Vehicle Type (Passenger Vehicles, Electric Buses, Commercial EVs, Hybrid Electric Vehicles, Off-Road Electric Vehicles), By Motor Type (Permanent Magnet Motors, Induction Motors, Axial Flux Motors, Switched Reluctance, Brushless DC Motors), By Battery Type (Lithium-Ion Batteries, Solid-State Batteries, Nickel-Metal Hydride, Hydrogen Fuel Cells, Graphene Batteries), By End User (OEMs, Ride-Sharing Companies, Fleet Owners, Logistics Companies, Autonomous Vehicles) And Competitive Landscape
| Product Code: ETC10821936 | Publication Date: Apr 2025 | Updated Date: Apr 2026 | Product Type: Market Research Report | |
| Publisher: 6Wresearch | No. of Pages: 65 | No. of Figures: 34 | No. of Tables: 19 | |
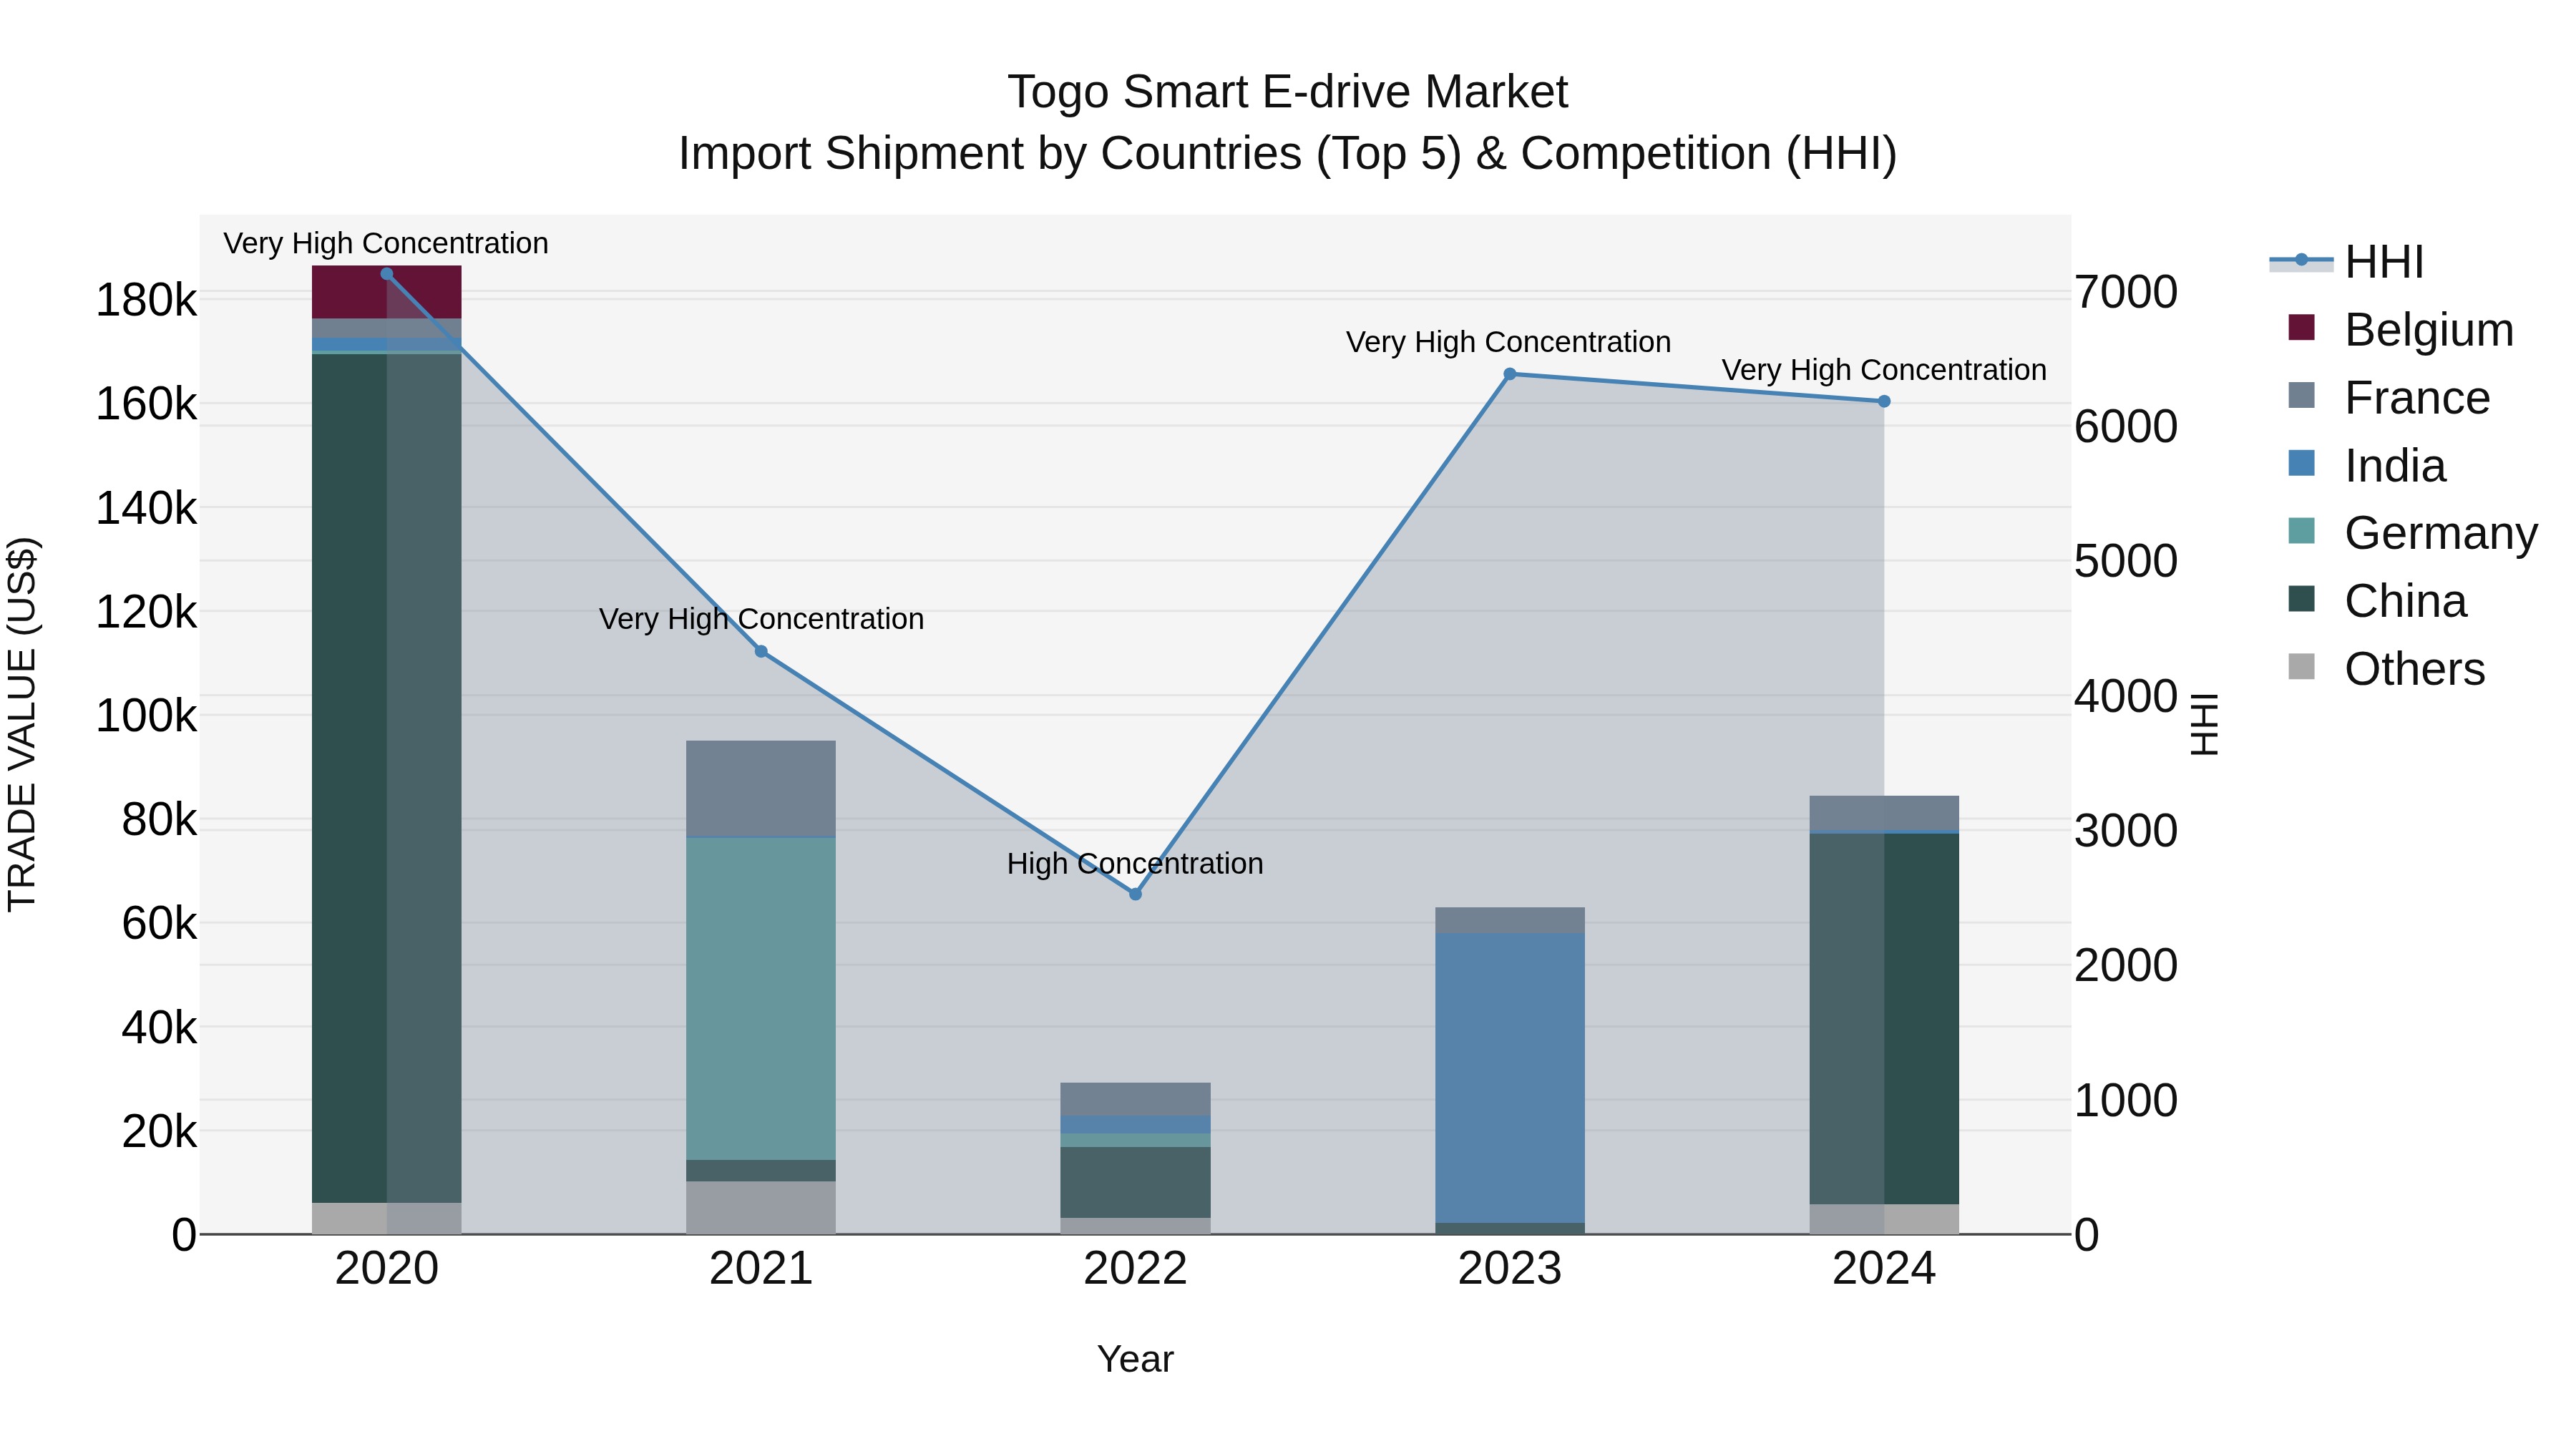
Togo Smart E Drive Market Top 5 Importing Countries and Market Competition (HHI) Analysis
Togo`s smart e-drive import market saw a significant growth spurt in 2024, with top exporters being China, France, Italy, Turkey, and Japan. Despite a high concentration level, the market experienced a negative CAGR of -17.96% from 2020 to 2024. However, there was a notable uptick in growth from 2023 to 2024, with a growth rate of 34.19%. This suggests a potential shift in market dynamics and increasing demand for smart e-drive technologies in Togo.
Key Highlights of the Report:
- Togo Smart E-Drive Market Outlook
- Market Size of Togo Smart E-Drive Market, 2025
- Forecast of Togo Smart E-Drive Market, 2032
- Historical Data and Forecast of Togo Smart E-Drive Revenues & Volume for the Period 2022 - 2032F
- Togo Smart E-Drive Market Trend Evolution
- Togo Smart E-Drive Market Drivers and Challenges
- Togo Smart E-Drive Price Trends
- Togo Smart E-Drive Porter's Five Forces
- Togo Smart E-Drive Industry Life Cycle
- Historical Data and Forecast of Togo Smart E-Drive Market Revenues & Volume By Component Type for the Period 2022 - 2032F
- Historical Data and Forecast of Togo Smart E-Drive Market Revenues & Volume By Battery Pack for the Period 2022 - 2032F
- Historical Data and Forecast of Togo Smart E-Drive Market Revenues & Volume By Motor Controller for the Period 2022 - 2032F
- Historical Data and Forecast of Togo Smart E-Drive Market Revenues & Volume By Inverter for the Period 2022 - 2032F
- Historical Data and Forecast of Togo Smart E-Drive Market Revenues & Volume By Transmission System for the Period 2022 - 2032F
- Historical Data and Forecast of Togo Smart E-Drive Market Revenues & Volume By Power Electronics for the Period 2022 - 2032F
- Historical Data and Forecast of Togo Smart E-Drive Market Revenues & Volume By Vehicle Type for the Period 2022 - 2032F
- Historical Data and Forecast of Togo Smart E-Drive Market Revenues & Volume By Passenger Vehicles for the Period 2022 - 2032F
- Historical Data and Forecast of Togo Smart E-Drive Market Revenues & Volume By Electric Buses for the Period 2022 - 2032F
- Historical Data and Forecast of Togo Smart E-Drive Market Revenues & Volume By Commercial EVs for the Period 2022 - 2032F
- Historical Data and Forecast of Togo Smart E-Drive Market Revenues & Volume By Hybrid Electric Vehicles for the Period 2022 - 2032F
- Historical Data and Forecast of Togo Smart E-Drive Market Revenues & Volume By Off-Road Electric Vehicles for the Period 2022 - 2032F
- Historical Data and Forecast of Togo Smart E-Drive Market Revenues & Volume By Motor Type for the Period 2022 - 2032F
- Historical Data and Forecast of Togo Smart E-Drive Market Revenues & Volume By Permanent Magnet Motors for the Period 2022 - 2032F
- Historical Data and Forecast of Togo Smart E-Drive Market Revenues & Volume By Induction Motors for the Period 2022 - 2032F
- Historical Data and Forecast of Togo Smart E-Drive Market Revenues & Volume By Axial Flux Motors for the Period 2022 - 2032F
- Historical Data and Forecast of Togo Smart E-Drive Market Revenues & Volume By Switched Reluctance for the Period 2022 - 2032F
- Historical Data and Forecast of Togo Smart E-Drive Market Revenues & Volume By Brushless DC Motors for the Period 2022 - 2032F
- Historical Data and Forecast of Togo Smart E-Drive Market Revenues & Volume By Battery Type for the Period 2022 - 2032F
- Historical Data and Forecast of Togo Smart E-Drive Market Revenues & Volume By Lithium-Ion Batteries for the Period 2022 - 2032F
- Historical Data and Forecast of Togo Smart E-Drive Market Revenues & Volume By Solid-State Batteries for the Period 2022 - 2032F
- Historical Data and Forecast of Togo Smart E-Drive Market Revenues & Volume By Nickel-Metal Hydride for the Period 2022 - 2032F
- Historical Data and Forecast of Togo Smart E-Drive Market Revenues & Volume By Hydrogen Fuel Cells for the Period 2022 - 2032F
- Historical Data and Forecast of Togo Smart E-Drive Market Revenues & Volume By Graphene Batteries for the Period 2022 - 2032F
- Historical Data and Forecast of Togo Smart E-Drive Market Revenues & Volume By End User for the Period 2022 - 2032F
- Historical Data and Forecast of Togo Smart E-Drive Market Revenues & Volume By OEMs for the Period 2022 - 2032F
- Historical Data and Forecast of Togo Smart E-Drive Market Revenues & Volume By Ride-Sharing Companies for the Period 2022 - 2032F
- Historical Data and Forecast of Togo Smart E-Drive Market Revenues & Volume By Fleet Owners for the Period 2022 - 2032F
- Historical Data and Forecast of Togo Smart E-Drive Market Revenues & Volume By Logistics Companies for the Period 2022 - 2032F
- Historical Data and Forecast of Togo Smart E-Drive Market Revenues & Volume By Autonomous Vehicles for the Period 2022 - 2032F
- Togo Smart E-Drive Import Export Trade Statistics
- Market Opportunity Assessment By Component Type
- Market Opportunity Assessment By Vehicle Type
- Market Opportunity Assessment By Motor Type
- Market Opportunity Assessment By Battery Type
- Market Opportunity Assessment By End User
- Togo Smart E-Drive Top Companies Market Share
- Togo Smart E-Drive Competitive Benchmarking By Technical and Operational Parameters
- Togo Smart E-Drive Company Profiles
- Togo Smart E-Drive Key Strategic Recommendations
Frequently Asked Questions About the Market Study (FAQs):
6Wresearch actively monitors the Togo Smart E-Drive Market and publishes its comprehensive annual report, highlighting emerging trends, growth drivers, revenue analysis, and forecast outlook. Our insights help businesses to make data-backed strategic decisions with ongoing market dynamics. Our analysts track relevent industries related to the Togo Smart E-Drive Market, allowing our clients with actionable intelligence and reliable forecasts tailored to emerging regional needs.
Yes, we provide customisation as per your requirements. To learn more, feel free to contact us on sales@6wresearch.com
1 Executive Summary |
2 Introduction |
2.1 Key Highlights of the Report |
2.2 Report Description |
2.3 Market Scope & Segmentation |
2.4 Research Methodology |
2.5 Assumptions |
3 Togo Smart E-Drive Market Overview |
3.1 Togo Country Macro Economic Indicators |
3.2 Togo Smart E-Drive Market Revenues & Volume, 2022 & 2032F |
3.3 Togo Smart E-Drive Market - Industry Life Cycle |
3.4 Togo Smart E-Drive Market - Porter's Five Forces |
3.5 Togo Smart E-Drive Market Revenues & Volume Share, By Component Type, 2022 & 2032F |
3.6 Togo Smart E-Drive Market Revenues & Volume Share, By Vehicle Type, 2022 & 2032F |
3.7 Togo Smart E-Drive Market Revenues & Volume Share, By Motor Type, 2022 & 2032F |
3.8 Togo Smart E-Drive Market Revenues & Volume Share, By Battery Type, 2022 & 2032F |
3.9 Togo Smart E-Drive Market Revenues & Volume Share, By End User, 2022 & 2032F |
4 Togo Smart E-Drive Market Dynamics |
4.1 Impact Analysis |
4.2 Market Drivers |
4.2.1 Increasing demand for eco-friendly transportation solutions |
4.2.2 Government initiatives and incentives promoting electric vehicles |
4.2.3 Technological advancements in electric vehicle infrastructure and battery technology |
4.3 Market Restraints |
4.3.1 High initial cost of electric vehicles compared to conventional vehicles |
4.3.2 Limited availability of charging infrastructure |
4.3.3 Range anxiety among consumers regarding electric vehicle batteries |
5 Togo Smart E-Drive Market Trends |
6 Togo Smart E-Drive Market, By Types |
6.1 Togo Smart E-Drive Market, By Component Type |
6.1.1 Overview and Analysis |
6.1.2 Togo Smart E-Drive Market Revenues & Volume, By Component Type, 2022 - 2032F |
6.1.3 Togo Smart E-Drive Market Revenues & Volume, By Battery Pack, 2022 - 2032F |
6.1.4 Togo Smart E-Drive Market Revenues & Volume, By Motor Controller, 2022 - 2032F |
6.1.5 Togo Smart E-Drive Market Revenues & Volume, By Inverter, 2022 - 2032F |
6.1.6 Togo Smart E-Drive Market Revenues & Volume, By Transmission System, 2022 - 2032F |
6.1.7 Togo Smart E-Drive Market Revenues & Volume, By Power Electronics, 2022 - 2032F |
6.2 Togo Smart E-Drive Market, By Vehicle Type |
6.2.1 Overview and Analysis |
6.2.2 Togo Smart E-Drive Market Revenues & Volume, By Passenger Vehicles, 2022 - 2032F |
6.2.3 Togo Smart E-Drive Market Revenues & Volume, By Electric Buses, 2022 - 2032F |
6.2.4 Togo Smart E-Drive Market Revenues & Volume, By Commercial EVs, 2022 - 2032F |
6.2.5 Togo Smart E-Drive Market Revenues & Volume, By Hybrid Electric Vehicles, 2022 - 2032F |
6.2.6 Togo Smart E-Drive Market Revenues & Volume, By Off-Road Electric Vehicles, 2022 - 2032F |
6.3 Togo Smart E-Drive Market, By Motor Type |
6.3.1 Overview and Analysis |
6.3.2 Togo Smart E-Drive Market Revenues & Volume, By Permanent Magnet Motors, 2022 - 2032F |
6.3.3 Togo Smart E-Drive Market Revenues & Volume, By Induction Motors, 2022 - 2032F |
6.3.4 Togo Smart E-Drive Market Revenues & Volume, By Axial Flux Motors, 2022 - 2032F |
6.3.5 Togo Smart E-Drive Market Revenues & Volume, By Switched Reluctance, 2022 - 2032F |
6.3.6 Togo Smart E-Drive Market Revenues & Volume, By Brushless DC Motors, 2022 - 2032F |
6.4 Togo Smart E-Drive Market, By Battery Type |
6.4.1 Overview and Analysis |
6.4.2 Togo Smart E-Drive Market Revenues & Volume, By Lithium-Ion Batteries, 2022 - 2032F |
6.4.3 Togo Smart E-Drive Market Revenues & Volume, By Solid-State Batteries, 2022 - 2032F |
6.4.4 Togo Smart E-Drive Market Revenues & Volume, By Nickel-Metal Hydride, 2022 - 2032F |
6.4.5 Togo Smart E-Drive Market Revenues & Volume, By Hydrogen Fuel Cells, 2022 - 2032F |
6.4.6 Togo Smart E-Drive Market Revenues & Volume, By Graphene Batteries, 2022 - 2032F |
6.5 Togo Smart E-Drive Market, By End User |
6.5.1 Overview and Analysis |
6.5.2 Togo Smart E-Drive Market Revenues & Volume, By OEMs, 2022 - 2032F |
6.5.3 Togo Smart E-Drive Market Revenues & Volume, By Ride-Sharing Companies, 2022 - 2032F |
6.5.4 Togo Smart E-Drive Market Revenues & Volume, By Fleet Owners, 2022 - 2032F |
6.5.5 Togo Smart E-Drive Market Revenues & Volume, By Logistics Companies, 2022 - 2032F |
6.5.6 Togo Smart E-Drive Market Revenues & Volume, By Autonomous Vehicles, 2022 - 2032F |
7 Togo Smart E-Drive Market Import-Export Trade Statistics |
7.1 Togo Smart E-Drive Market Export to Major Countries |
7.2 Togo Smart E-Drive Market Imports from Major Countries |
8 Togo Smart E-Drive Market Key Performance Indicators |
8.1 Average charging time for smart e-drive vehicles |
8.2 Number of charging stations per capita in key markets |
8.3 Percentage of government subsidies allocated to electric vehicle development |
8.4 Adoption rate of smart e-drive vehicles in urban areas |
8.5 Average distance traveled per charge for smart e-drive vehicles |
9 Togo Smart E-Drive Market - Opportunity Assessment |
9.1 Togo Smart E-Drive Market Opportunity Assessment, By Component Type, 2022 & 2032F |
9.2 Togo Smart E-Drive Market Opportunity Assessment, By Vehicle Type, 2022 & 2032F |
9.3 Togo Smart E-Drive Market Opportunity Assessment, By Motor Type, 2022 & 2032F |
9.4 Togo Smart E-Drive Market Opportunity Assessment, By Battery Type, 2022 & 2032F |
9.5 Togo Smart E-Drive Market Opportunity Assessment, By End User, 2022 & 2032F |
10 Togo Smart E-Drive Market - Competitive Landscape |
10.1 Togo Smart E-Drive Market Revenue Share, By Companies, 2025 |
10.2 Togo Smart E-Drive Market Competitive Benchmarking, By Operating and Technical Parameters |
11 Company Profiles |
12 Recommendations |
13 Disclaimer |
Export potential assessment - trade Analytics for 2030
Export potential enables firms to identify high-growth global markets with greater confidence by combining advanced trade intelligence with a structured quantitative methodology. The framework analyzes emerging demand trends and country-level import patterns while integrating macroeconomic and trade datasets such as GDP and population forecasts, bilateral import–export flows, tariff structures, elasticity differentials between developed and developing economies, geographic distance, and import demand projections. Using weighted trade values from 2020–2024 as the base period to project country-to-country export potential for 2030, these inputs are operationalized through calculated drivers such as gravity model parameters, tariff impact factors, and projected GDP per-capita growth. Through an analysis of hidden potentials, demand hotspots, and market conditions that are most favorable to success, this method enables firms to focus on target countries, maximize returns, and global expansion with data, backed by accuracy.
By factoring in the projected importer demand gap that is currently unmet and could be potential opportunity, it identifies the potential for the Exporter (Country) among 190 countries, against the general trade analysis, which identifies the biggest importer or exporter.
To discover high-growth global markets and optimize your business strategy:
Click Here
Pricing
- Single User License$ 1,995
- Department License$ 2,400
- Site License$ 3,120
- Global License$ 3,795

Search
Thought Leadership and Analyst Meet


Our Clients
Latest Reports
- United Kingdom (UK) Outdoor Cooking Equipment Market (2026-2032) | Investment Opportunities, Outlook, Growth, Competition, Trends, Pricing, Demand, Insights, Challenges, Drivers, Size, Restraints, segmentation, Value, Share, Forecast, Companies, Analysis, Revenue, Strategy
- United Arab Emirates (UAE) Outdoor Cooking Equipment Market (2026-2032) | Challenges, Value, Restraints, Growth, Competition, Revenue, Trends, Outlook, Analysis, Drivers, Share, Investment Opportunities, Strategy, Demand, Companies, Forecast, Pricing, segmentation, Size, Insights
- Vietnam Outdoor Cooking Equipment Market (2026-2032) | Demand, Investment Opportunities, Growth, Pricing, Trends, Restraints, Competition, Outlook, Drivers, Strategy, Challenges, Revenue, Analysis, segmentation, Value, Size, Share, Insights, Companies, Forecast
- Venezuela Outdoor Cooking Equipment Market (2026-2032) | Challenges, Revenue, Demand, Value, Pricing, Strategy, Competition, Analysis, Companies, Insights, Growth, Outlook, Forecast, Size, Restraints, segmentation, Drivers, Trends, Investment Opportunities, Share
- Uganda Outdoor Cooking Equipment Market (2026-2032) | Drivers, Pricing, Challenges, Value, Growth, Companies, segmentation, Strategy, Analysis, Demand, Outlook, Size, Competition, Restraints, Revenue, Forecast, Investment Opportunities, Insights, Trends, Share
- Turkey Outdoor Cooking Equipment Market (2026-2032) | Size, Competition, Outlook, Strategy, Forecast, Drivers, Trends, Companies, Revenue, Growth, Analysis, segmentation, Insights, Pricing, Restraints, Demand, Investment Opportunities, Value, Share, Challenges
- Tunisia Outdoor Cooking Equipment Market (2026-2032) | Analysis, Share, Pricing, Trends, Size, Outlook, Revenue, segmentation, Demand, Insights, Investment Opportunities, Restraints, Growth, Forecast, Competition, Drivers, Challenges, Companies, Strategy, Value
- Thailand Outdoor Cooking Equipment Market (2026-2032) | Growth, Revenue, Insights, Companies, Drivers, Strategy, Forecast, Size, Analysis, segmentation, Trends, Challenges, Competition, Share, Investment Opportunities, Demand, Pricing, Value, Restraints, Outlook
- Tanzania Outdoor Cooking Equipment Market (2026-2032) | Share, Drivers, Forecast, Revenue, Growth, Outlook, Analysis, Investment Opportunities, Restraints, segmentation, Demand, Pricing, Size, Insights, Challenges, Competition, Companies, Value, Trends, Strategy
- Tajikistan Outdoor Cooking Equipment Market (2026-2032) | Value, Pricing, Companies, Share, Strategy, Revenue, Investment Opportunities, Demand, Forecast, Size, Competition, Challenges, Growth, Insights, Restraints, segmentation, Analysis, Trends, Drivers, Outlook
Industry Events and Analyst Meet

HIMTEX 2026

India Refining Summit 2026

India EV Show 2026

EV tech India Expo 2026

Auto Tech Asia 2026
Whitepaper
- Middle East & Africa Commercial Security Market Click here to view more.
- Middle East & Africa Fire Safety Systems & Equipment Market Click here to view more.
- GCC Drone Market Click here to view more.
- Middle East Lighting Fixture Market Click here to view more.
- GCC Physical & Perimeter Security Market Click here to view more.
6WResearch In News
- Doha a strategic location for EV manufacturing hub: IPA Qatar
- Demand for luxury TVs surging in the GCC, says Samsung
- Empowering Growth: The Thriving Journey of Bangladesh’s Cable Industry
- Demand for luxury TVs surging in the GCC, says Samsung
- Video call with a traditional healer? Once unthinkable, it’s now common in South Africa
- Intelligent Buildings To Smooth GCC’s Path To Net Zero