Tunisia Digital Remittance Market Outlook | Growth, Size, Companies, Revenue, Forecast, Share, Industry, Value, Analysis, Trends & COVID-19 IMPACT
Market Forecast By Type (Inward Digital Remittance, Outward Digital Remittance), By Channel (Banks, Money Transfer Operators, Online Platforms, Others), By End-use (Migrant Labor Workforce, Personal, Small Businesses, Others) And Competitive Landscape
| Product Code: ETC420770 | Publication Date: Oct 2022 | Updated Date: Aug 2025 | Product Type: Market Research Report | |
| Publisher: 6Wresearch | Author: Shubham Padhi | No. of Pages: 75 | No. of Figures: 35 | No. of Tables: 20 |
Tunisia Digital Remittance Market Size Growth Rate
The Tunisia Digital Remittance Market is likely to experience consistent growth rate gains over the period 2025 to 2029. From 0.00% in 2025, the growth rate steadily ascends to 0.00% in 2029.
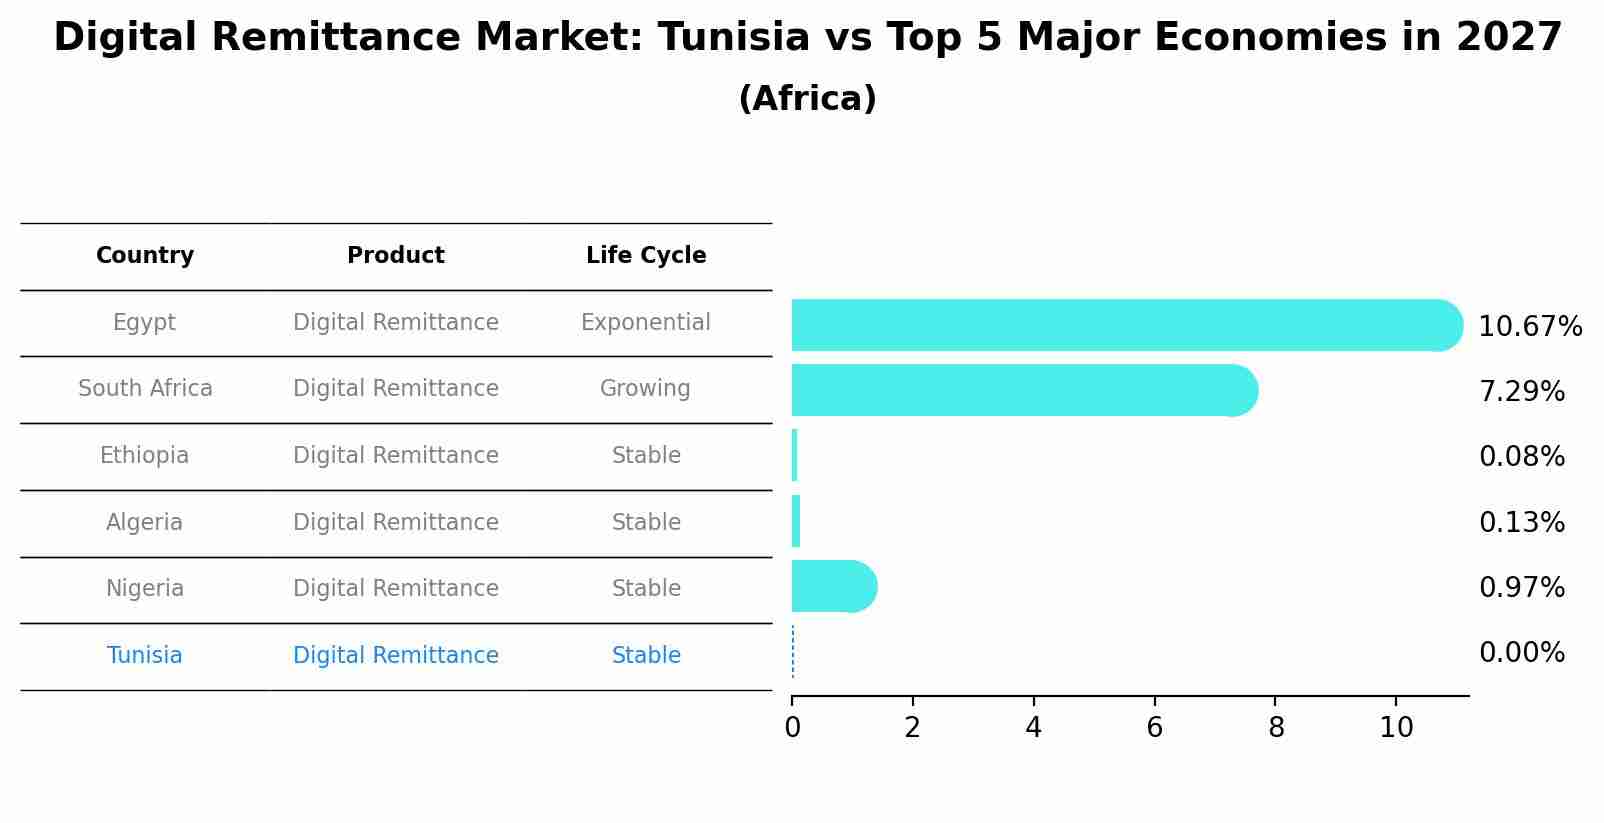
Digital Remittance Market: Tunisia vs Top 5 Major Economies in 2027 (Africa)
By 2027, the Digital Remittance market in Tunisia is anticipated to reach a growth rate of 0.00%, as part of an increasingly competitive Africa region, where Egypt remains at the forefront, supported by South Africa, Ethiopia, Algeria and Nigeria, driving innovations and market adoption across sectors.
Tunisia Digital Remittance Market Overview
The Tunisia Digital Remittance Market involves platforms and services that enable the transfer of money across borders using digital channels.
Drivers of the market
The digital remittance market in Tunisia is experiencing growth due to the increasing need for convenient and cost-effective money transfer solutions. The rise of mobile banking and digital wallets has made it easier for people to send and receive money across borders. The growing migrant population and the emphasis on financial inclusion support market growth. Advances in digital payment technologies that enhance security and transaction speed further propel the market.
Challenges of the market
In Tunisia, the digital remittance market confronts challenges such as regulatory compliance, transaction security, and customer trust. Ensuring secure and efficient cross-border money transfers requires compliance with anti-money laundering regulations and data protection laws. Addressing currency exchange volatility and market competition from fintech startups require innovative digital payment solutions and partnerships with financial institutions to expand market reach and enhance service delivery.
Government Policy of the market
Tunisias government supports the digital remittance market by implementing policies that enhance financial inclusion and reduce transaction costs. Regulations aim to streamline cross-border payments, ensure security, and promote competition among service providers.
Key Highlights of the Report:
- Tunisia Digital Remittance Market Outlook
- Market Size of Tunisia Digital Remittance Market, 2024
- Forecast of Tunisia Digital Remittance Market, 2031
- Historical Data and Forecast of Tunisia Digital Remittance Revenues & Volume for the Period 2018 - 2031
- Tunisia Digital Remittance Market Trend Evolution
- Tunisia Digital Remittance Market Drivers and Challenges
- Tunisia Digital Remittance Price Trends
- Tunisia Digital Remittance Porter's Five Forces
- Tunisia Digital Remittance Industry Life Cycle
- Historical Data and Forecast of Tunisia Digital Remittance Market Revenues & Volume By Type for the Period 2018 - 2031
- Historical Data and Forecast of Tunisia Digital Remittance Market Revenues & Volume By Inward Digital Remittance for the Period 2018 - 2031
- Historical Data and Forecast of Tunisia Digital Remittance Market Revenues & Volume By Outward Digital Remittance for the Period 2018 - 2031
- Historical Data and Forecast of Tunisia Digital Remittance Market Revenues & Volume By Channel for the Period 2018 - 2031
- Historical Data and Forecast of Tunisia Digital Remittance Market Revenues & Volume By Banks for the Period 2018 - 2031
- Historical Data and Forecast of Tunisia Digital Remittance Market Revenues & Volume By Money Transfer Operators for the Period 2018 - 2031
- Historical Data and Forecast of Tunisia Digital Remittance Market Revenues & Volume By Online Platforms for the Period 2018 - 2031
- Historical Data and Forecast of Tunisia Digital Remittance Market Revenues & Volume By Others for the Period 2018 - 2031
- Historical Data and Forecast of Tunisia Digital Remittance Market Revenues & Volume By End-use for the Period 2018 - 2031
- Historical Data and Forecast of Tunisia Digital Remittance Market Revenues & Volume By Migrant Labor Workforce for the Period 2018 - 2031
- Historical Data and Forecast of Tunisia Digital Remittance Market Revenues & Volume By Personal for the Period 2018 - 2031
- Historical Data and Forecast of Tunisia Digital Remittance Market Revenues & Volume By Small Businesses for the Period 2018 - 2031
- Historical Data and Forecast of Tunisia Digital Remittance Market Revenues & Volume By Others for the Period 2018 - 2031
- Tunisia Digital Remittance Import Export Trade Statistics
- Market Opportunity Assessment By Type
- Market Opportunity Assessment By Channel
- Market Opportunity Assessment By End-use
- Tunisia Digital Remittance Top Companies Market Share
- Tunisia Digital Remittance Competitive Benchmarking By Technical and Operational Parameters
- Tunisia Digital Remittance Company Profiles
- Tunisia Digital Remittance Key Strategic Recommendations
Frequently Asked Questions About the Market Study (FAQs):
6Wresearch actively monitors the Tunisia Digital Remittance Market and publishes its comprehensive annual report, highlighting emerging trends, growth drivers, revenue analysis, and forecast outlook. Our insights help businesses to make data-backed strategic decisions with ongoing market dynamics. Our analysts track relevent industries related to the Tunisia Digital Remittance Market, allowing our clients with actionable intelligence and reliable forecasts tailored to emerging regional needs.
Yes, we provide customisation as per your requirements. To learn more, feel free to contact us on sales@6wresearch.com
1 Executive Summary |
2 Introduction |
2.1 Key Highlights of the Report |
2.2 Report Description |
2.3 Market Scope & Segmentation |
2.4 Research Methodology |
2.5 Assumptions |
3 Tunisia Digital Remittance Market Overview |
3.1 Tunisia Country Macro Economic Indicators |
3.2 Tunisia Digital Remittance Market Revenues & Volume, 2021 & 2031F |
3.3 Tunisia Digital Remittance Market - Industry Life Cycle |
3.4 Tunisia Digital Remittance Market - Porter's Five Forces |
3.5 Tunisia Digital Remittance Market Revenues & Volume Share, By Type, 2021 & 2031F |
3.6 Tunisia Digital Remittance Market Revenues & Volume Share, By Channel, 2021 & 2031F |
3.7 Tunisia Digital Remittance Market Revenues & Volume Share, By End-use, 2021 & 2031F |
4 Tunisia Digital Remittance Market Dynamics |
4.1 Impact Analysis |
4.2 Market Drivers |
4.2.1 Increasing smartphone penetration in Tunisia |
4.2.2 Growing internet connectivity and access to digital platforms |
4.2.3 Government initiatives promoting digital financial services |
4.3 Market Restraints |
4.3.1 Limited awareness and trust in digital remittance platforms |
4.3.2 Regulatory challenges and compliance issues |
4.3.3 High competition from traditional remittance services |
5 Tunisia Digital Remittance Market Trends |
6 Tunisia Digital Remittance Market, By Types |
6.1 Tunisia Digital Remittance Market, By Type |
6.1.1 Overview and Analysis |
6.1.2 Tunisia Digital Remittance Market Revenues & Volume, By Type, 2021-2031F |
6.1.3 Tunisia Digital Remittance Market Revenues & Volume, By Inward Digital Remittance, 2021-2031F |
6.1.4 Tunisia Digital Remittance Market Revenues & Volume, By Outward Digital Remittance, 2021-2031F |
6.2 Tunisia Digital Remittance Market, By Channel |
6.2.1 Overview and Analysis |
6.2.2 Tunisia Digital Remittance Market Revenues & Volume, By Banks, 2021-2031F |
6.2.3 Tunisia Digital Remittance Market Revenues & Volume, By Money Transfer Operators, 2021-2031F |
6.2.4 Tunisia Digital Remittance Market Revenues & Volume, By Online Platforms, 2021-2031F |
6.2.5 Tunisia Digital Remittance Market Revenues & Volume, By Others, 2021-2031F |
6.3 Tunisia Digital Remittance Market, By End-use |
6.3.1 Overview and Analysis |
6.3.2 Tunisia Digital Remittance Market Revenues & Volume, By Migrant Labor Workforce, 2021-2031F |
6.3.3 Tunisia Digital Remittance Market Revenues & Volume, By Personal, 2021-2031F |
6.3.4 Tunisia Digital Remittance Market Revenues & Volume, By Small Businesses, 2021-2031F |
6.3.5 Tunisia Digital Remittance Market Revenues & Volume, By Others, 2021-2031F |
7 Tunisia Digital Remittance Market Import-Export Trade Statistics |
7.1 Tunisia Digital Remittance Market Export to Major Countries |
7.2 Tunisia Digital Remittance Market Imports from Major Countries |
8 Tunisia Digital Remittance Market Key Performance Indicators |
8.1 Number of active users on digital remittance platforms in Tunisia |
8.2 Average transaction value on digital remittance platforms |
8.3 Percentage of remittances processed through digital channels |
8.4 Customer satisfaction and retention rates |
8.5 Adoption rate of new digital remittance features and services |
9 Tunisia Digital Remittance Market - Opportunity Assessment |
9.1 Tunisia Digital Remittance Market Opportunity Assessment, By Type, 2021 & 2031F |
9.2 Tunisia Digital Remittance Market Opportunity Assessment, By Channel, 2021 & 2031F |
9.3 Tunisia Digital Remittance Market Opportunity Assessment, By End-use, 2021 & 2031F |
10 Tunisia Digital Remittance Market - Competitive Landscape |
10.1 Tunisia Digital Remittance Market Revenue Share, By Companies, 2024 |
10.2 Tunisia Digital Remittance Market Competitive Benchmarking, By Operating and Technical Parameters |
11 Company Profiles |
12 Recommendations |
13 Disclaimer |
Global Go To Market Strategy - 2030
Export potential enables firms to identify high-growth global markets with greater confidence by combining advanced trade intelligence with a structured quantitative methodology. The framework analyzes emerging demand trends and country-level import patterns while integrating macroeconomic and trade datasets such as GDP and population forecasts, bilateral import–export flows, tariff structures, elasticity differentials between developed and developing economies, geographic distance, and import demand projections. Using weighted trade values from 2020–2024 as the base period to project country-to-country export potential for 2030, these inputs are operationalized through calculated drivers such as gravity model parameters, tariff impact factors, and projected GDP per-capita growth. Through an analysis of hidden potentials, demand hotspots, and market conditions that are most favorable to success, this method enables firms to focus on target countries, maximize returns, and global expansion with data, backed by accuracy.
By factoring in the projected importer demand gap that is currently unmet and could be potential opportunity, it identifies the potential for the Exporter (Country) among 190 countries, against the general trade analysis, which identifies the biggest importer or exporter.
To discover high-growth global markets and optimize your business strategy:
Click Here
Pricing
- Single User License$ 1,995
- Department License$ 2,400
- Site License$ 3,120
- Global License$ 3,795

Leadership Perspectives from Industry Events
Search
Thought Leadership and Analyst Meet


Our Clients
6WResearch In News
- India Export Attractiveness Tracker 2026
- India Air Conditioner Market Set for Strong Rebound in 2026 After Weather-Led Correction and GST-Driven Recovery: 6Wresearch
- ADAS in India: How Automatic Emergency Braking, Blind Spot Detection & Driver Monitoring are Transforming Road Safety
- Doha a strategic location for EV manufacturing hub: IPA Qatar
- Demand for luxury TVs surging in the GCC, says Samsung
- Empowering Growth: The Thriving Journey of Bangladesh’s Cable Industry
Latest Reports
- Qatar Access and Home Network Market (2026-2032)
- Nicaragua RPG Gaming Market (2026-2032)
- New Zealand RPG Gaming Market (2026-2032)
- Netherlands RPG Gaming Market (2026-2032)
- Nauru RPG Gaming Market (2026-2032)
- Namibia RPG Gaming Market (2026-2032)
- Mozambique RPG Gaming Market (2026-2032)
- Montenegro RPG Gaming Market (2026-2032)
- Mongolia RPG Gaming Market (2026-2032)
- Monaco RPG Gaming Market (2026-2032)
Industry Events and Analyst Meet

EV India Expo 2026

HIMTEX 2026

India Refining Summit 2026

India EV Show 2026

EV tech India Expo 2026
Whitepaper
- Middle East & Africa Commercial Security Market Click here to view more.
- Middle East & Africa Fire Safety Systems & Equipment Market Click here to view more.
- GCC Drone Market Click here to view more.
- Middle East Lighting Fixture Market Click here to view more.
- GCC Physical & Perimeter Security Market Click here to view more.