Uganda Milk Market (2026-2032) | Size & Revenue, Competitive Landscape, Segmentation, Outlook, Industry, Trends, Forecast, Value, Companies, Growth, Share, Analysis
Market Forecast By Product Type (Skimmed milk powder, Liquid milk, Whey protein, Butter, Whey Milk Powder, Yogurt, Cheese, Others), By Distribution Channel (Convenience Stores, Supermarkets & Hypermarkets, Online and Others) And Competitive Landscape
| Product Code: ETC9884003 | Publication Date: Sep 2024 | Updated Date: Mar 2026 | Product Type: Market Research Report | |
| Publisher: 6Wresearch | Author: Summon Dutta | No. of Pages: 89 | No. of Figures: 25 | No. of Tables: 14 |
Topics Covered in Uganda Milk Market Report
Uganda Milk Market Report thoroughly covers the market by product type, by distribution channels, by price positioning, by packaging format, by market structure, and by end-user. Uganda Milk Market Outlook report provides an unbiased and detailed analysis of the ongoing Uganda Milk Market trends, opportunities/high growth areas, and market drivers. This would help stakeholders devise and align their market strategies according to the current and future market dynamics.
Uganda Milk Market Synopsis
The Uganda’s milk market experienced expansion between 2022 and 2025, driven by strong production-led growth, accelerating commercialization, and strategic export development. Annual milk production surged, transforming the sector from a subsistence-based system into a modern commercial industry. This production momentum has directly translated into strengthened export performance, with dairy export earnings increasing nearly eightfold. These factors collectively position Uganda's expanding production base and sector modernization as key drivers of long-term market expansion.
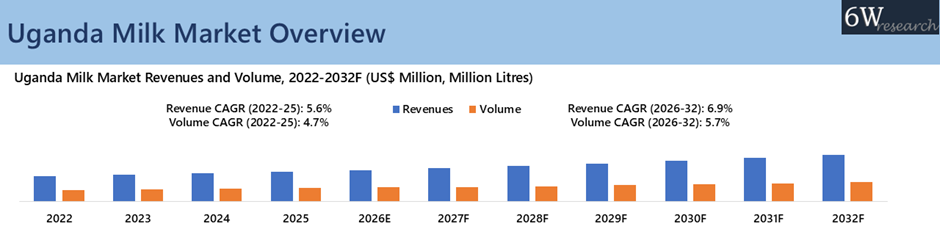
According to 6Wresearch, Uganda Milk Market revenue size and volume size is projected to grow at a CAGR of 6.9% and 5.7% during 2026-2032, respectively. Uganda’s milk market is expected to maintain positive momentum, supported by expanding dairy infrastructure, strengthening value chain integration, and rising hospitality-driven demand. The number of registered dairy processors increased, reinforcing formal processing capacity and sector commercialization. At the same time, milk collection centers expanded, while milk coolers also increased tremendously, boosting total cooling capacity and improving raw milk preservation and quality control.
On the demand side, Uganda’s HORECA sector continues to strengthen, with food and beverage services holding high inbound tourism expenditure in 2023, while total tourism expenditure also increased, with food and beverage services contribution. Collectively, strengthening processing infrastructure and sustained expansion in hospitality and foodservice activity position Uganda’s milk market for continued structural growth through 2032.
Market Segmentation By Product Type
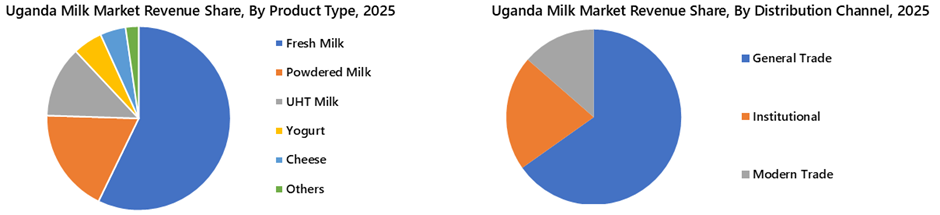
Yoghurt is expected to be the key growth engine, showing the strongest growth momentum in both revenue and volume during the forecast period, driven by rising urbanization, growing preference for value-added and convenient dairy, increasing health and nutrition awareness (including probiotic/fortified offerings), and expanding cold-chain and modern retail penetration.
Market Segmentation By Distribution Channels
The Institutional segment (Schools, Hotels, Restaurants, catering services, and other bulk consumers) is projected to register the fastest growth during the forecast period in Uganda’s milk distribution landscape. This strong expansion is supported by the increasing number of private schools, universities, and boarding institutions that require consistent dairy supply, along with the steady development of the hospitality and food service sectors. Growth in tourism, urbanization, and organized food chains is further driving large-scale procurement of packaged and value-added dairy products. Additionally, rising preference for structured supply agreements and reliable quality standards is accelerating both revenue and volume growth within the institutional channel.
Market Segmentation By Price Positioning
The Mid-Range segment is projected to witness the highest growth during the forecast period in Uganda’s milk market by price positioning. This growth is primarily driven by rising middle-class income levels, increasing urbanization, and growing consumer preference for branded and hygienically packaged dairy products at affordable price points. Mid-range products effectively balance quality and affordability, making them attractive to price-sensitive yet quality-conscious consumers. Additionally, expanding modern retail presence and improved distribution networks are further supporting higher penetration and accelerating revenue and volume growth within the mid-range segment.
Market Segmentation By Packaging Format
The Cartons (Tetra Pak) segment is projected to witness the fastest growth during the forecast period in Uganda’s milk market by packaging format. This growth is driven by increasing consumer preference for hygienic, safe, and longer shelf-life packaging solutions. Tetra Pak cartons offer better product protection, convenience, and ease of storage compared to lose or traditional packaging formats. Rising urbanization, expanding modern retail channels, and growing awareness regarding food safety and quality standards are further supporting the shift toward packaged milk. Additionally, the demand for value-added and fortified dairy products is accelerating adoption of carton-based packaging, boosting both revenue and volume growth.
Market Segmentation By Market Structure
The Formal Market segment is projected to witness strong growth during the forecast period in Uganda’s milk market by market structure. This growth is driven by increasing consumer preference for branded, hygienically processed, and quality-certified dairy products. Rising urbanization, expanding modern retail networks, and improved cold-chain infrastructure are encouraging the shift from loose milk consumption to packaged alternatives. Additionally, stricter food safety regulations and growing awareness regarding health and product standardization are supporting the expansion of organized dairy processors, thereby accelerating revenue and volume growth within the formal market segment.
Market Segmentation By End-User
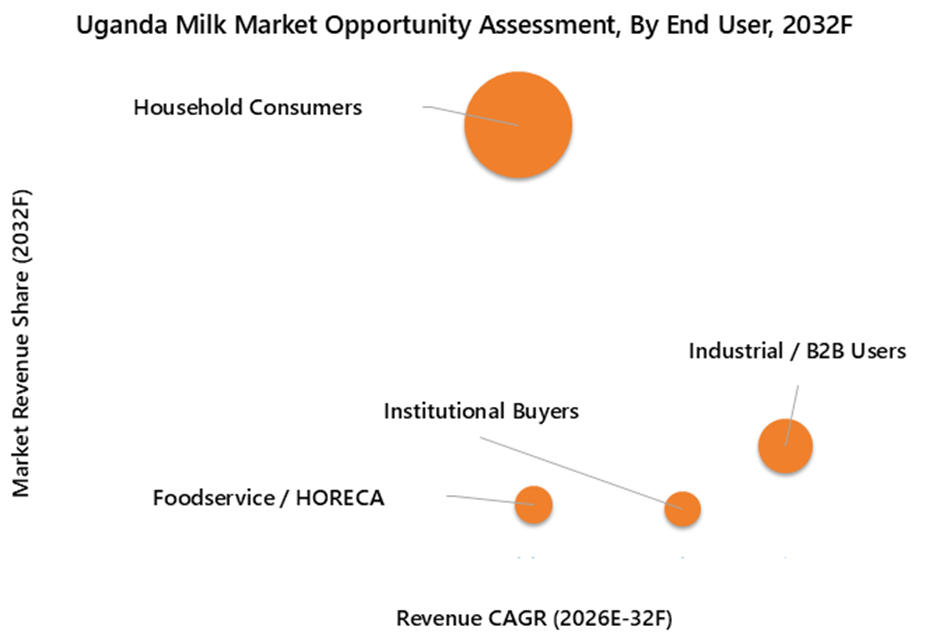
The Industrial / B2B Users segment is projected to witness steady growth during the forecast period in Uganda’s milk market by end user. Growth in this segment is driven by increasing demand from dairy processors, food and beverage manufacturers, bakeries, and confectionery producers that utilize milk as a key raw material. Rising production of value-added dairy products such as yogurt, cheese, flavored milk, and powdered milk is further supporting bulk procurement. Additionally, expansion of the food processing industry and growing investments in domestic manufacturing capacity are contributing to consistent revenue and volume growth within the Industrial / B2B segment.
Key Attractiveness of the Report
- 10 Years Market Numbers.
- Historical Data Starting from 2022 to 2025
- Base Year: 2025
- Forecast Data until 2032
- Key Performance Indicators Impacting the Market.
- Major Upcoming Developments and Projects.
Key Highlights of the Report:
- Uganda Milk Market Overview
- Uganda Milk Market Outlook
- Uganda Milk Market Forecast
- Historical Data and Forecast of Uganda Milk Market Revenues and Volume for the Period 2022-2032F
- Historical Data and Forecast of Uganda Milk Market Revenues and Volume, By Product Type, for the Period 2022-2032F
- Historical Data and Forecast of Uganda Milk Market Revenues, By Distribution Channel, for the Period 2022-2032F
- Historical Data and Forecast of Uganda Milk Market Revenues, By Price Positioning, for the Period 2022-2032F
- Historical Data and Forecast of Uganda Milk Market Revenues, By Packaging Format, for the Period 2022-2032F
- Historical Data and Forecast of Uganda Milk Market Revenues, By Market Structure, for the Period 2022-2032F
- Historical Data and Forecast of Uganda Milk Market Revenues, By End User, for the Period 2022-2032F
- Industry Life Cycle
- Porter’s Five Force Analysis
- Uganda Milk Market Drivers and Restraints
- Uganda Milk Market Trends & Evolution
- Market Opportunity Assessment
- Uganda Milk Market Revenue Ranking, By Top 3 Companies
- Competitive Benchmarking
- Company Profiles
- Key Strategic Recommendations
Market Scope and Segmentation
The report provides a detailed analysis of the following market segments:
By Product Type
- Fresh Milk
- UHT Milk
- Powdered Milk
- Yogurt
- Cheese
- Others
By Distribution Channel
- Modern Trade (Supermarkets/Hypermarkets)
- General Trade (Local Dukas/Milk ATMs)
- Institutional (Schools/Hotels) and Export Markets
By Price Positioning
- Premium
- Mid-Range
- Economy
By Packaging Format
- Bulk/Loose Milk
- Pouched Milk
- Cartons (Tetra Pak)
- Bottles
By Market Structure
- Formal Market
- Informal Market
By End User
- Household Consumers
- Food Service / HORECA
- Institutional Buyers
- Industrial / B2B Users
Uganda Milk Market (2026-2032): FAQs
Uganda Milk Market is projected to grow at a CAGR of 6.9% and 5.7% during 2026-2032F.
High Milk Production Growth and Institutional & Donor-Led Investments Accelerating Dairy Sector Modernization are driving the growth of market.
The market faces restraints due to Informal Dominance, Quality Gaps & Seasonal Volatility.
Uganda Milk Market Report thoroughly covers the market by product type, by distribution channels, by price positioning, by packaging format, by market structure, and by end-user.
6Wresearch actively monitors the Uganda Milk Market and publishes its comprehensive annual report, highlighting emerging trends, growth drivers, revenue analysis, and forecast outlook. Our insights help businesses to make data-backed strategic decisions with ongoing market dynamics. Our analysts track relevent industries related to the Uganda Milk Market, allowing our clients with actionable intelligence and reliable forecasts tailored to emerging regional needs.
Yes, we provide customisation as per your requirements. To learn more, feel free to contact us on sales@6wresearch.com
| 1. Executive Summary |
| 2. Introduction |
| 2.1. Report Description |
| 2.2. Key Highlights of the Report |
| 2.3. Market Scope & Segmentation |
| 2.4. Research Methodology |
| 2.5. Assumptions |
| 3. Global Milk Market Overview |
| 3.1. Global Milk Market Revenues, 2022-2032F |
| 4. Uganda Milk Market Overview |
| 4.1. Uganda Macroeconomic Indicators |
| 4.2. Uganda Milk Market Revenues and Volume, 2022-2032F |
| 4.3. Uganda Milk Market Industry Life Cycle |
| 4.4. Uganda Milk Market Porter's Five Forces |
| 5. Uganda Milk Market Dynamics |
| 5.1. Impact Analysis |
| 5.2. Market Drivers |
| 5.3. Market Restraints |
| 6. Uganda Milk Market Trends And Evolution |
| 7. Uganda Milk Market Overview, By Product Type |
| 7.1 Uganda Milk Market Revenue Share and Volume Share, By Product Type , 2025 & 2032F |
| 7.2 Uganda Milk Market Revenues and Volume, By Product Type , 2022-2032F |
| 7.2.1. Uganda Milk Market Revenues and Volume, By Fresh Milk, 2022-2032F |
| 7.2.2. Uganda Milk Market Revenues and Volume, By UHT Milk, 2022-2032F |
| 7.2.3. Uganda Milk Market Revenues and Volume, By Powdered Milk, 2022-2032F |
| 7.2.4. Uganda Milk Market Revenues and Volume, By Yogurt, 2022-2032F |
| 7.2.5. Uganda Milk Market Revenues and Volume, By Cheese, 2022-2032F |
| 7.2.6. Uganda Milk Market Revenues and Volume, By Others, 2022-2032F |
| 8. Uganda Milk Market Overview, By Distribution Channels |
| 8.1 Uganda Milk Market Revenue and Revenue Share, By Distribution Channels, 2025 & 2032F |
| 8.1.1. Uganda Milk Market Revenues, By Modern Trade (Supermarkets/Hypermarkets), 2025 & 2032F |
| 8.1.2. Uganda Milk Market Revenues, By General Trade (Local Dukas/Milk ATMs), 2025 & 2032F |
| 8.1.3. Uganda Milk Market Revenues, By Institutional (Schools/Hotels) and Export Markets, 2025 & 2032F |
| 9. Uganda Milk Market Overview, By Price Positioning |
| 9.1 Uganda Milk Market Revenue and Revenue Share, By Price Positioning, 2025 & 2032F |
| 9.1.1. Uganda Milk Market Revenues, By Premium, 2025 & 2032F |
| 9.1.2. Uganda Milk Market Revenues, By Mid-Range, 2025 & 2032F |
| 9.1.3. Uganda Milk Market Revenues, By Economy, 2025 & 2032F |
| 10. Uganda Milk Market Overview, By Packaging Format |
| 10.1 Uganda Milk Market Revenue and Revenue Share, By Packaging Format, 2025 & 2032F |
| 10.1.1. Uganda Milk Market Revenues, By Bulk / Loose Milk, 2025 & 2032F |
| 10.1.2. Uganda Milk Market Revenues, By Pouched Milk, 2025 & 2032F |
| 10.1.3. Uganda Milk Market Revenues, By Cartons (Tetra Pak), 2025 & 2032F |
| 10.1.4. Uganda Milk Market Revenues, By Bottles, 2025 & 2032F |
| 11. Uganda Milk Market Overview, By Market Structure |
| 11.1 Uganda Milk Market Revenue and Revenue Share, By Market Structure, 2025 & 2032F |
| 11.1.1. Uganda Milk Market Revenues, By Formal Market, 2025 & 2032F |
| 11.1.2. Uganda Milk Market Revenues, By Informal Market, 2025 & 2032F |
| 12. Uganda Milk Market Overview, By End User |
| 12.1 Uganda Milk Market Revenue and Revenue Share, By End User, 2025 & 2032F |
| 12.1.1. Uganda Milk Market Revenues, By Household Consumers, 2025 & 2032F |
| 12.1.2. Uganda Milk Market Revenues, By Foodservice / HORECA, 2025 & 2032F |
| 12.1.3. Uganda Milk Market Revenues, By Institutional Buyers, 2025 & 2032F |
| 12.1.4. Uganda Milk Market Revenues, By Industrial / B2B Users, 2025 & 2032F |
| 13. Uganda Milk Market Key Performance Indicator |
| 14. Uganda Milk Market Opportunity Assessment |
| 14.1. Uganda Milk Market Opportunity Assessment, By Product Type, 2032F |
| 14.2. Uganda Milk Market Opportunity Assessment, By Distribution Channels, 2032F |
| 14.3. Uganda Milk Market Opportunity Assessment, By Price Positioning, 2032F |
| 14.4. Uganda Milk Market Opportunity Assessment, By Packaging Format, 2032F |
| 14.5. Uganda Milk Market Opportunity Assessment, By Market Structure, 2032F |
| 14.6. Uganda Milk Market Opportunity Assessment, By End User, 2032F |
| 15. Uganda dairy consumption & per-capita consumption |
| 16. Uganda National milk production volumes and regional production hotspots |
| 17. Uganda Milk Market Competitive Landscape |
| 17.1. Uganda Milk Market Revenue Ranking/Share, By Top 3 Companies, CY 2025 |
| 17.2. Uganda Milk Market Competitive Benchmarking, By Technical Parameters |
| 17.3. Uganda Milk Market Competitive Benchmarking, By Operating Parameters |
| 18. Company Profiles |
| 18.1 Lakeside Dairy Ltd. |
| 18.2 Amos Dairies Limited |
| 18.3 Lato Milk |
| 18.4 G.B.K Group |
| 18.5 Royal Milk Group of Companies |
| 18.6 Bennifood |
| 18.7 Brookside Dairy Limited |
| 18.8 Jesa Farm Dairy Ltd |
| 18.9 Premier Dairies |
| 18.10 Vital Tomosi Dairy Limited |
| 19. Key Strategic Recommendations |
| 20. Disclaimer |
| List of Figures |
| 1. Global Milk Market Revenues, 2022-2032F (US$ Million) |
| 2. Uganda Milk Market Revenues and Volume, 2022-2032F (US$ Million, million litres) |
| 3. Uganda Milk Production, 2021-2024 (In Million Tonnes) |
| 4. Uganda’s Milk & Related Products Value, 2022-2023 (In $ Million) |
| 5. Uganda Milk Market: Processed vs. Unprocessed Milk Share, 2025, (%) |
| 6. Uganda Milk Market Revenue Share, By Product Type, 2025 & 2032F |
| 7. Uganda Milk Market Volume Share, By Product Type, 2025 & 2032F |
| 8. Uganda Milk Market Revenue Share, By Distribution Channels, 2025 & 2032F |
| 9. Uganda Milk Market Revenue Share, By Price Positioning, 2025 & 2032F |
| 10. Uganda Milk Market Revenue Share, By Packaging Format , 2025 & 2032F |
| 11. Uganda Milk Market Revenue Share, By Market Structure , 2025 & 2032F |
| 12. Uganda Milk Market Revenue Share, By End User, 2025 & 2032F |
| 13. Uganda’s Milk Consumption Per Person, 2022-2023 (In Litres) |
| 14. Uganda’s Number of Registered Dairy Processors, 2022-2024 |
| 15. Uganda’s Number of Milk Collection Centres, 2022-2023 |
| 16. Uganda Milk Market Opportunity Assessment, By Product Type-Revenue Outlook, 2032F |
| 17. Uganda Milk Market Opportunity Assessment, By Product Type-Volume Outlook, 2032F |
| 18. Uganda Milk Market Opportunity Assessment, By Distribution Channels, 2032F |
| 19. Uganda Milk Market Opportunity Assessment, By Price Positioning, 2032F |
| 20. Uganda Milk Market Opportunity Assessment, By Packaging Format, 2032F |
| 21. Uganda Milk Market Opportunity Assessment, By Market Structure, 2032F |
| 22. Uganda Milk Market Opportunity Assessment, By End User, 2032F |
| 23. Uganda’s Per-Capita Milk Consumption Trend, 2020/21-2022/23 (In Litres) |
| 24. Uganda Milk Market Revenue Ranking, By Companies, CY2025 |
| 25. Uganda Total Number of Herd Size, 2013-2023 (In Million) |
| List of Table |
| 1. Number of Dairy Processing Plants and MCCs in Uganda, 2021 & 2022 |
| 2. Major Institutional & Investment Support in Uganda’s Dairy Sector |
| 3. Uganda Milk Market Revenues, By Product Type, 2022-2032F (USD Millions) |
| 4. Uganda Milk Market Volume, By Product Type, 2022-2032F (Million Litres) |
| 5. Uganda Milk Market Revenues, By Distribution Channels, 2022-2032F (USD Millions) |
| 6. Uganda Milk Market Revenues, By Price Positioning, 2022-2032F (USD Millions) |
| 7. Uganda Milk Market Revenues, By Packaging Format , 2022-2032F (USD Millions) |
| 8. Uganda Milk Market Revenues, By Market Structure , 2022-2032F (USD Millions) |
| 9. Uganda Milk Market Revenues, By End User, 2022-2032F ($ Thousand) |
| 10. Uganda’s Inbound Tourism Expenditure by Product, 2022-2023 (In $ Million) |
| 11. Uganda’s Number of Establishments & Capacity By Types Of Accommodation, 2022-2023 |
| 12. Uganda’s Annual Per-Capita Milk Consumption |
| 13. Uganda’s National Milk Production Trend |
| 14. Uganda’s Regional Milk Production Contribution |
Global Go To Market Strategy - 2030
Export potential enables firms to identify high-growth global markets with greater confidence by combining advanced trade intelligence with a structured quantitative methodology. The framework analyzes emerging demand trends and country-level import patterns while integrating macroeconomic and trade datasets such as GDP and population forecasts, bilateral import–export flows, tariff structures, elasticity differentials between developed and developing economies, geographic distance, and import demand projections. Using weighted trade values from 2020–2024 as the base period to project country-to-country export potential for 2030, these inputs are operationalized through calculated drivers such as gravity model parameters, tariff impact factors, and projected GDP per-capita growth. Through an analysis of hidden potentials, demand hotspots, and market conditions that are most favorable to success, this method enables firms to focus on target countries, maximize returns, and global expansion with data, backed by accuracy.
By factoring in the projected importer demand gap that is currently unmet and could be potential opportunity, it identifies the potential for the Exporter (Country) among 190 countries, against the general trade analysis, which identifies the biggest importer or exporter.
To discover high-growth global markets and optimize your business strategy:
Click Here
Pricing
- Single User License$ 1,995
- Department License$ 2,400
- Site License$ 3,120
- Global License$ 3,795

Leadership Perspectives from Industry Events
Search
Thought Leadership and Analyst Meet


Our Clients
6WResearch In News
- India Export Attractiveness Tracker 2026
- India Air Conditioner Market Set for Strong Rebound in 2026 After Weather-Led Correction and GST-Driven Recovery: 6Wresearch
- ADAS in India: How Automatic Emergency Braking, Blind Spot Detection & Driver Monitoring are Transforming Road Safety
- Doha a strategic location for EV manufacturing hub: IPA Qatar
- Demand for luxury TVs surging in the GCC, says Samsung
- Empowering Growth: The Thriving Journey of Bangladesh’s Cable Industry
Latest Reports
- Qatar Access and Home Network Market (2026-2032)
- Nicaragua RPG Gaming Market (2026-2032)
- New Zealand RPG Gaming Market (2026-2032)
- Netherlands RPG Gaming Market (2026-2032)
- Nauru RPG Gaming Market (2026-2032)
- Namibia RPG Gaming Market (2026-2032)
- Mozambique RPG Gaming Market (2026-2032)
- Montenegro RPG Gaming Market (2026-2032)
- Mongolia RPG Gaming Market (2026-2032)
- Monaco RPG Gaming Market (2026-2032)
Industry Events and Analyst Meet

EV India Expo 2026

HIMTEX 2026

India Refining Summit 2026

India EV Show 2026

EV tech India Expo 2026
Whitepaper
- Middle East & Africa Commercial Security Market Click here to view more.
- Middle East & Africa Fire Safety Systems & Equipment Market Click here to view more.
- GCC Drone Market Click here to view more.
- Middle East Lighting Fixture Market Click here to view more.
- GCC Physical & Perimeter Security Market Click here to view more.