United States (US) Bone Screw Systems Market (2026-2032) | Companies, Outlook, Segmentation, Size & Revenue, Industry, Analysis, Growth, Forecast, Competitive Landscape, Share, Trends, Value
Market Forecast By Material (Stainless steel, Titanium, Bio absorbable), By Position (Lower Extremity, Upper Extremity, Spinal, Others), By End Users (Hospital, Ambulatory Surgical Centre, Clinic) And Competitive Landscape
| Product Code: ETC9961153 | Publication Date: Sep 2024 | Updated Date: Apr 2026 | Product Type: Market Research Report | |
| Publisher: 6Wresearch | Author: Summon Dutta | No. of Pages: 75 | No. of Figures: 35 | No. of Tables: 20 |
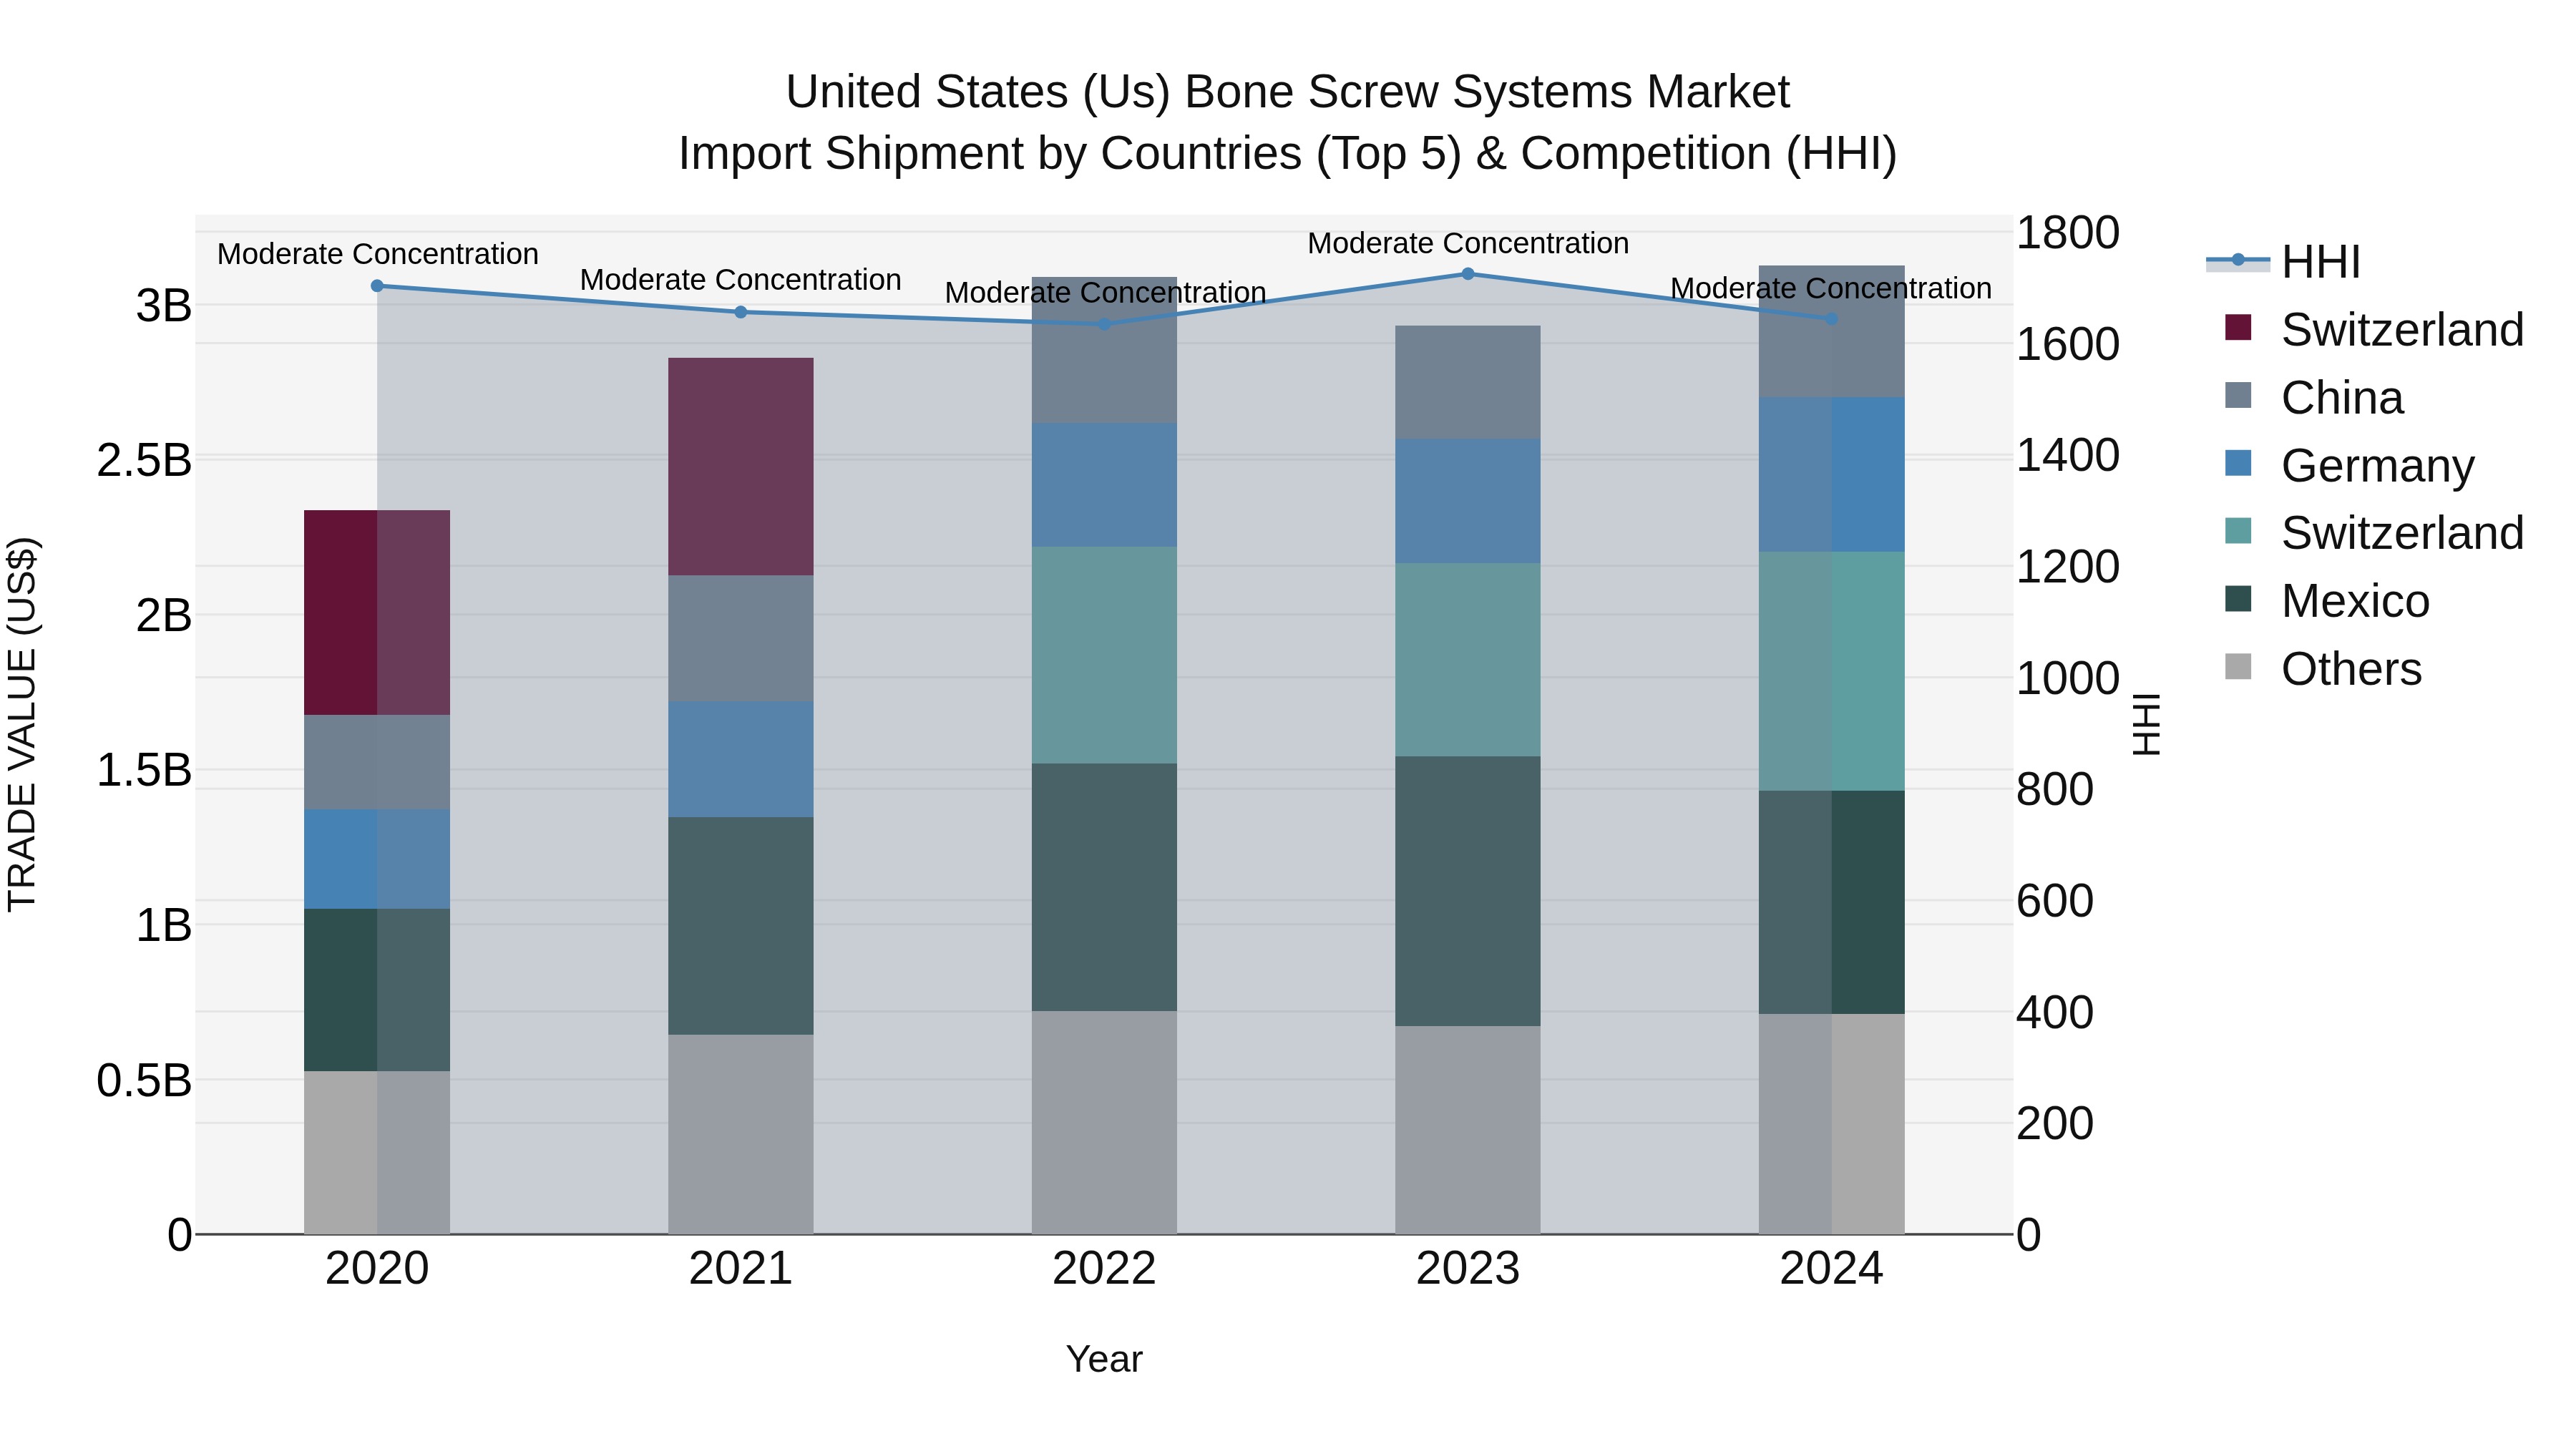
United States (US) Bone Screw Systems Market Top 5 Importing Countries and Market Competition (HHI) Analysis
The United States continues to rely on imports of bone screw systems, with top exporting countries including Switzerland, Mexico, Germany, China, and Costa Rica in 2024. The market shows moderate concentration with a stable Herfindahl-Hirschman Index (HHI) in the same year. The compound annual growth rate (CAGR) for 2020-2024 stands at a healthy 7.54%, demonstrating sustained demand for these products. Additionally, the growth rate from 2023 to 2024 recorded at 6.57% indicates a positive momentum in the import shipments of bone screw systems to the US market.
Key Highlights of the Report:
- United States (US) Bone Screw Systems Market Outlook
- Market Size of United States (US) Bone Screw Systems Market, 2025
- Forecast of United States (US) Bone Screw Systems Market, 2032
- Historical Data and Forecast of United States (US) Bone Screw Systems Revenues & Volume for the Period 2022 - 2032
- United States (US) Bone Screw Systems Market Trend Evolution
- United States (US) Bone Screw Systems Market Drivers and Challenges
- United States (US) Bone Screw Systems Price Trends
- United States (US) Bone Screw Systems Porter's Five Forces
- United States (US) Bone Screw Systems Industry Life Cycle
- Historical Data and Forecast of United States (US) Bone Screw Systems Market Revenues & Volume By Material for the Period 2022 - 2032
- Historical Data and Forecast of United States (US) Bone Screw Systems Market Revenues & Volume By Stainless steel for the Period 2022 - 2032
- Historical Data and Forecast of United States (US) Bone Screw Systems Market Revenues & Volume By Titanium for the Period 2022 - 2032
- Historical Data and Forecast of United States (US) Bone Screw Systems Market Revenues & Volume By Bio absorbable for the Period 2022 - 2032
- Historical Data and Forecast of United States (US) Bone Screw Systems Market Revenues & Volume By Position for the Period 2022 - 2032
- Historical Data and Forecast of United States (US) Bone Screw Systems Market Revenues & Volume By Lower Extremity for the Period 2022 - 2032
- Historical Data and Forecast of United States (US) Bone Screw Systems Market Revenues & Volume By Upper Extremity for the Period 2022 - 2032
- Historical Data and Forecast of United States (US) Bone Screw Systems Market Revenues & Volume By Spinal for the Period 2022 - 2032
- Historical Data and Forecast of United States (US) Bone Screw Systems Market Revenues & Volume By Others for the Period 2022 - 2032
- Historical Data and Forecast of United States (US) Bone Screw Systems Market Revenues & Volume By End Users for the Period 2022 - 2032
- Historical Data and Forecast of United States (US) Bone Screw Systems Market Revenues & Volume By Hospital for the Period 2022 - 2032
- Historical Data and Forecast of United States (US) Bone Screw Systems Market Revenues & Volume By Ambulatory Surgical Centre for the Period 2022 - 2032
- Historical Data and Forecast of United States (US) Bone Screw Systems Market Revenues & Volume By Clinic for the Period 2022 - 2032
- United States (US) Bone Screw Systems Import Export Trade Statistics
- Market Opportunity Assessment By Material
- Market Opportunity Assessment By Position
- Market Opportunity Assessment By End Users
- United States (US) Bone Screw Systems Top Companies Market Share
- United States (US) Bone Screw Systems Competitive Benchmarking By Technical and Operational Parameters
- United States (US) Bone Screw Systems Company Profiles
- United States (US) Bone Screw Systems Key Strategic Recommendations
Frequently Asked Questions About the Market Study (FAQs):
6Wresearch actively monitors the United States (US) Bone Screw Systems Market and publishes its comprehensive annual report, highlighting emerging trends, growth drivers, revenue analysis, and forecast outlook. Our insights help businesses to make data-backed strategic decisions with ongoing market dynamics. Our analysts track relevent industries related to the United States (US) Bone Screw Systems Market, allowing our clients with actionable intelligence and reliable forecasts tailored to emerging regional needs.
Yes, we provide customisation as per your requirements. To learn more, feel free to contact us on sales@6wresearch.com
1 Executive Summary |
2 Introduction |
2.1 Key Highlights of the Report |
2.2 Report Description |
2.3 Market Scope & Segmentation |
2.4 Research Methodology |
2.5 Assumptions |
3 United States (US) Bone Screw Systems Market Overview |
3.1 United States (US) Country Macro Economic Indicators |
3.2 United States (US) Bone Screw Systems Market Revenues & Volume, 2022 & 2032F |
3.3 United States (US) Bone Screw Systems Market - Industry Life Cycle |
3.4 United States (US) Bone Screw Systems Market - Porter's Five Forces |
3.5 United States (US) Bone Screw Systems Market Revenues & Volume Share, By Material, 2022 & 2032F |
3.6 United States (US) Bone Screw Systems Market Revenues & Volume Share, By Position, 2022 & 2032F |
3.7 United States (US) Bone Screw Systems Market Revenues & Volume Share, By End Users, 2022 & 2032F |
4 United States (US) Bone Screw Systems Market Dynamics |
4.1 Impact Analysis |
4.2 Market Drivers |
4.2.1 Increasing prevalence of orthopedic conditions and injuries driving the demand for bone screw systems. |
4.2.2 Technological advancements leading to the development of innovative bone screw systems with improved efficacy and patient outcomes. |
4.2.3 Growing geriatric population in the US, who are more prone to orthopedic issues, boosting the market for bone screw systems. |
4.3 Market Restraints |
4.3.1 High cost associated with bone screw systems may limit adoption, particularly among cost-conscious healthcare facilities. |
4.3.2 Stringent regulatory requirements and approval processes for bone screw systems can hinder market growth. |
4.3.3 Competition from alternative orthopedic fixation devices, such as plates and rods, may pose a threat to the bone screw systems market. |
5 United States (US) Bone Screw Systems Market Trends |
6 United States (US) Bone Screw Systems Market, By Types |
6.1 United States (US) Bone Screw Systems Market, By Material |
6.1.1 Overview and Analysis |
6.1.2 United States (US) Bone Screw Systems Market Revenues & Volume, By Material, 2022 - 2032F |
6.1.3 United States (US) Bone Screw Systems Market Revenues & Volume, By Stainless steel, 2022 - 2032F |
6.1.4 United States (US) Bone Screw Systems Market Revenues & Volume, By Titanium, 2022 - 2032F |
6.1.5 United States (US) Bone Screw Systems Market Revenues & Volume, By Bio absorbable, 2022 - 2032F |
6.2 United States (US) Bone Screw Systems Market, By Position |
6.2.1 Overview and Analysis |
6.2.2 United States (US) Bone Screw Systems Market Revenues & Volume, By Lower Extremity, 2022 - 2032F |
6.2.3 United States (US) Bone Screw Systems Market Revenues & Volume, By Upper Extremity, 2022 - 2032F |
6.2.4 United States (US) Bone Screw Systems Market Revenues & Volume, By Spinal, 2022 - 2032F |
6.2.5 United States (US) Bone Screw Systems Market Revenues & Volume, By Others, 2022 - 2032F |
6.3 United States (US) Bone Screw Systems Market, By End Users |
6.3.1 Overview and Analysis |
6.3.2 United States (US) Bone Screw Systems Market Revenues & Volume, By Hospital, 2022 - 2032F |
6.3.3 United States (US) Bone Screw Systems Market Revenues & Volume, By Ambulatory Surgical Centre, 2022 - 2032F |
6.3.4 United States (US) Bone Screw Systems Market Revenues & Volume, By Clinic, 2022 - 2032F |
7 United States (US) Bone Screw Systems Market Import-Export Trade Statistics |
7.1 United States (US) Bone Screw Systems Market Export to Major Countries |
7.2 United States (US) Bone Screw Systems Market Imports from Major Countries |
8 United States (US) Bone Screw Systems Market Key Performance Indicators |
8.1 Average selling price (ASP) of bone screw systems, indicating market trends and product value. |
8.2 Adoption rate of minimally invasive procedures using bone screw systems, reflecting technological advancements and patient preferences. |
8.3 Number of orthopedic surgeries performed using bone screw systems, showing market penetration and demand for the devices. |
9 United States (US) Bone Screw Systems Market - Opportunity Assessment |
9.1 United States (US) Bone Screw Systems Market Opportunity Assessment, By Material, 2022 & 2032F |
9.2 United States (US) Bone Screw Systems Market Opportunity Assessment, By Position, 2022 & 2032F |
9.3 United States (US) Bone Screw Systems Market Opportunity Assessment, By End Users, 2022 & 2032F |
10 United States (US) Bone Screw Systems Market - Competitive Landscape |
10.1 United States (US) Bone Screw Systems Market Revenue Share, By Companies, 2025 |
10.2 United States (US) Bone Screw Systems Market Competitive Benchmarking, By Operating and Technical Parameters |
11 Company Profiles |
12 Recommendations |
13 Disclaimer |
Export potential assessment - trade Analytics for 2030
Export potential enables firms to identify high-growth global markets with greater confidence by combining advanced trade intelligence with a structured quantitative methodology. The framework analyzes emerging demand trends and country-level import patterns while integrating macroeconomic and trade datasets such as GDP and population forecasts, bilateral import–export flows, tariff structures, elasticity differentials between developed and developing economies, geographic distance, and import demand projections. Using weighted trade values from 2020–2024 as the base period to project country-to-country export potential for 2030, these inputs are operationalized through calculated drivers such as gravity model parameters, tariff impact factors, and projected GDP per-capita growth. Through an analysis of hidden potentials, demand hotspots, and market conditions that are most favorable to success, this method enables firms to focus on target countries, maximize returns, and global expansion with data, backed by accuracy.
By factoring in the projected importer demand gap that is currently unmet and could be potential opportunity, it identifies the potential for the Exporter (Country) among 190 countries, against the general trade analysis, which identifies the biggest importer or exporter.
To discover high-growth global markets and optimize your business strategy:
Click Here
Pricing
- Single User License$ 1,995
- Department License$ 2,400
- Site License$ 3,120
- Global License$ 3,795

Search
Thought Leadership and Analyst Meet


Our Clients
Latest Reports
- Philippines Polyhydroxybutyrate-co-Hydroxyvalerate Market (2026-2032) | Trends, Insights, Challenges, Restraints, Competition, Size, Value, Forecast, Pricing, Share, Outlook, Revenue, Investment Opportunities, Strategy, Drivers, Demand, Growth, segmentation, Analysis, Companies
- Peru Polyhydroxybutyrate-co-Hydroxyvalerate Market (2026-2032) | Growth, Demand, Challenges, Share, Trends, Analysis, Pricing, Investment Opportunities, Drivers, Value, Forecast, Competition, Size, Companies, Insights, Outlook, Restraints, segmentation, Revenue, Strategy
- Pakistan Polyhydroxybutyrate-co-Hydroxyvalerate Market (2026-2032) | Restraints, segmentation, Pricing, Forecast, Share, Strategy, Competition, Trends, Insights, Drivers, Challenges, Growth, Revenue, Outlook, Value, Investment Opportunities, Companies, Size, Analysis, Demand
- Oman Polyhydroxybutyrate-co-Hydroxyvalerate Market (2026-2032) | Drivers, segmentation, Insights, Competition, Pricing, Outlook, Size, Revenue, Challenges, Forecast, Analysis, Growth, Value, Share, Trends, Investment Opportunities, Strategy, Restraints, Companies, Demand
- Nigeria Polyhydroxybutyrate-co-Hydroxyvalerate Market (2026-2032) | Value, Investment Opportunities, Analysis, Revenue, Restraints, Pricing, Outlook, Competition, Demand, Growth, Forecast, Companies, Trends, Challenges, segmentation, Drivers, Insights, Share, Size, Strategy
- Nepal Polyhydroxybutyrate-co-Hydroxyvalerate Market (2026-2032) | Insights, Analysis, Drivers, Share, Revenue, Demand, segmentation, Investment Opportunities, Competition, Forecast, Growth, Pricing, Companies, Strategy, Trends, Restraints, Challenges, Outlook, Size, Value
- Myanmar Polyhydroxybutyrate-co-Hydroxyvalerate Market (2026-2032) | Outlook, Revenue, Strategy, Restraints, Drivers, segmentation, Share, Forecast, Competition, Insights, Growth, Pricing, Size, Demand, Value, Companies, Trends, Challenges, Investment Opportunities, Analysis
- Morocco Polyhydroxybutyrate-co-Hydroxyvalerate Market (2026-2032) | Outlook, Investment Opportunities, Restraints, Strategy, Forecast, Challenges, Drivers, Growth, Companies, segmentation, Trends, Size, Competition, Revenue, Demand, Insights, Share, Analysis, Value, Pricing
- Mexico Polyhydroxybutyrate-co-Hydroxyvalerate Market (2026-2032) | Size, Drivers, Outlook, Share, Strategy, Growth, Pricing, Challenges, Companies, Demand, Value, Investment Opportunities, Restraints, Trends, Forecast, segmentation, Analysis, Insights, Competition, Revenue
- Malaysia Polyhydroxybutyrate-co-Hydroxyvalerate Market (2026-2032) | Share, segmentation, Size, Companies, Analysis, Insights, Forecast, Value, Revenue, Drivers, Restraints, Challenges, Investment Opportunities, Trends, Competition, Strategy, Demand, Growth, Outlook, Pricing
Industry Events and Analyst Meet

HIMTEX 2026

India Refining Summit 2026

India EV Show 2026

EV tech India Expo 2026

Auto Tech Asia 2026
Whitepaper
- Middle East & Africa Commercial Security Market Click here to view more.
- Middle East & Africa Fire Safety Systems & Equipment Market Click here to view more.
- GCC Drone Market Click here to view more.
- Middle East Lighting Fixture Market Click here to view more.
- GCC Physical & Perimeter Security Market Click here to view more.
6WResearch In News
- Doha a strategic location for EV manufacturing hub: IPA Qatar
- Demand for luxury TVs surging in the GCC, says Samsung
- Empowering Growth: The Thriving Journey of Bangladesh’s Cable Industry
- Demand for luxury TVs surging in the GCC, says Samsung
- Video call with a traditional healer? Once unthinkable, it’s now common in South Africa
- Intelligent Buildings To Smooth GCC’s Path To Net Zero