United States (US) CBD Patch Market (2026-2032) | Size & Revenue, Value, Analysis, Industry, Companies, Forecast, Outlook, Trends, Segmentation, Competitive Landscape, Share, Growth
Market Forecast By Product (Layer Drug-In-Adhesive, Reservoir, Matrix), By Species (Cannabis Indica, Sativa, Hybrid), By Packaging (Two to Five Patches, Single Patch, More Than Five Patches), By Dosage (Below 30mg, 30-40 mg, 40-50mg, Above 50 mg), By Derivatives (Cannabidiol (CBD), Tetrahydrocannabinol (THC), Others), By Application (Chronic Pain, Anxiety, Arthritis, Elevate Mood, Neurological Pain, Others), By Source Type (Natural, Synthetic), By End User (Homecare Setting, Research and Development Centres, Hospital, Clinics, Rehab Centres, Others) And Competitive Landscape
| Product Code: ETC9961494 | Publication Date: Sep 2024 | Updated Date: Apr 2026 | Product Type: Market Research Report | |
| Publisher: 6Wresearch | Author: Summon Dutta | No. of Pages: 75 | No. of Figures: 35 | No. of Tables: 20 |
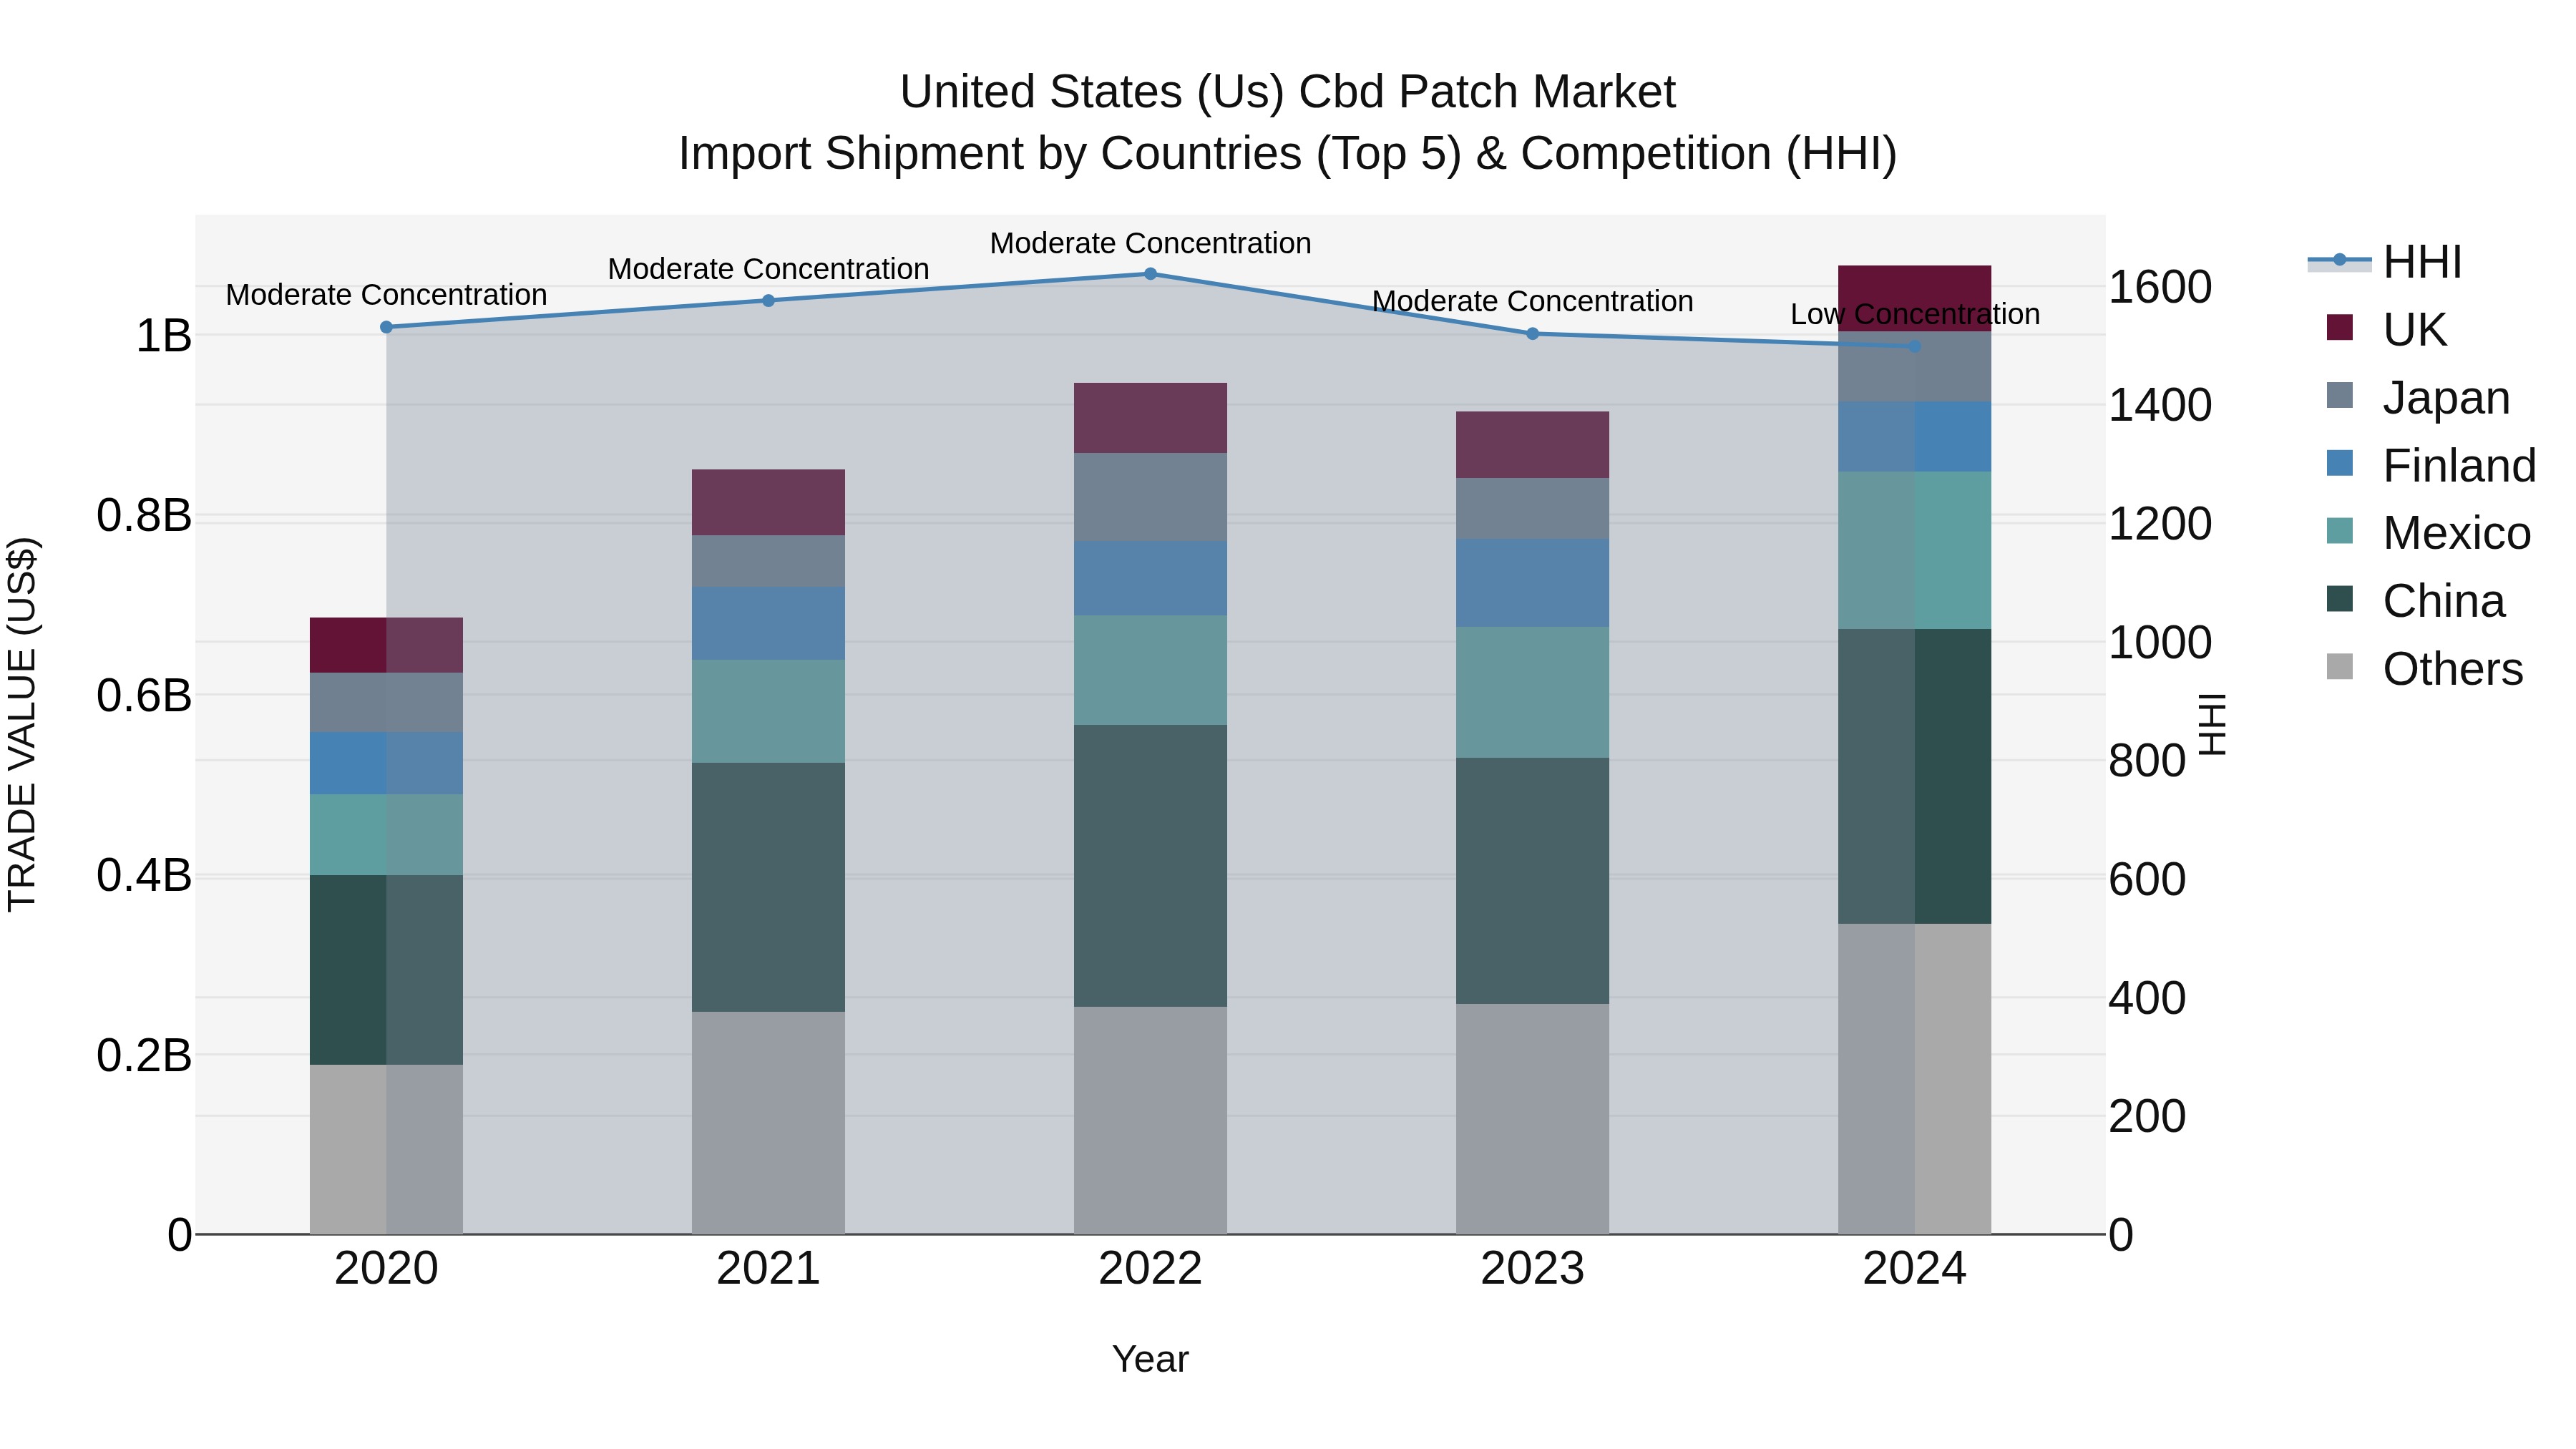
United States (US) Cbd Patch Market Top 5 Importing Countries and Market Competition (HHI) Analysis
The United States has seen a significant increase in CBD patch import shipments, with top exporting countries including China, Mexico, Finland, Japan, and South Korea. The market concentration has shifted from moderate to low in 2024, indicating a more diverse range of suppliers. The impressive CAGR of 11.94% from 2020 to 2024 highlights the growing demand for CBD patches in the US market. The notable growth rate of 17.67% from 2023 to 2024 suggests a rapidly expanding market with promising opportunities for both domestic and international players.
Key Highlights of the Report:
- United States (US) CBD Patch Market Outlook
- Market Size of United States (US) CBD Patch Market, 2025
- Forecast of United States (US) CBD Patch Market, 2032
- Historical Data and Forecast of United States (US) CBD Patch Revenues & Volume for the Period 2022 - 2032
- United States (US) CBD Patch Market Trend Evolution
- United States (US) CBD Patch Market Drivers and Challenges
- United States (US) CBD Patch Price Trends
- United States (US) CBD Patch Porter's Five Forces
- United States (US) CBD Patch Industry Life Cycle
- Historical Data and Forecast of United States (US) CBD Patch Market Revenues & Volume By Product for the Period 2022 - 2032
- Historical Data and Forecast of United States (US) CBD Patch Market Revenues & Volume By Layer Drug-In-Adhesive for the Period 2022 - 2032
- Historical Data and Forecast of United States (US) CBD Patch Market Revenues & Volume By Reservoir for the Period 2022 - 2032
- Historical Data and Forecast of United States (US) CBD Patch Market Revenues & Volume By Matrix for the Period 2022 - 2032
- Historical Data and Forecast of United States (US) CBD Patch Market Revenues & Volume By Species for the Period 2022 - 2032
- Historical Data and Forecast of United States (US) CBD Patch Market Revenues & Volume By Cannabis Indica for the Period 2022 - 2032
- Historical Data and Forecast of United States (US) CBD Patch Market Revenues & Volume By Sativa for the Period 2022 - 2032
- Historical Data and Forecast of United States (US) CBD Patch Market Revenues & Volume By Hybrid for the Period 2022 - 2032
- Historical Data and Forecast of United States (US) CBD Patch Market Revenues & Volume By Packaging for the Period 2022 - 2032
- Historical Data and Forecast of United States (US) CBD Patch Market Revenues & Volume By Two to Five Patches for the Period 2022 - 2032
- Historical Data and Forecast of United States (US) CBD Patch Market Revenues & Volume By Single Patch for the Period 2022 - 2032
- Historical Data and Forecast of United States (US) CBD Patch Market Revenues & Volume By More Than Five Patches for the Period 2022 - 2032
- Historical Data and Forecast of United States (US) CBD Patch Market Revenues & Volume By Dosage for the Period 2022 - 2032
- Historical Data and Forecast of United States (US) CBD Patch Market Revenues & Volume By Below 30mg for the Period 2022 - 2032
- Historical Data and Forecast of United States (US) CBD Patch Market Revenues & Volume By 30-40 mg for the Period 2022 - 2032
- Historical Data and Forecast of United States (US) CBD Patch Market Revenues & Volume By 40-50mg for the Period 2022 - 2032
- Historical Data and Forecast of United States (US) CBD Patch Market Revenues & Volume By Above 50 mg for the Period 2022 - 2032
- Historical Data and Forecast of United States (US) CBD Patch Market Revenues & Volume By Derivatives for the Period 2022 - 2032
- Historical Data and Forecast of United States (US) CBD Patch Market Revenues & Volume By Cannabidiol (CBD) for the Period 2022 - 2032
- Historical Data and Forecast of United States (US) CBD Patch Market Revenues & Volume By Tetrahydrocannabinol (THC) for the Period 2022 - 2032
- Historical Data and Forecast of United States (US) CBD Patch Market Revenues & Volume By Others for the Period 2022 - 2032
- Historical Data and Forecast of United States (US) CBD Patch Market Revenues & Volume By Application for the Period 2022 - 2032
- Historical Data and Forecast of United States (US) CBD Patch Market Revenues & Volume By Chronic Pain for the Period 2022 - 2032
- Historical Data and Forecast of United States (US) CBD Patch Market Revenues & Volume By Anxiety for the Period 2022 - 2032
- Historical Data and Forecast of United States (US) CBD Patch Market Revenues & Volume By Arthritis for the Period 2022 - 2032
- Historical Data and Forecast of United States (US) CBD Patch Market Revenues & Volume By Elevate Mood for the Period 2022 - 2032
- Historical Data and Forecast of United States (US) CBD Patch Market Revenues & Volume By Neurological Pain for the Period 2022 - 2032
- Historical Data and Forecast of United States (US) CBD Patch Market Revenues & Volume By Others for the Period 2022 - 2032
- Historical Data and Forecast of United States (US) CBD Patch Market Revenues & Volume By Source Type for the Period 2022 - 2032
- Historical Data and Forecast of United States (US) CBD Patch Market Revenues & Volume By Natural for the Period 2022 - 2032
- Historical Data and Forecast of United States (US) CBD Patch Market Revenues & Volume By Synthetic for the Period 2022 - 2032
- Historical Data and Forecast of United States (US) CBD Patch Market Revenues & Volume By End User for the Period 2022 - 2032
- Historical Data and Forecast of United States (US) CBD Patch Market Revenues & Volume By Homecare Setting for the Period 2022 - 2032
- Historical Data and Forecast of United States (US) CBD Patch Market Revenues & Volume By Research and Development Centres for the Period 2022 - 2032
- Historical Data and Forecast of United States (US) CBD Patch Market Revenues & Volume By Hospital for the Period 2022 - 2032
- Historical Data and Forecast of United States (US) CBD Patch Market Revenues & Volume By Clinics for the Period 2022 - 2032
- Historical Data and Forecast of United States (US) CBD Patch Market Revenues & Volume By Rehab Centres for the Period 2022 - 2032
- Historical Data and Forecast of United States (US) CBD Patch Market Revenues & Volume By Others for the Period 2022 - 2032
- United States (US) CBD Patch Import Export Trade Statistics
- Market Opportunity Assessment By Product
- Market Opportunity Assessment By Species
- Market Opportunity Assessment By Packaging
- Market Opportunity Assessment By Dosage
- Market Opportunity Assessment By Derivatives
- Market Opportunity Assessment By Application
- Market Opportunity Assessment By Source Type
- Market Opportunity Assessment By End User
- United States (US) CBD Patch Top Companies Market Share
- United States (US) CBD Patch Competitive Benchmarking By Technical and Operational Parameters
- United States (US) CBD Patch Company Profiles
- United States (US) CBD Patch Key Strategic Recommendations
Frequently Asked Questions About the Market Study (FAQs):
6Wresearch actively monitors the United States (US) CBD Patch Market and publishes its comprehensive annual report, highlighting emerging trends, growth drivers, revenue analysis, and forecast outlook. Our insights help businesses to make data-backed strategic decisions with ongoing market dynamics. Our analysts track relevent industries related to the United States (US) CBD Patch Market, allowing our clients with actionable intelligence and reliable forecasts tailored to emerging regional needs.
Yes, we provide customisation as per your requirements. To learn more, feel free to contact us on sales@6wresearch.com
1 Executive Summary |
2 Introduction |
2.1 Key Highlights of the Report |
2.2 Report Description |
2.3 Market Scope & Segmentation |
2.4 Research Methodology |
2.5 Assumptions |
3 United States (US) CBD Patch Market Overview |
3.1 United States (US) Country Macro Economic Indicators |
3.2 United States (US) CBD Patch Market Revenues & Volume, 2022 & 2032F |
3.3 United States (US) CBD Patch Market - Industry Life Cycle |
3.4 United States (US) CBD Patch Market - Porter's Five Forces |
3.5 United States (US) CBD Patch Market Revenues & Volume Share, By Product, 2022 & 2032F |
3.6 United States (US) CBD Patch Market Revenues & Volume Share, By Species, 2022 & 2032F |
3.7 United States (US) CBD Patch Market Revenues & Volume Share, By Packaging, 2022 & 2032F |
3.8 United States (US) CBD Patch Market Revenues & Volume Share, By Dosage, 2022 & 2032F |
3.9 United States (US) CBD Patch Market Revenues & Volume Share, By Derivatives, 2022 & 2032F |
3.10 United States (US) CBD Patch Market Revenues & Volume Share, By Application, 2022 & 2032F |
3.11 United States (US) CBD Patch Market Revenues & Volume Share, By Source Type, 2022 & 2032F |
4 United States (US) CBD Patch Market Dynamics |
4.1 Impact Analysis |
4.2 Market Drivers |
4.2.1 Increasing consumer awareness and acceptance of CBD products for health and wellness purposes |
4.2.2 Growing preference for non-invasive and easy-to-use delivery methods for CBD consumption |
4.2.3 Rising interest in natural and alternative remedies for pain management and stress relief |
4.3 Market Restraints |
4.3.1 Regulatory uncertainties and evolving legal landscape surrounding CBD products |
4.3.2 Lack of standardized dosing guidelines and product quality control in the CBD patch market |
4.3.3 Competition from other forms of CBD products such as oils, capsules, and edibles |
5 United States (US) CBD Patch Market Trends |
6 United States (US) CBD Patch Market, By Types |
6.1 United States (US) CBD Patch Market, By Product |
6.1.1 Overview and Analysis |
6.1.2 United States (US) CBD Patch Market Revenues & Volume, By Product, 2022 - 2032F |
6.1.3 United States (US) CBD Patch Market Revenues & Volume, By Layer Drug-In-Adhesive, 2022 - 2032F |
6.1.4 United States (US) CBD Patch Market Revenues & Volume, By Reservoir, 2022 - 2032F |
6.1.5 United States (US) CBD Patch Market Revenues & Volume, By Matrix, 2022 - 2032F |
6.2 United States (US) CBD Patch Market, By Species |
6.2.1 Overview and Analysis |
6.2.2 United States (US) CBD Patch Market Revenues & Volume, By Cannabis Indica, 2022 - 2032F |
6.2.3 United States (US) CBD Patch Market Revenues & Volume, By Sativa, 2022 - 2032F |
6.2.4 United States (US) CBD Patch Market Revenues & Volume, By Hybrid, 2022 - 2032F |
6.3 United States (US) CBD Patch Market, By Packaging |
6.3.1 Overview and Analysis |
6.3.2 United States (US) CBD Patch Market Revenues & Volume, By Two to Five Patches, 2022 - 2032F |
6.3.3 United States (US) CBD Patch Market Revenues & Volume, By Single Patch, 2022 - 2032F |
6.3.4 United States (US) CBD Patch Market Revenues & Volume, By More Than Five Patches, 2022 - 2032F |
6.4 United States (US) CBD Patch Market, By Dosage |
6.4.1 Overview and Analysis |
6.4.2 United States (US) CBD Patch Market Revenues & Volume, By Below 30mg, 2022 - 2032F |
6.4.3 United States (US) CBD Patch Market Revenues & Volume, By 30-40 mg, 2022 - 2032F |
6.4.4 United States (US) CBD Patch Market Revenues & Volume, By 40-50mg, 2022 - 2032F |
6.4.5 United States (US) CBD Patch Market Revenues & Volume, By Above 50 mg, 2022 - 2032F |
6.5 United States (US) CBD Patch Market, By Derivatives |
6.5.1 Overview and Analysis |
6.5.2 United States (US) CBD Patch Market Revenues & Volume, By Cannabidiol (CBD), 2022 - 2032F |
6.5.3 United States (US) CBD Patch Market Revenues & Volume, By Tetrahydrocannabinol (THC), 2022 - 2032F |
6.5.4 United States (US) CBD Patch Market Revenues & Volume, By Others, 2022 - 2032F |
6.6 United States (US) CBD Patch Market, By Application |
6.6.1 Overview and Analysis |
6.6.2 United States (US) CBD Patch Market Revenues & Volume, By Chronic Pain, 2022 - 2032F |
6.6.3 United States (US) CBD Patch Market Revenues & Volume, By Anxiety, 2022 - 2032F |
6.6.4 United States (US) CBD Patch Market Revenues & Volume, By Arthritis, 2022 - 2032F |
6.6.5 United States (US) CBD Patch Market Revenues & Volume, By Elevate Mood, 2022 - 2032F |
6.6.6 United States (US) CBD Patch Market Revenues & Volume, By Neurological Pain, 2022 - 2032F |
6.6.7 United States (US) CBD Patch Market Revenues & Volume, By Others, 2022 - 2032F |
6.7 United States (US) CBD Patch Market, By Source Type |
6.7.1 Overview and Analysis |
6.7.2 United States (US) CBD Patch Market Revenues & Volume, By Natural, 2022 - 2032F |
6.7.3 United States (US) CBD Patch Market Revenues & Volume, By Synthetic, 2022 - 2032F |
6.8 United States (US) CBD Patch Market, By End User |
6.8.1 Overview and Analysis |
6.8.2 United States (US) CBD Patch Market Revenues & Volume, By Homecare Setting, 2022 - 2032F |
6.8.3 United States (US) CBD Patch Market Revenues & Volume, By Research and Development Centres, 2022 - 2032F |
6.8.4 United States (US) CBD Patch Market Revenues & Volume, By Clinics, 2022 - 2032F |
6.8.5 United States (US) CBD Patch Market Revenues & Volume, By Clinics, 2022 - 2032F |
6.8.6 United States (US) CBD Patch Market Revenues & Volume, By Rehab Centres, 2022 - 2032F |
6.8.7 United States (US) CBD Patch Market Revenues & Volume, By Others, 2022 - 2032F |
7 United States (US) CBD Patch Market Import-Export Trade Statistics |
7.1 United States (US) CBD Patch Market Export to Major Countries |
7.2 United States (US) CBD Patch Market Imports from Major Countries |
8 United States (US) CBD Patch Market Key Performance Indicators |
8.1 Number of clinical studies supporting the efficacy and safety of CBD patches |
8.2 Growth in the number of retail outlets and online platforms offering CBD patches |
8.3 Adoption rate of CBD patches among different age demographics and consumer segments |
9 United States (US) CBD Patch Market - Opportunity Assessment |
9.1 United States (US) CBD Patch Market Opportunity Assessment, By Product, 2022 & 2032F |
9.2 United States (US) CBD Patch Market Opportunity Assessment, By Species, 2022 & 2032F |
9.3 United States (US) CBD Patch Market Opportunity Assessment, By Packaging, 2022 & 2032F |
9.4 United States (US) CBD Patch Market Opportunity Assessment, By Dosage, 2022 & 2032F |
9.5 United States (US) CBD Patch Market Opportunity Assessment, By Derivatives, 2022 & 2032F |
9.6 United States (US) CBD Patch Market Opportunity Assessment, By Application, 2022 & 2032F |
9.7 United States (US) CBD Patch Market Opportunity Assessment, By Source Type, 2022 & 2032F |
9.7 United States (US) CBD Patch Market Opportunity Assessment, By End User, 2022 & 2032F |
10 United States (US) CBD Patch Market - Competitive Landscape |
10.1 United States (US) CBD Patch Market Revenue Share, By Companies, 2025 |
10.2 United States (US) CBD Patch Market Competitive Benchmarking, By Operating and Technical Parameters |
11 Company Profiles |
12 Recommendations |
13 Disclaimer |
Global Go To Market Strategy - 2030
Export potential enables firms to identify high-growth global markets with greater confidence by combining advanced trade intelligence with a structured quantitative methodology. The framework analyzes emerging demand trends and country-level import patterns while integrating macroeconomic and trade datasets such as GDP and population forecasts, bilateral import–export flows, tariff structures, elasticity differentials between developed and developing economies, geographic distance, and import demand projections. Using weighted trade values from 2020–2024 as the base period to project country-to-country export potential for 2030, these inputs are operationalized through calculated drivers such as gravity model parameters, tariff impact factors, and projected GDP per-capita growth. Through an analysis of hidden potentials, demand hotspots, and market conditions that are most favorable to success, this method enables firms to focus on target countries, maximize returns, and global expansion with data, backed by accuracy.
By factoring in the projected importer demand gap that is currently unmet and could be potential opportunity, it identifies the potential for the Exporter (Country) among 190 countries, against the general trade analysis, which identifies the biggest importer or exporter.
To discover high-growth global markets and optimize your business strategy:
Click Here
Pricing
- Single User License$ 1,995
- Department License$ 2,400
- Site License$ 3,120
- Global License$ 3,795

Leadership Perspectives from Industry Events
Search
Thought Leadership and Analyst Meet


Our Clients
6WResearch In News
- India Export Attractiveness Tracker 2026
- India Air Conditioner Market Set for Strong Rebound in 2026 After Weather-Led Correction and GST-Driven Recovery: 6Wresearch
- ADAS in India: How Automatic Emergency Braking, Blind Spot Detection & Driver Monitoring are Transforming Road Safety
- Doha a strategic location for EV manufacturing hub: IPA Qatar
- Demand for luxury TVs surging in the GCC, says Samsung
- Empowering Growth: The Thriving Journey of Bangladesh’s Cable Industry
Latest Reports
- Nicaragua RPG Gaming Market (2026-2032)
- New Zealand RPG Gaming Market (2026-2032)
- Netherlands RPG Gaming Market (2026-2032)
- Nauru RPG Gaming Market (2026-2032)
- Namibia RPG Gaming Market (2026-2032)
- Mozambique RPG Gaming Market (2026-2032)
- Montenegro RPG Gaming Market (2026-2032)
- Mongolia RPG Gaming Market (2026-2032)
- Monaco RPG Gaming Market (2026-2032)
- Micronesia RPG Gaming Market (2026-2032)
Industry Events and Analyst Meet

EV India Expo 2026

HIMTEX 2026

India Refining Summit 2026

India EV Show 2026

EV tech India Expo 2026
Whitepaper
- Middle East & Africa Commercial Security Market Click here to view more.
- Middle East & Africa Fire Safety Systems & Equipment Market Click here to view more.
- GCC Drone Market Click here to view more.
- Middle East Lighting Fixture Market Click here to view more.
- GCC Physical & Perimeter Security Market Click here to view more.