United States (US) Mountain Bicycles Market (2026-2032) | Analysis, Segmentation, Forecast, Competitive Landscape, Growth, Size & Revenue, Outlook, Value, Companies, Trends, Industry, Share
Market Forecast By Type (Cross Country Bikes, All Mountain Bikes, Downhill Bikes, Freeride Bikes, Dirt Jumping Bikes, Trail Mountain), By Product (E-mountain Bikes, Standard Mountain Bikes), By Application (Racing, Leisure), By Distribution Channel (Specialty Bicycle Retailers, Mass Merchants, Full-Line Sporting Goods Store, Outdoor Specialty Store, Others) And Competitive Landscape
| Product Code: ETC9970875 | Publication Date: Sep 2024 | Updated Date: Apr 2026 | Product Type: Market Research Report | |
| Publisher: 6Wresearch | Author: Dhaval Chaurasia | No. of Pages: 75 | No. of Figures: 35 | No. of Tables: 20 |
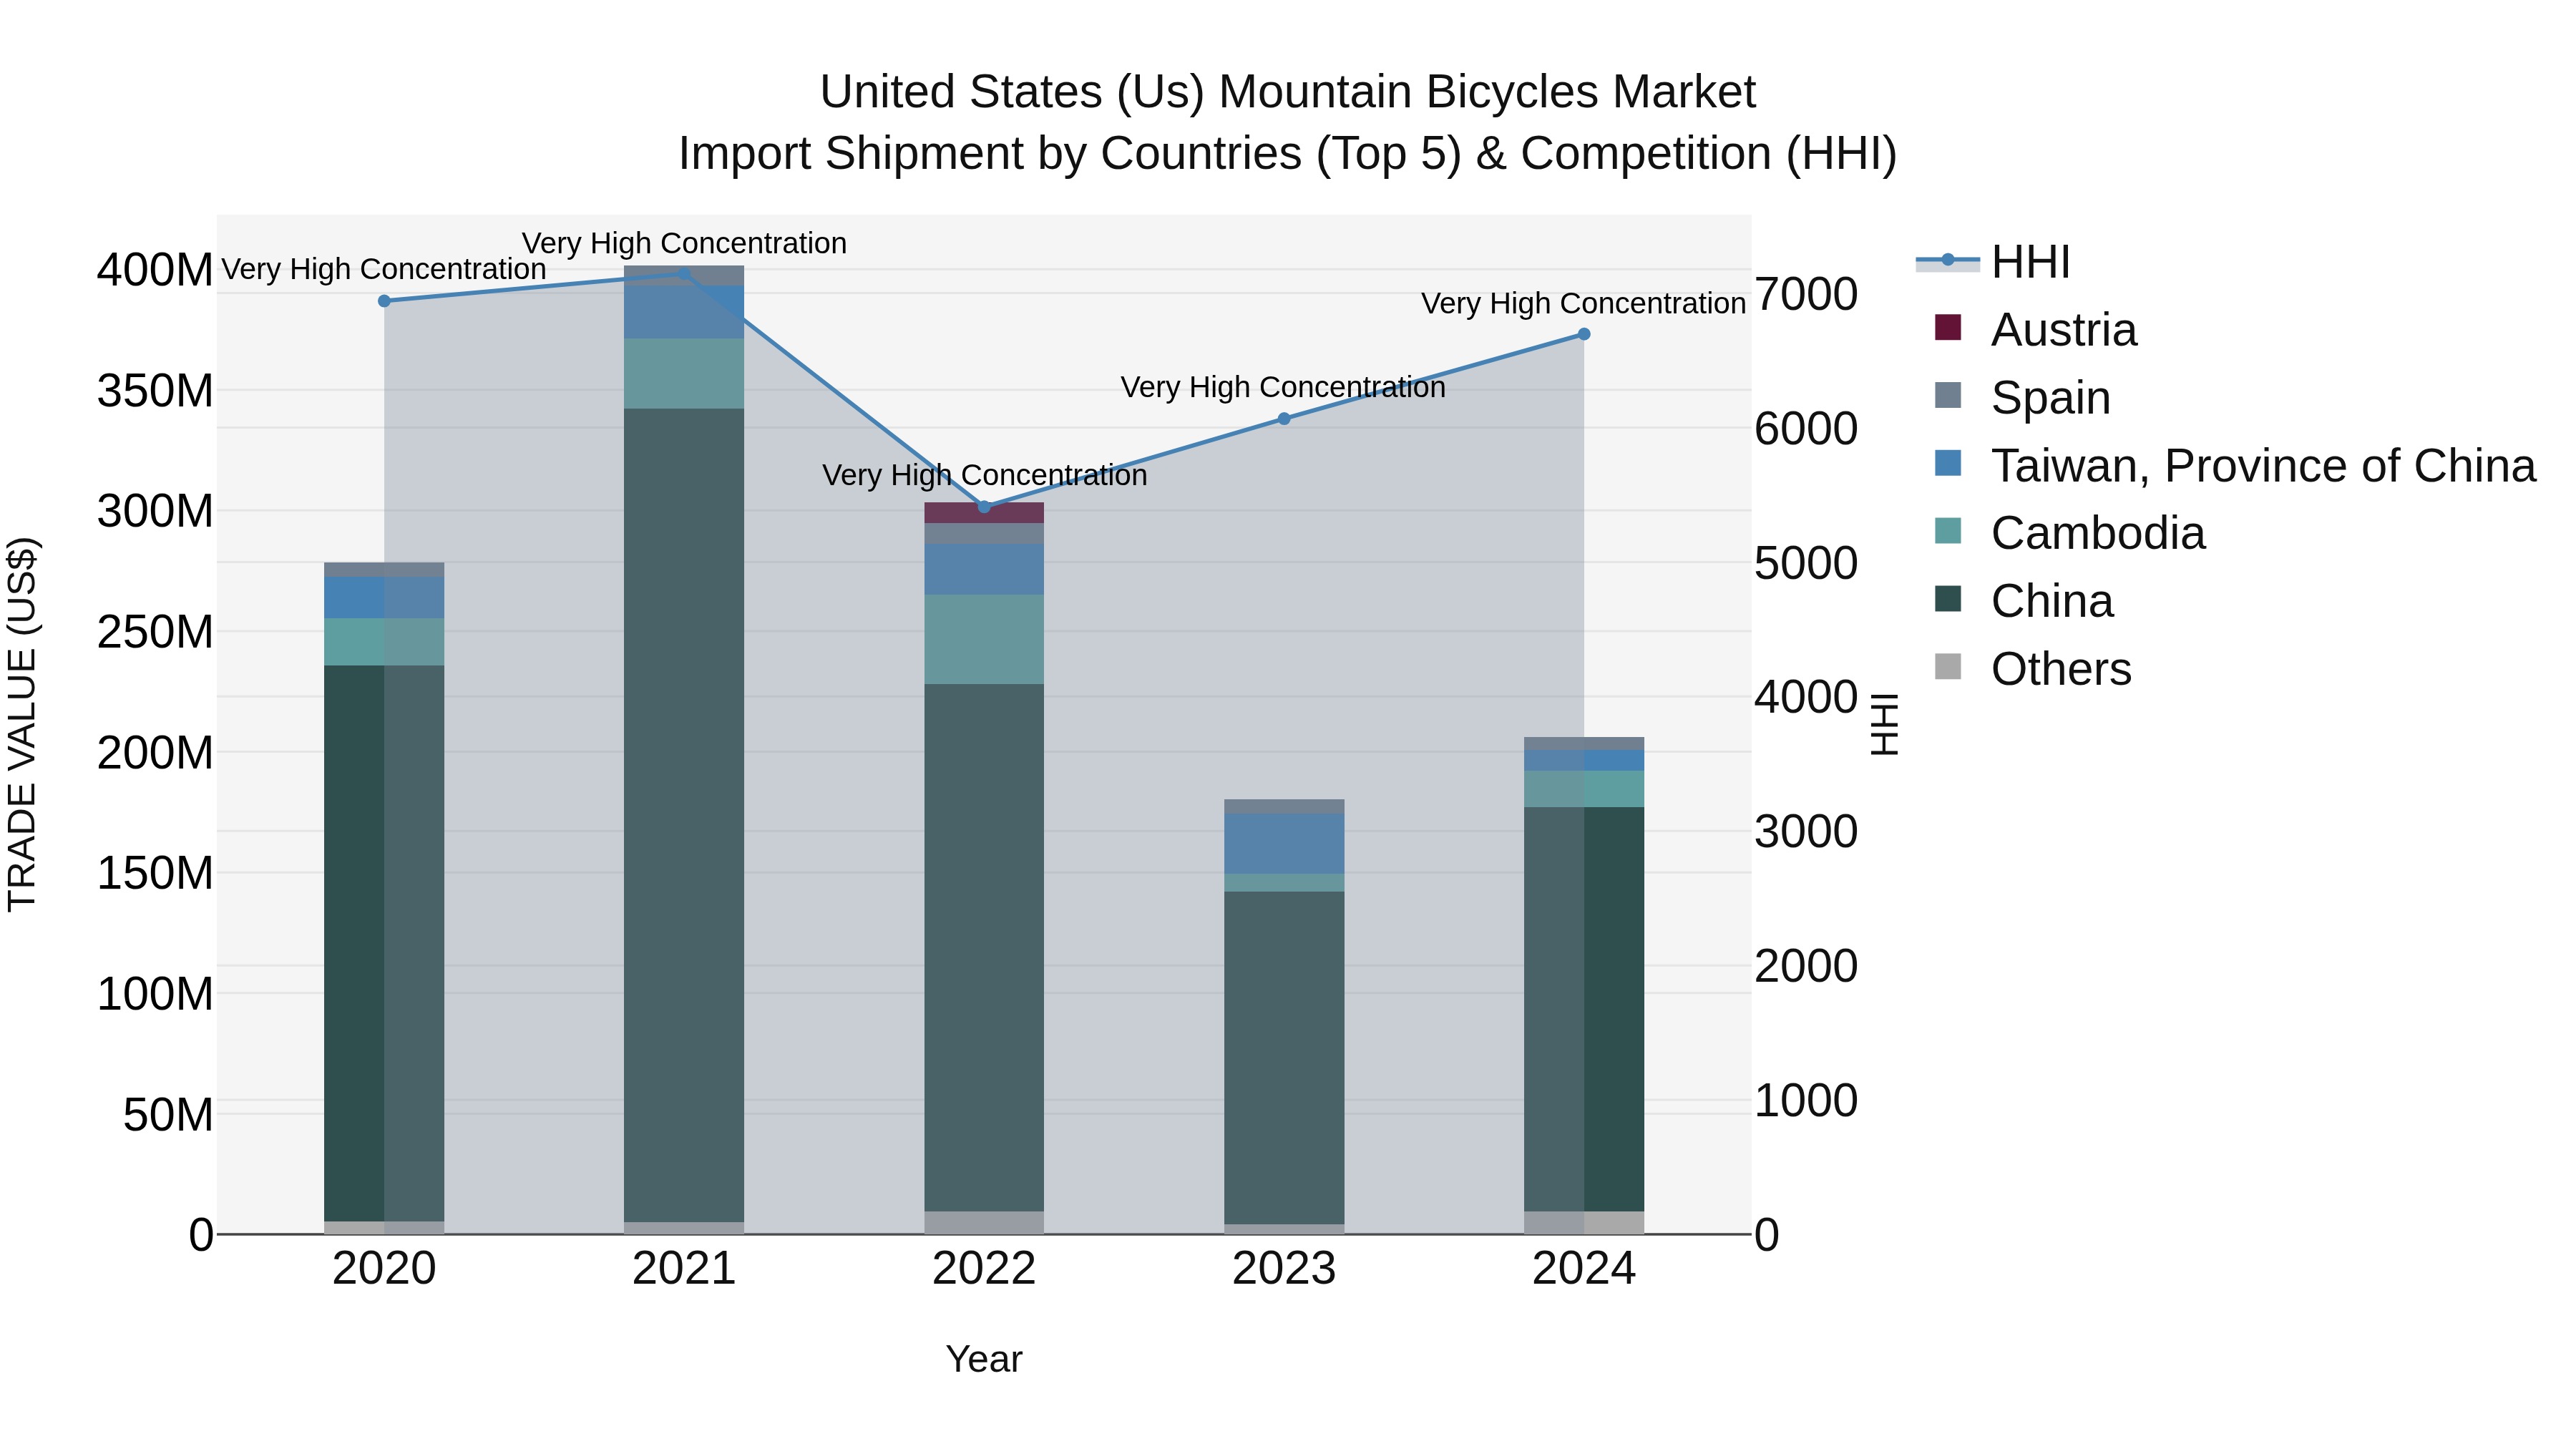
United States (US) Mountain Bicycles Market Top 5 Importing Countries and Market Competition (HHI) Analysis
In 2024, the United States continued to see a significant influx of mountain bicycles imports, with China, Cambodia, Taiwan, Spain, and India leading the pack. Despite a challenging CAGR of -7.25% from 2020 to 2024, the market showed promising growth with a rate of 14.19% from 2023 to 2024. The High Herfindahl-Hirschman Index (HHI) indicates a high level of market concentration, suggesting a competitive landscape dominated by these key exporting countries. The dynamic growth rate in 2024 signals potential opportunities for stakeholders in the US mountain bicycles market.
Key Highlights of the Report:
- United States (US) Mountain Bicycles Market Outlook
- Market Size of United States (US) Mountain Bicycles Market, 2025
- Forecast of United States (US) Mountain Bicycles Market, 2032
- Historical Data and Forecast of United States (US) Mountain Bicycles Revenues & Volume for the Period 2022 - 2032
- United States (US) Mountain Bicycles Market Trend Evolution
- United States (US) Mountain Bicycles Market Drivers and Challenges
- United States (US) Mountain Bicycles Price Trends
- United States (US) Mountain Bicycles Porter's Five Forces
- United States (US) Mountain Bicycles Industry Life Cycle
- Historical Data and Forecast of United States (US) Mountain Bicycles Market Revenues & Volume By Type for the Period 2022 - 2032
- Historical Data and Forecast of United States (US) Mountain Bicycles Market Revenues & Volume By Cross Country Bikes for the Period 2022 - 2032
- Historical Data and Forecast of United States (US) Mountain Bicycles Market Revenues & Volume By All Mountain Bikes for the Period 2022 - 2032
- Historical Data and Forecast of United States (US) Mountain Bicycles Market Revenues & Volume By Downhill Bikes for the Period 2022 - 2032
- Historical Data and Forecast of United States (US) Mountain Bicycles Market Revenues & Volume By Freeride Bikes for the Period 2022 - 2032
- Historical Data and Forecast of United States (US) Mountain Bicycles Market Revenues & Volume By Dirt Jumping Bikes for the Period 2022 - 2032
- Historical Data and Forecast of United States (US) Mountain Bicycles Market Revenues & Volume By Trail Mountain for the Period 2022 - 2032
- Historical Data and Forecast of United States (US) Mountain Bicycles Market Revenues & Volume By Product for the Period 2022 - 2032
- Historical Data and Forecast of United States (US) Mountain Bicycles Market Revenues & Volume By E-mountain Bikes for the Period 2022 - 2032
- Historical Data and Forecast of United States (US) Mountain Bicycles Market Revenues & Volume By Standard Mountain Bikes for the Period 2022 - 2032
- Historical Data and Forecast of United States (US) Mountain Bicycles Market Revenues & Volume By Application for the Period 2022 - 2032
- Historical Data and Forecast of United States (US) Mountain Bicycles Market Revenues & Volume By Racing for the Period 2022 - 2032
- Historical Data and Forecast of United States (US) Mountain Bicycles Market Revenues & Volume By Leisure for the Period 2022 - 2032
- Historical Data and Forecast of United States (US) Mountain Bicycles Market Revenues & Volume By Distribution Channel for the Period 2022 - 2032
- Historical Data and Forecast of United States (US) Mountain Bicycles Market Revenues & Volume By Specialty Bicycle Retailers for the Period 2022 - 2032
- Historical Data and Forecast of United States (US) Mountain Bicycles Market Revenues & Volume By Mass Merchants for the Period 2022 - 2032
- Historical Data and Forecast of United States (US) Mountain Bicycles Market Revenues & Volume By Full-Line Sporting Goods Store for the Period 2022 - 2032
- Historical Data and Forecast of United States (US) Mountain Bicycles Market Revenues & Volume By Outdoor Specialty Store for the Period 2022 - 2032
- Historical Data and Forecast of United States (US) Mountain Bicycles Market Revenues & Volume By Others for the Period 2022 - 2032
- United States (US) Mountain Bicycles Import Export Trade Statistics
- Market Opportunity Assessment By Type
- Market Opportunity Assessment By Product
- Market Opportunity Assessment By Application
- Market Opportunity Assessment By Distribution Channel
- United States (US) Mountain Bicycles Top Companies Market Share
- United States (US) Mountain Bicycles Competitive Benchmarking By Technical and Operational Parameters
- United States (US) Mountain Bicycles Company Profiles
- United States (US) Mountain Bicycles Key Strategic Recommendations
Frequently Asked Questions About the Market Study (FAQs):
6Wresearch actively monitors the United States (US) Mountain Bicycles Market and publishes its comprehensive annual report, highlighting emerging trends, growth drivers, revenue analysis, and forecast outlook. Our insights help businesses to make data-backed strategic decisions with ongoing market dynamics. Our analysts track relevent industries related to the United States (US) Mountain Bicycles Market, allowing our clients with actionable intelligence and reliable forecasts tailored to emerging regional needs.
Yes, we provide customisation as per your requirements. To learn more, feel free to contact us on sales@6wresearch.com
1 Executive Summary |
2 Introduction |
2.1 Key Highlights of the Report |
2.2 Report Description |
2.3 Market Scope & Segmentation |
2.4 Research Methodology |
2.5 Assumptions |
3 United States (US) Mountain Bicycles Market Overview |
3.1 United States (US) Country Macro Economic Indicators |
3.2 United States (US) Mountain Bicycles Market Revenues & Volume, 2022 & 2032F |
3.3 United States (US) Mountain Bicycles Market - Industry Life Cycle |
3.4 United States (US) Mountain Bicycles Market - Porter's Five Forces |
3.5 United States (US) Mountain Bicycles Market Revenues & Volume Share, By Type, 2022 & 2032F |
3.6 United States (US) Mountain Bicycles Market Revenues & Volume Share, By Product, 2022 & 2032F |
3.7 United States (US) Mountain Bicycles Market Revenues & Volume Share, By Application, 2022 & 2032F |
3.8 United States (US) Mountain Bicycles Market Revenues & Volume Share, By Distribution Channel, 2022 & 2032F |
4 United States (US) Mountain Bicycles Market Dynamics |
4.1 Impact Analysis |
4.2 Market Drivers |
4.2.1 Increasing interest in outdoor activities and adventure sports |
4.2.2 Growing health and wellness trends promoting cycling as a fitness activity |
4.2.3 Rising awareness about environmental conservation and sustainable transportation options |
4.3 Market Restraints |
4.3.1 High initial cost of mountain bikes compared to regular bicycles |
4.3.2 Limited accessibility to mountain biking trails in certain regions |
4.3.3 Competition from alternative outdoor recreational activities like hiking or trail running |
5 United States (US) Mountain Bicycles Market Trends |
6 United States (US) Mountain Bicycles Market, By Types |
6.1 United States (US) Mountain Bicycles Market, By Type |
6.1.1 Overview and Analysis |
6.1.2 United States (US) Mountain Bicycles Market Revenues & Volume, By Type, 2022 - 2032F |
6.1.3 United States (US) Mountain Bicycles Market Revenues & Volume, By Cross Country Bikes, 2022 - 2032F |
6.1.4 United States (US) Mountain Bicycles Market Revenues & Volume, By All Mountain Bikes, 2022 - 2032F |
6.1.5 United States (US) Mountain Bicycles Market Revenues & Volume, By Downhill Bikes, 2022 - 2032F |
6.1.6 United States (US) Mountain Bicycles Market Revenues & Volume, By Freeride Bikes, 2022 - 2032F |
6.1.7 United States (US) Mountain Bicycles Market Revenues & Volume, By Dirt Jumping Bikes, 2022 - 2032F |
6.1.8 United States (US) Mountain Bicycles Market Revenues & Volume, By Trail Mountain, 2022 - 2032F |
6.2 United States (US) Mountain Bicycles Market, By Product |
6.2.1 Overview and Analysis |
6.2.2 United States (US) Mountain Bicycles Market Revenues & Volume, By E-mountain Bikes, 2022 - 2032F |
6.2.3 United States (US) Mountain Bicycles Market Revenues & Volume, By Standard Mountain Bikes, 2022 - 2032F |
6.3 United States (US) Mountain Bicycles Market, By Application |
6.3.1 Overview and Analysis |
6.3.2 United States (US) Mountain Bicycles Market Revenues & Volume, By Racing, 2022 - 2032F |
6.3.3 United States (US) Mountain Bicycles Market Revenues & Volume, By Leisure, 2022 - 2032F |
6.4 United States (US) Mountain Bicycles Market, By Distribution Channel |
6.4.1 Overview and Analysis |
6.4.2 United States (US) Mountain Bicycles Market Revenues & Volume, By Specialty Bicycle Retailers, 2022 - 2032F |
6.4.3 United States (US) Mountain Bicycles Market Revenues & Volume, By Mass Merchants, 2022 - 2032F |
6.4.4 United States (US) Mountain Bicycles Market Revenues & Volume, By Full-Line Sporting Goods Store, 2022 - 2032F |
6.4.5 United States (US) Mountain Bicycles Market Revenues & Volume, By Outdoor Specialty Store, 2022 - 2032F |
6.4.6 United States (US) Mountain Bicycles Market Revenues & Volume, By Others, 2022 - 2032F |
7 United States (US) Mountain Bicycles Market Import-Export Trade Statistics |
7.1 United States (US) Mountain Bicycles Market Export to Major Countries |
7.2 United States (US) Mountain Bicycles Market Imports from Major Countries |
8 United States (US) Mountain Bicycles Market Key Performance Indicators |
8.1 Number of new mountain biking trails developed or upgraded in the US |
8.2 Participation rates in mountain biking events or races |
8.3 Percentage of households with at least one member owning a mountain bike |
8.4 Average time spent on mountain biking activities per participant |
8.5 Number of mountain biking clubs or communities established in the US |
9 United States (US) Mountain Bicycles Market - Opportunity Assessment |
9.1 United States (US) Mountain Bicycles Market Opportunity Assessment, By Type, 2022 & 2032F |
9.2 United States (US) Mountain Bicycles Market Opportunity Assessment, By Product, 2022 & 2032F |
9.3 United States (US) Mountain Bicycles Market Opportunity Assessment, By Application, 2022 & 2032F |
9.4 United States (US) Mountain Bicycles Market Opportunity Assessment, By Distribution Channel, 2022 & 2032F |
10 United States (US) Mountain Bicycles Market - Competitive Landscape |
10.1 United States (US) Mountain Bicycles Market Revenue Share, By Companies, 2025 |
10.2 United States (US) Mountain Bicycles Market Competitive Benchmarking, By Operating and Technical Parameters |
11 Company Profiles |
12 Recommendations |
13 Disclaimer |
Export potential assessment - trade Analytics for 2030
Export potential enables firms to identify high-growth global markets with greater confidence by combining advanced trade intelligence with a structured quantitative methodology. The framework analyzes emerging demand trends and country-level import patterns while integrating macroeconomic and trade datasets such as GDP and population forecasts, bilateral import–export flows, tariff structures, elasticity differentials between developed and developing economies, geographic distance, and import demand projections. Using weighted trade values from 2020–2024 as the base period to project country-to-country export potential for 2030, these inputs are operationalized through calculated drivers such as gravity model parameters, tariff impact factors, and projected GDP per-capita growth. Through an analysis of hidden potentials, demand hotspots, and market conditions that are most favorable to success, this method enables firms to focus on target countries, maximize returns, and global expansion with data, backed by accuracy.
By factoring in the projected importer demand gap that is currently unmet and could be potential opportunity, it identifies the potential for the Exporter (Country) among 190 countries, against the general trade analysis, which identifies the biggest importer or exporter.
To discover high-growth global markets and optimize your business strategy:
Click Here
Pricing
- Single User License$ 1,995
- Department License$ 2,400
- Site License$ 3,120
- Global License$ 3,795

Search
Thought Leadership and Analyst Meet


Our Clients
Latest Reports
- China Electric Appliance Rental Market (2026-2032) | Trends, Revenue, Growth, Challenges, Size, Value, Outlook, Pricing, Strategy, Insights, Restraints, segmentation, Companies, Investment Opportunities, Analysis, Demand, Drivers, Competition, Forecast, Share
- Chile Electric Appliance Rental Market (2026-2032) | Outlook, Competition, Drivers, Strategy, Revenue, Analysis, Value, Pricing, Restraints, Size, Demand, Share, Growth, Forecast, Challenges, Insights, Investment Opportunities, Companies, Trends, segmentation
- Cambodia Electric Appliance Rental Market (2026-2032) | Companies, Analysis, Restraints, Pricing, Insights, Challenges, Outlook, Strategy, Forecast, Trends, Competition, Value, Revenue, Investment Opportunities, segmentation, Drivers, Size, Demand, Growth, Share
- Brazil Electric Appliance Rental Market (2026-2032) | Revenue, Strategy, Forecast, Companies, segmentation, Competition, Size, Investment Opportunities, Pricing, Restraints, Outlook, Challenges, Analysis, Drivers, Value, Demand, Insights, Trends, Growth, Share
- Bangladesh Electric Appliance Rental Market (2026-2032) | Drivers, Forecast, Investment Opportunities, Strategy, Insights, Demand, Challenges, Outlook, Trends, Competition, Value, Revenue, Size, Pricing, Analysis, Companies, Restraints, segmentation, Share, Growth
- Bahrain Electric Appliance Rental Market (2026-2032) | Outlook, Size, Competition, Restraints, Drivers, Value, Trends, Investment Opportunities, Insights, Forecast, Revenue, Strategy, Growth, Share, Demand, Analysis, Challenges, Companies, segmentation, Pricing
- Azerbaijan Electric Appliance Rental Market (2026-2032) | Trends, Investment Opportunities, Restraints, Insights, Strategy, Competition, Value, Growth, Demand, Drivers, Analysis, Forecast, Size, Share, Outlook, segmentation, Pricing, Challenges, Revenue, Companies
- Australia Electric Appliance Rental Market (2026-2032) | Challenges, Restraints, Forecast, Demand, Size, Competition, Pricing, Investment Opportunities, Revenue, Trends, Drivers, Growth, Outlook, Analysis, Strategy, Value, segmentation, Insights, Companies, Share
- Argentina Electric Appliance Rental Market (2026-2032) | Growth, Trends, Insights, Outlook, Forecast, Size, Drivers, Analysis, Restraints, Challenges, Share, Revenue, Investment Opportunities, Strategy, Demand, Value, Companies, segmentation, Competition, Pricing
- Algeria Electric Appliance Rental Market (2026-2032) | Share, Size, Value, Strategy, Competition, Outlook, Challenges, Companies, Trends, Pricing, Insights, Forecast, Investment Opportunities, Revenue, Growth, Restraints, segmentation, Analysis, Demand, Drivers
Industry Events and Analyst Meet

HIMTEX 2026

India Refining Summit 2026

India EV Show 2026

EV tech India Expo 2026

Auto Tech Asia 2026
Whitepaper
- Middle East & Africa Commercial Security Market Click here to view more.
- Middle East & Africa Fire Safety Systems & Equipment Market Click here to view more.
- GCC Drone Market Click here to view more.
- Middle East Lighting Fixture Market Click here to view more.
- GCC Physical & Perimeter Security Market Click here to view more.
6WResearch In News
- Doha a strategic location for EV manufacturing hub: IPA Qatar
- Demand for luxury TVs surging in the GCC, says Samsung
- Empowering Growth: The Thriving Journey of Bangladesh’s Cable Industry
- Demand for luxury TVs surging in the GCC, says Samsung
- Video call with a traditional healer? Once unthinkable, it’s now common in South Africa
- Intelligent Buildings To Smooth GCC’s Path To Net Zero