United States (US) Oviposition-Deterring Pheromones Market (2026-2032) | Forecast, Value, Size & Revenue, Companies, Analysis, Competitive Landscape, Growth, Trends, Segmentation, Industry, Outlook, Share
Market Forecast By Application (Insect Monitoring, Insect Population Control, Crops Protection), By Crop Type (Field Crops, Fruits and Nuts, Vegetable Crops), By Function (Mating Disruption, Mass Trapping and Detection, Monitoring), By Mode of Application (Traps, Dispensers, Sprays) And Competitive Landscape
| Product Code: ETC9972580 | Publication Date: Sep 2024 | Updated Date: Apr 2026 | Product Type: Market Research Report | |
| Publisher: 6Wresearch | Author: Dhaval Chaurasia | No. of Pages: 75 | No. of Figures: 35 | No. of Tables: 20 |
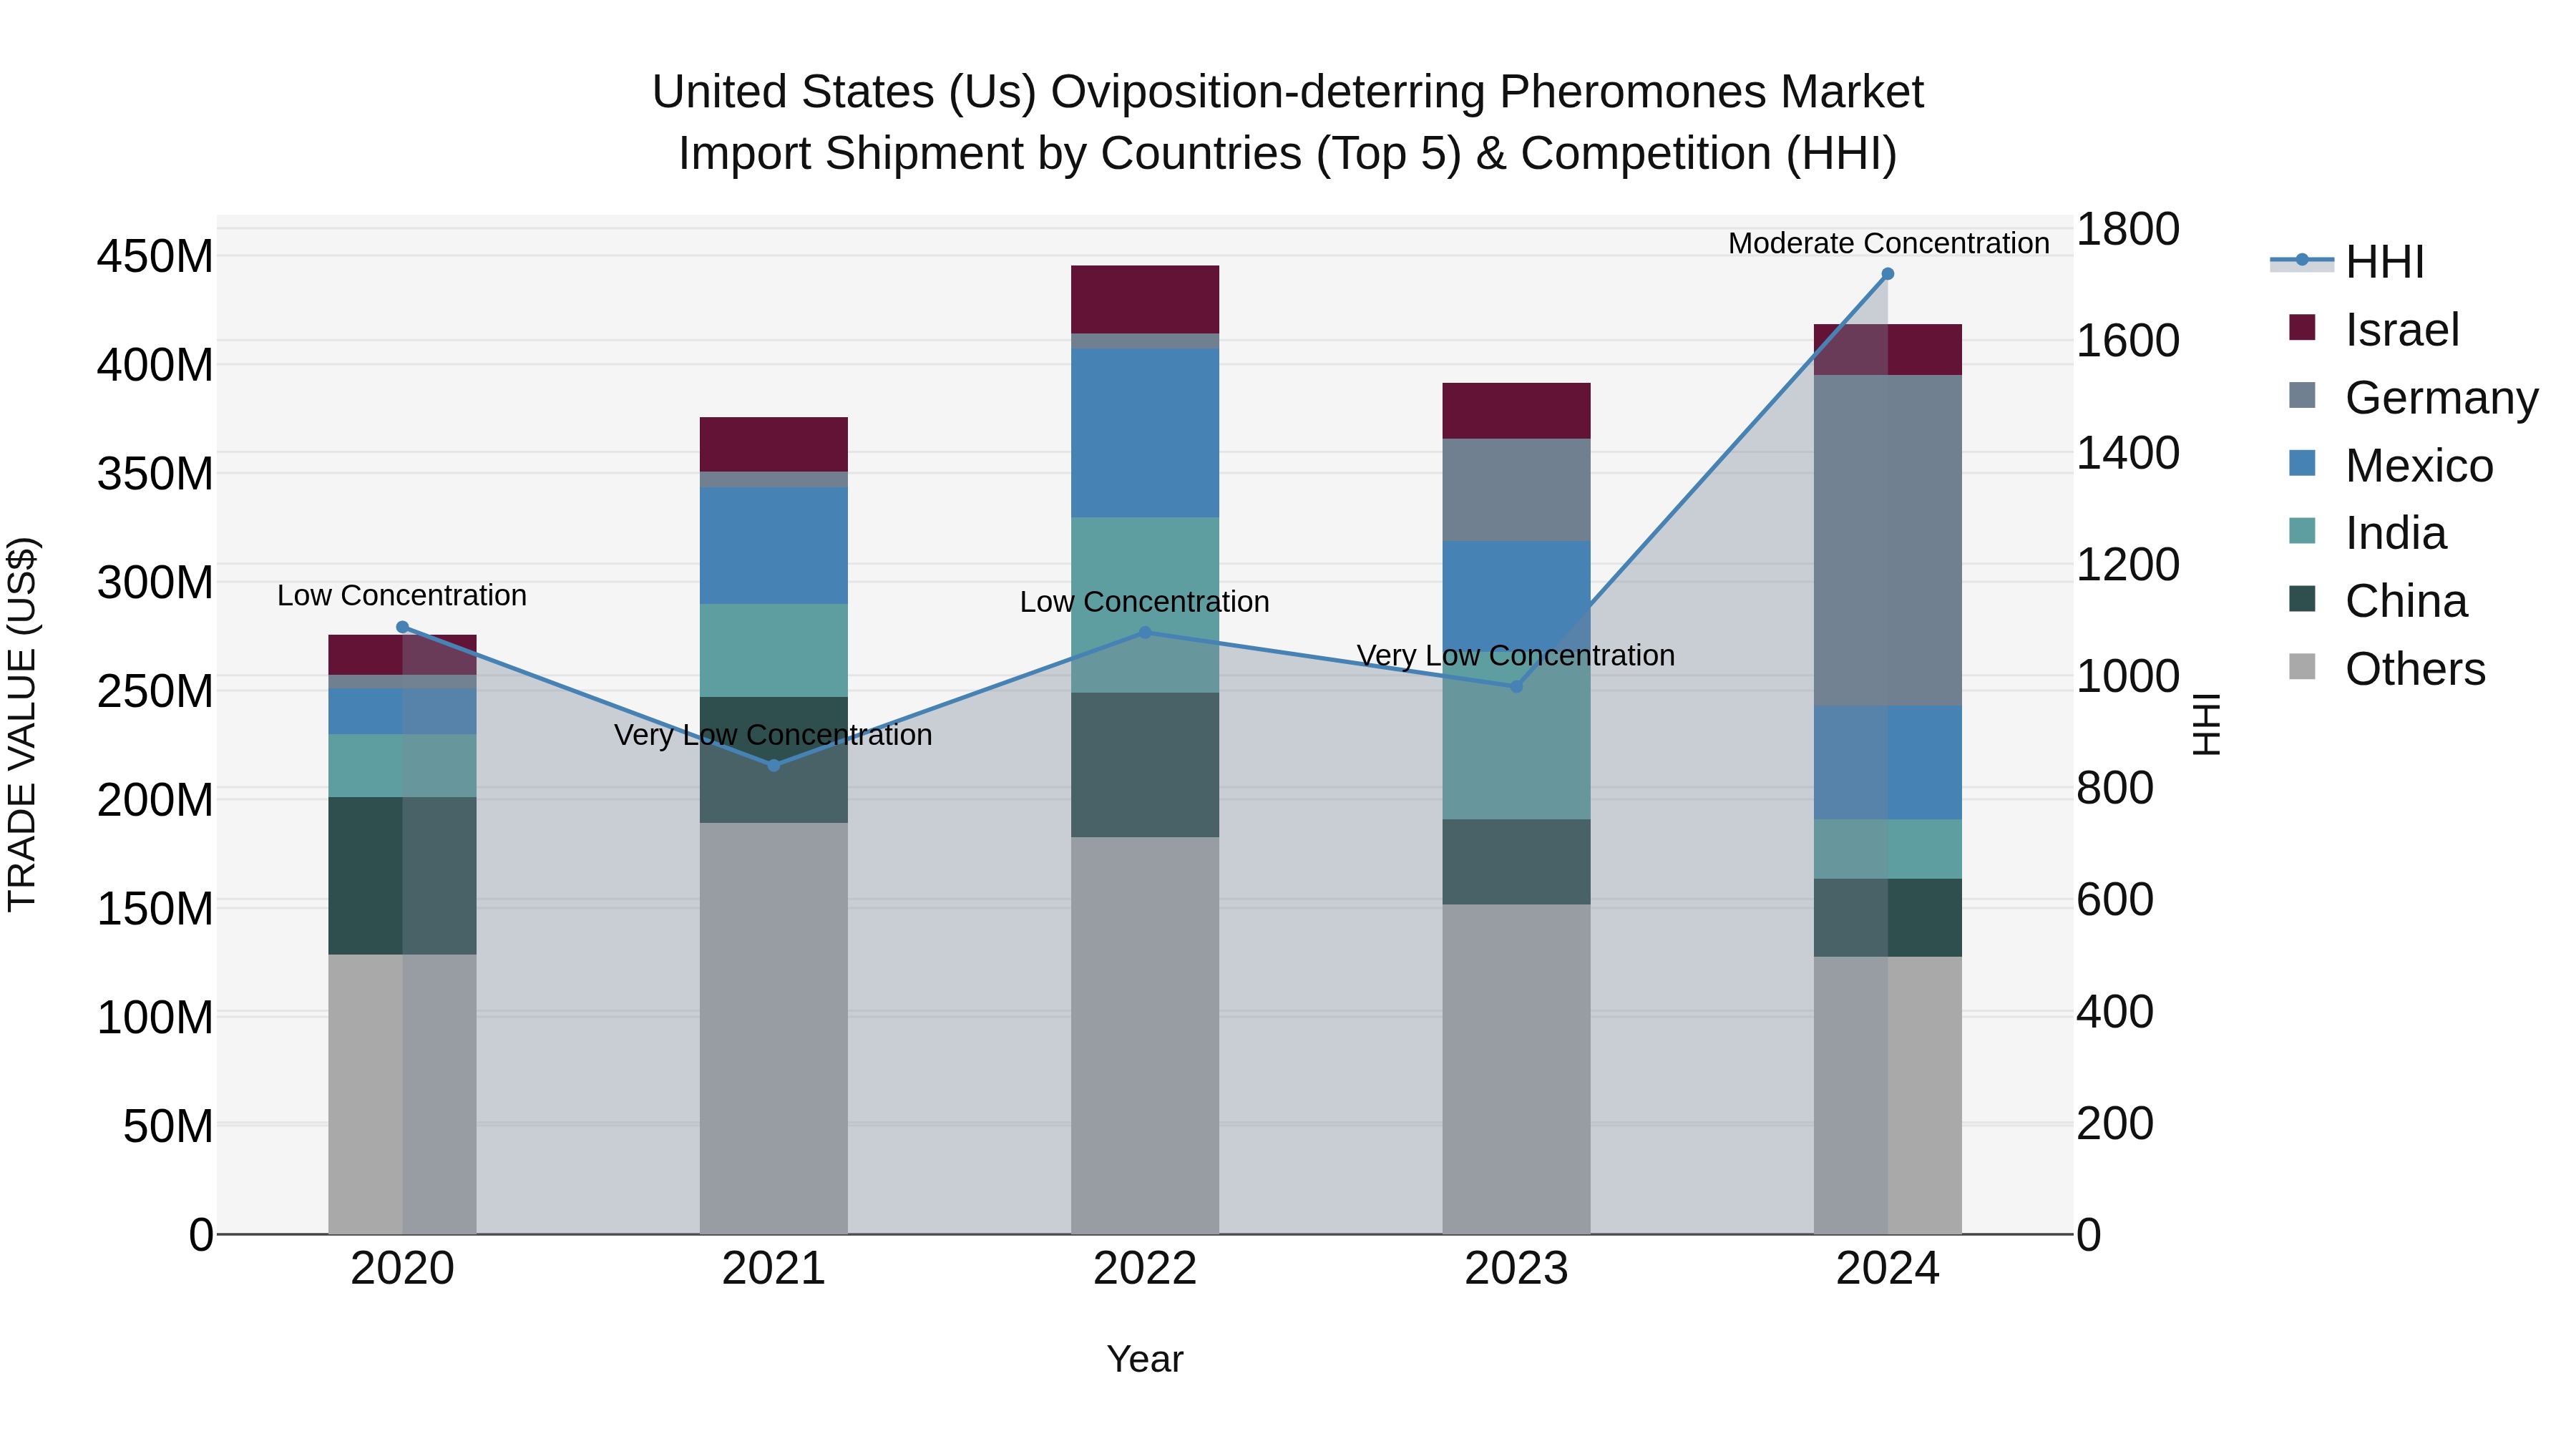
United States (US) Oviposition-deterring Pheromones Market Top 5 Importing Countries and Market Competition (HHI) Analysis
The United States saw an increase in import shipments of oviposition-deterring pheromones in 2024, with top exporting countries including Germany, Mexico, China, India, and Israel. The Herfindahl-Hirschman Index (HHI) indicated a shift from low to moderate concentration, reflecting growing market diversification. The compound annual growth rate (CAGR) from 2020 to 2024 was a strong 10.99%, with a notable growth rate of 6.85% from 2023 to 2024. These trends suggest a rising demand for oviposition-deterring pheromones in the US market, attracting a wider range of suppliers.
Key Highlights of the Report:
- United States (US) Oviposition-Deterring Pheromones Market Outlook
- Market Size of United States (US) Oviposition-Deterring Pheromones Market, 2025
- Forecast of United States (US) Oviposition-Deterring Pheromones Market, 2032
- Historical Data and Forecast of United States (US) Oviposition-Deterring Pheromones Revenues & Volume for the Period 2022 - 2032
- United States (US) Oviposition-Deterring Pheromones Market Trend Evolution
- United States (US) Oviposition-Deterring Pheromones Market Drivers and Challenges
- United States (US) Oviposition-Deterring Pheromones Price Trends
- United States (US) Oviposition-Deterring Pheromones Porter's Five Forces
- United States (US) Oviposition-Deterring Pheromones Industry Life Cycle
- Historical Data and Forecast of United States (US) Oviposition-Deterring Pheromones Market Revenues & Volume By Application for the Period 2022 - 2032
- Historical Data and Forecast of United States (US) Oviposition-Deterring Pheromones Market Revenues & Volume By Insect Monitoring for the Period 2022 - 2032
- Historical Data and Forecast of United States (US) Oviposition-Deterring Pheromones Market Revenues & Volume By Insect Population Control for the Period 2022 - 2032
- Historical Data and Forecast of United States (US) Oviposition-Deterring Pheromones Market Revenues & Volume By Crops Protection for the Period 2022 - 2032
- Historical Data and Forecast of United States (US) Oviposition-Deterring Pheromones Market Revenues & Volume By Crop Type for the Period 2022 - 2032
- Historical Data and Forecast of United States (US) Oviposition-Deterring Pheromones Market Revenues & Volume By Field Crops for the Period 2022 - 2032
- Historical Data and Forecast of United States (US) Oviposition-Deterring Pheromones Market Revenues & Volume By Fruits and Nuts for the Period 2022 - 2032
- Historical Data and Forecast of United States (US) Oviposition-Deterring Pheromones Market Revenues & Volume By Vegetable Crops for the Period 2022 - 2032
- Historical Data and Forecast of United States (US) Oviposition-Deterring Pheromones Market Revenues & Volume By Function for the Period 2022 - 2032
- Historical Data and Forecast of United States (US) Oviposition-Deterring Pheromones Market Revenues & Volume By Mating Disruption for the Period 2022 - 2032
- Historical Data and Forecast of United States (US) Oviposition-Deterring Pheromones Market Revenues & Volume By Mass Trapping and Detection for the Period 2022 - 2032
- Historical Data and Forecast of United States (US) Oviposition-Deterring Pheromones Market Revenues & Volume By Monitoring for the Period 2022 - 2032
- Historical Data and Forecast of United States (US) Oviposition-Deterring Pheromones Market Revenues & Volume By Mode of Application for the Period 2022 - 2032
- Historical Data and Forecast of United States (US) Oviposition-Deterring Pheromones Market Revenues & Volume By Traps for the Period 2022 - 2032
- Historical Data and Forecast of United States (US) Oviposition-Deterring Pheromones Market Revenues & Volume By Dispensers for the Period 2022 - 2032
- Historical Data and Forecast of United States (US) Oviposition-Deterring Pheromones Market Revenues & Volume By Sprays for the Period 2022 - 2032
- United States (US) Oviposition-Deterring Pheromones Import Export Trade Statistics
- Market Opportunity Assessment By Application
- Market Opportunity Assessment By Crop Type
- Market Opportunity Assessment By Function
- Market Opportunity Assessment By Mode of Application
- United States (US) Oviposition-Deterring Pheromones Top Companies Market Share
- United States (US) Oviposition-Deterring Pheromones Competitive Benchmarking By Technical and Operational Parameters
- United States (US) Oviposition-Deterring Pheromones Company Profiles
- United States (US) Oviposition-Deterring Pheromones Key Strategic Recommendations
Frequently Asked Questions About the Market Study (FAQs):
6Wresearch actively monitors the United States (US) Oviposition-Deterring Pheromones Market and publishes its comprehensive annual report, highlighting emerging trends, growth drivers, revenue analysis, and forecast outlook. Our insights help businesses to make data-backed strategic decisions with ongoing market dynamics. Our analysts track relevent industries related to the United States (US) Oviposition-Deterring Pheromones Market, allowing our clients with actionable intelligence and reliable forecasts tailored to emerging regional needs.
Yes, we provide customisation as per your requirements. To learn more, feel free to contact us on sales@6wresearch.com
1 Executive Summary |
2 Introduction |
2.1 Key Highlights of the Report |
2.2 Report Description |
2.3 Market Scope & Segmentation |
2.4 Research Methodology |
2.5 Assumptions |
3 United States (US) Oviposition-Deterring Pheromones Market Overview |
3.1 United States (US) Country Macro Economic Indicators |
3.2 United States (US) Oviposition-Deterring Pheromones Market Revenues & Volume, 2022 & 2032F |
3.3 United States (US) Oviposition-Deterring Pheromones Market - Industry Life Cycle |
3.4 United States (US) Oviposition-Deterring Pheromones Market - Porter's Five Forces |
3.5 United States (US) Oviposition-Deterring Pheromones Market Revenues & Volume Share, By Application, 2022 & 2032F |
3.6 United States (US) Oviposition-Deterring Pheromones Market Revenues & Volume Share, By Crop Type, 2022 & 2032F |
3.7 United States (US) Oviposition-Deterring Pheromones Market Revenues & Volume Share, By Function, 2022 & 2032F |
3.8 United States (US) Oviposition-Deterring Pheromones Market Revenues & Volume Share, By Mode of Application, 2022 & 2032F |
4 United States (US) Oviposition-Deterring Pheromones Market Dynamics |
4.1 Impact Analysis |
4.2 Market Drivers |
4.2.1 Increasing awareness about environmentally friendly pest control solutions |
4.2.2 Growing concerns about pesticide resistance and environmental impact |
4.2.3 Rising demand for organic and sustainable agriculture practices |
4.3 Market Restraints |
4.3.1 Limited regulatory approval for oviposition-deterring pheromones |
4.3.2 High costs associated with developing and producing pheromone-based products |
4.3.3 Lack of understanding and acceptance among traditional farmers |
5 United States (US) Oviposition-Deterring Pheromones Market Trends |
6 United States (US) Oviposition-Deterring Pheromones Market, By Types |
6.1 United States (US) Oviposition-Deterring Pheromones Market, By Application |
6.1.1 Overview and Analysis |
6.1.2 United States (US) Oviposition-Deterring Pheromones Market Revenues & Volume, By Application, 2022 - 2032F |
6.1.3 United States (US) Oviposition-Deterring Pheromones Market Revenues & Volume, By Insect Monitoring, 2022 - 2032F |
6.1.4 United States (US) Oviposition-Deterring Pheromones Market Revenues & Volume, By Insect Population Control, 2022 - 2032F |
6.1.5 United States (US) Oviposition-Deterring Pheromones Market Revenues & Volume, By Crops Protection, 2022 - 2032F |
6.2 United States (US) Oviposition-Deterring Pheromones Market, By Crop Type |
6.2.1 Overview and Analysis |
6.2.2 United States (US) Oviposition-Deterring Pheromones Market Revenues & Volume, By Field Crops, 2022 - 2032F |
6.2.3 United States (US) Oviposition-Deterring Pheromones Market Revenues & Volume, By Fruits and Nuts, 2022 - 2032F |
6.2.4 United States (US) Oviposition-Deterring Pheromones Market Revenues & Volume, By Vegetable Crops, 2022 - 2032F |
6.3 United States (US) Oviposition-Deterring Pheromones Market, By Function |
6.3.1 Overview and Analysis |
6.3.2 United States (US) Oviposition-Deterring Pheromones Market Revenues & Volume, By Mating Disruption, 2022 - 2032F |
6.3.3 United States (US) Oviposition-Deterring Pheromones Market Revenues & Volume, By Mass Trapping and Detection, 2022 - 2032F |
6.3.4 United States (US) Oviposition-Deterring Pheromones Market Revenues & Volume, By Monitoring, 2022 - 2032F |
6.4 United States (US) Oviposition-Deterring Pheromones Market, By Mode of Application |
6.4.1 Overview and Analysis |
6.4.2 United States (US) Oviposition-Deterring Pheromones Market Revenues & Volume, By Traps, 2022 - 2032F |
6.4.3 United States (US) Oviposition-Deterring Pheromones Market Revenues & Volume, By Dispensers, 2022 - 2032F |
6.4.4 United States (US) Oviposition-Deterring Pheromones Market Revenues & Volume, By Sprays, 2022 - 2032F |
7 United States (US) Oviposition-Deterring Pheromones Market Import-Export Trade Statistics |
7.1 United States (US) Oviposition-Deterring Pheromones Market Export to Major Countries |
7.2 United States (US) Oviposition-Deterring Pheromones Market Imports from Major Countries |
8 United States (US) Oviposition-Deterring Pheromones Market Key Performance Indicators |
8.1 Number of research studies on the effectiveness of oviposition-deterring pheromones in pest control |
8.2 Adoption rate of integrated pest management practices in the agriculture sector |
8.3 Percentage of farmers using non-chemical pest control methods |
9 United States (US) Oviposition-Deterring Pheromones Market - Opportunity Assessment |
9.1 United States (US) Oviposition-Deterring Pheromones Market Opportunity Assessment, By Application, 2022 & 2032F |
9.2 United States (US) Oviposition-Deterring Pheromones Market Opportunity Assessment, By Crop Type, 2022 & 2032F |
9.3 United States (US) Oviposition-Deterring Pheromones Market Opportunity Assessment, By Function, 2022 & 2032F |
9.4 United States (US) Oviposition-Deterring Pheromones Market Opportunity Assessment, By Mode of Application, 2022 & 2032F |
10 United States (US) Oviposition-Deterring Pheromones Market - Competitive Landscape |
10.1 United States (US) Oviposition-Deterring Pheromones Market Revenue Share, By Companies, 2025 |
10.2 United States (US) Oviposition-Deterring Pheromones Market Competitive Benchmarking, By Operating and Technical Parameters |
11 Company Profiles |
12 Recommendations |
13 Disclaimer |
Export potential assessment - trade Analytics for 2030
Export potential enables firms to identify high-growth global markets with greater confidence by combining advanced trade intelligence with a structured quantitative methodology. The framework analyzes emerging demand trends and country-level import patterns while integrating macroeconomic and trade datasets such as GDP and population forecasts, bilateral import–export flows, tariff structures, elasticity differentials between developed and developing economies, geographic distance, and import demand projections. Using weighted trade values from 2020–2024 as the base period to project country-to-country export potential for 2030, these inputs are operationalized through calculated drivers such as gravity model parameters, tariff impact factors, and projected GDP per-capita growth. Through an analysis of hidden potentials, demand hotspots, and market conditions that are most favorable to success, this method enables firms to focus on target countries, maximize returns, and global expansion with data, backed by accuracy.
By factoring in the projected importer demand gap that is currently unmet and could be potential opportunity, it identifies the potential for the Exporter (Country) among 190 countries, against the general trade analysis, which identifies the biggest importer or exporter.
To discover high-growth global markets and optimize your business strategy:
Click Here
Pricing
- Single User License$ 1,995
- Department License$ 2,400
- Site License$ 3,120
- Global License$ 3,795

Search
Thought Leadership and Analyst Meet


Our Clients
Latest Reports
- China Electric Appliance Rental Market (2026-2032) | Trends, Revenue, Growth, Challenges, Size, Value, Outlook, Pricing, Strategy, Insights, Restraints, segmentation, Companies, Investment Opportunities, Analysis, Demand, Drivers, Competition, Forecast, Share
- Chile Electric Appliance Rental Market (2026-2032) | Outlook, Competition, Drivers, Strategy, Revenue, Analysis, Value, Pricing, Restraints, Size, Demand, Share, Growth, Forecast, Challenges, Insights, Investment Opportunities, Companies, Trends, segmentation
- Cambodia Electric Appliance Rental Market (2026-2032) | Companies, Analysis, Restraints, Pricing, Insights, Challenges, Outlook, Strategy, Forecast, Trends, Competition, Value, Revenue, Investment Opportunities, segmentation, Drivers, Size, Demand, Growth, Share
- Brazil Electric Appliance Rental Market (2026-2032) | Revenue, Strategy, Forecast, Companies, segmentation, Competition, Size, Investment Opportunities, Pricing, Restraints, Outlook, Challenges, Analysis, Drivers, Value, Demand, Insights, Trends, Growth, Share
- Bangladesh Electric Appliance Rental Market (2026-2032) | Drivers, Forecast, Investment Opportunities, Strategy, Insights, Demand, Challenges, Outlook, Trends, Competition, Value, Revenue, Size, Pricing, Analysis, Companies, Restraints, segmentation, Share, Growth
- Bahrain Electric Appliance Rental Market (2026-2032) | Outlook, Size, Competition, Restraints, Drivers, Value, Trends, Investment Opportunities, Insights, Forecast, Revenue, Strategy, Growth, Share, Demand, Analysis, Challenges, Companies, segmentation, Pricing
- Azerbaijan Electric Appliance Rental Market (2026-2032) | Trends, Investment Opportunities, Restraints, Insights, Strategy, Competition, Value, Growth, Demand, Drivers, Analysis, Forecast, Size, Share, Outlook, segmentation, Pricing, Challenges, Revenue, Companies
- Australia Electric Appliance Rental Market (2026-2032) | Challenges, Restraints, Forecast, Demand, Size, Competition, Pricing, Investment Opportunities, Revenue, Trends, Drivers, Growth, Outlook, Analysis, Strategy, Value, segmentation, Insights, Companies, Share
- Argentina Electric Appliance Rental Market (2026-2032) | Growth, Trends, Insights, Outlook, Forecast, Size, Drivers, Analysis, Restraints, Challenges, Share, Revenue, Investment Opportunities, Strategy, Demand, Value, Companies, segmentation, Competition, Pricing
- Algeria Electric Appliance Rental Market (2026-2032) | Share, Size, Value, Strategy, Competition, Outlook, Challenges, Companies, Trends, Pricing, Insights, Forecast, Investment Opportunities, Revenue, Growth, Restraints, segmentation, Analysis, Demand, Drivers
Industry Events and Analyst Meet

HIMTEX 2026

India Refining Summit 2026

India EV Show 2026

EV tech India Expo 2026

Auto Tech Asia 2026
Whitepaper
- Middle East & Africa Commercial Security Market Click here to view more.
- Middle East & Africa Fire Safety Systems & Equipment Market Click here to view more.
- GCC Drone Market Click here to view more.
- Middle East Lighting Fixture Market Click here to view more.
- GCC Physical & Perimeter Security Market Click here to view more.
6WResearch In News
- Doha a strategic location for EV manufacturing hub: IPA Qatar
- Demand for luxury TVs surging in the GCC, says Samsung
- Empowering Growth: The Thriving Journey of Bangladesh’s Cable Industry
- Demand for luxury TVs surging in the GCC, says Samsung
- Video call with a traditional healer? Once unthinkable, it’s now common in South Africa
- Intelligent Buildings To Smooth GCC’s Path To Net Zero