United States (US) Phosphorus Market Outlook | Trends, Size, Value, Forecast, Revenue, Share, Industry, Analysis, Companies, Growth & COVID-19 IMPACT
Market Forecast By Type (White phosphorus, Red phosphorus, Phosphorous chloride, Phosphoric acid, Industrial phosphates, Phosphorous penta-oxide), By Application (Detergents, Water treatment, Flame retardants, Batteries, Chemical intermediates, Fertilizers) And Competitive Landscape
| Product Code: ETC198253 | Publication Date: May 2022 | Updated Date: Nov 2025 | Product Type: Market Research Report | |
| Publisher: 6Wresearch | Author: Sumit Sagar | No. of Pages: 60 | No. of Figures: 40 | No. of Tables: 7 |
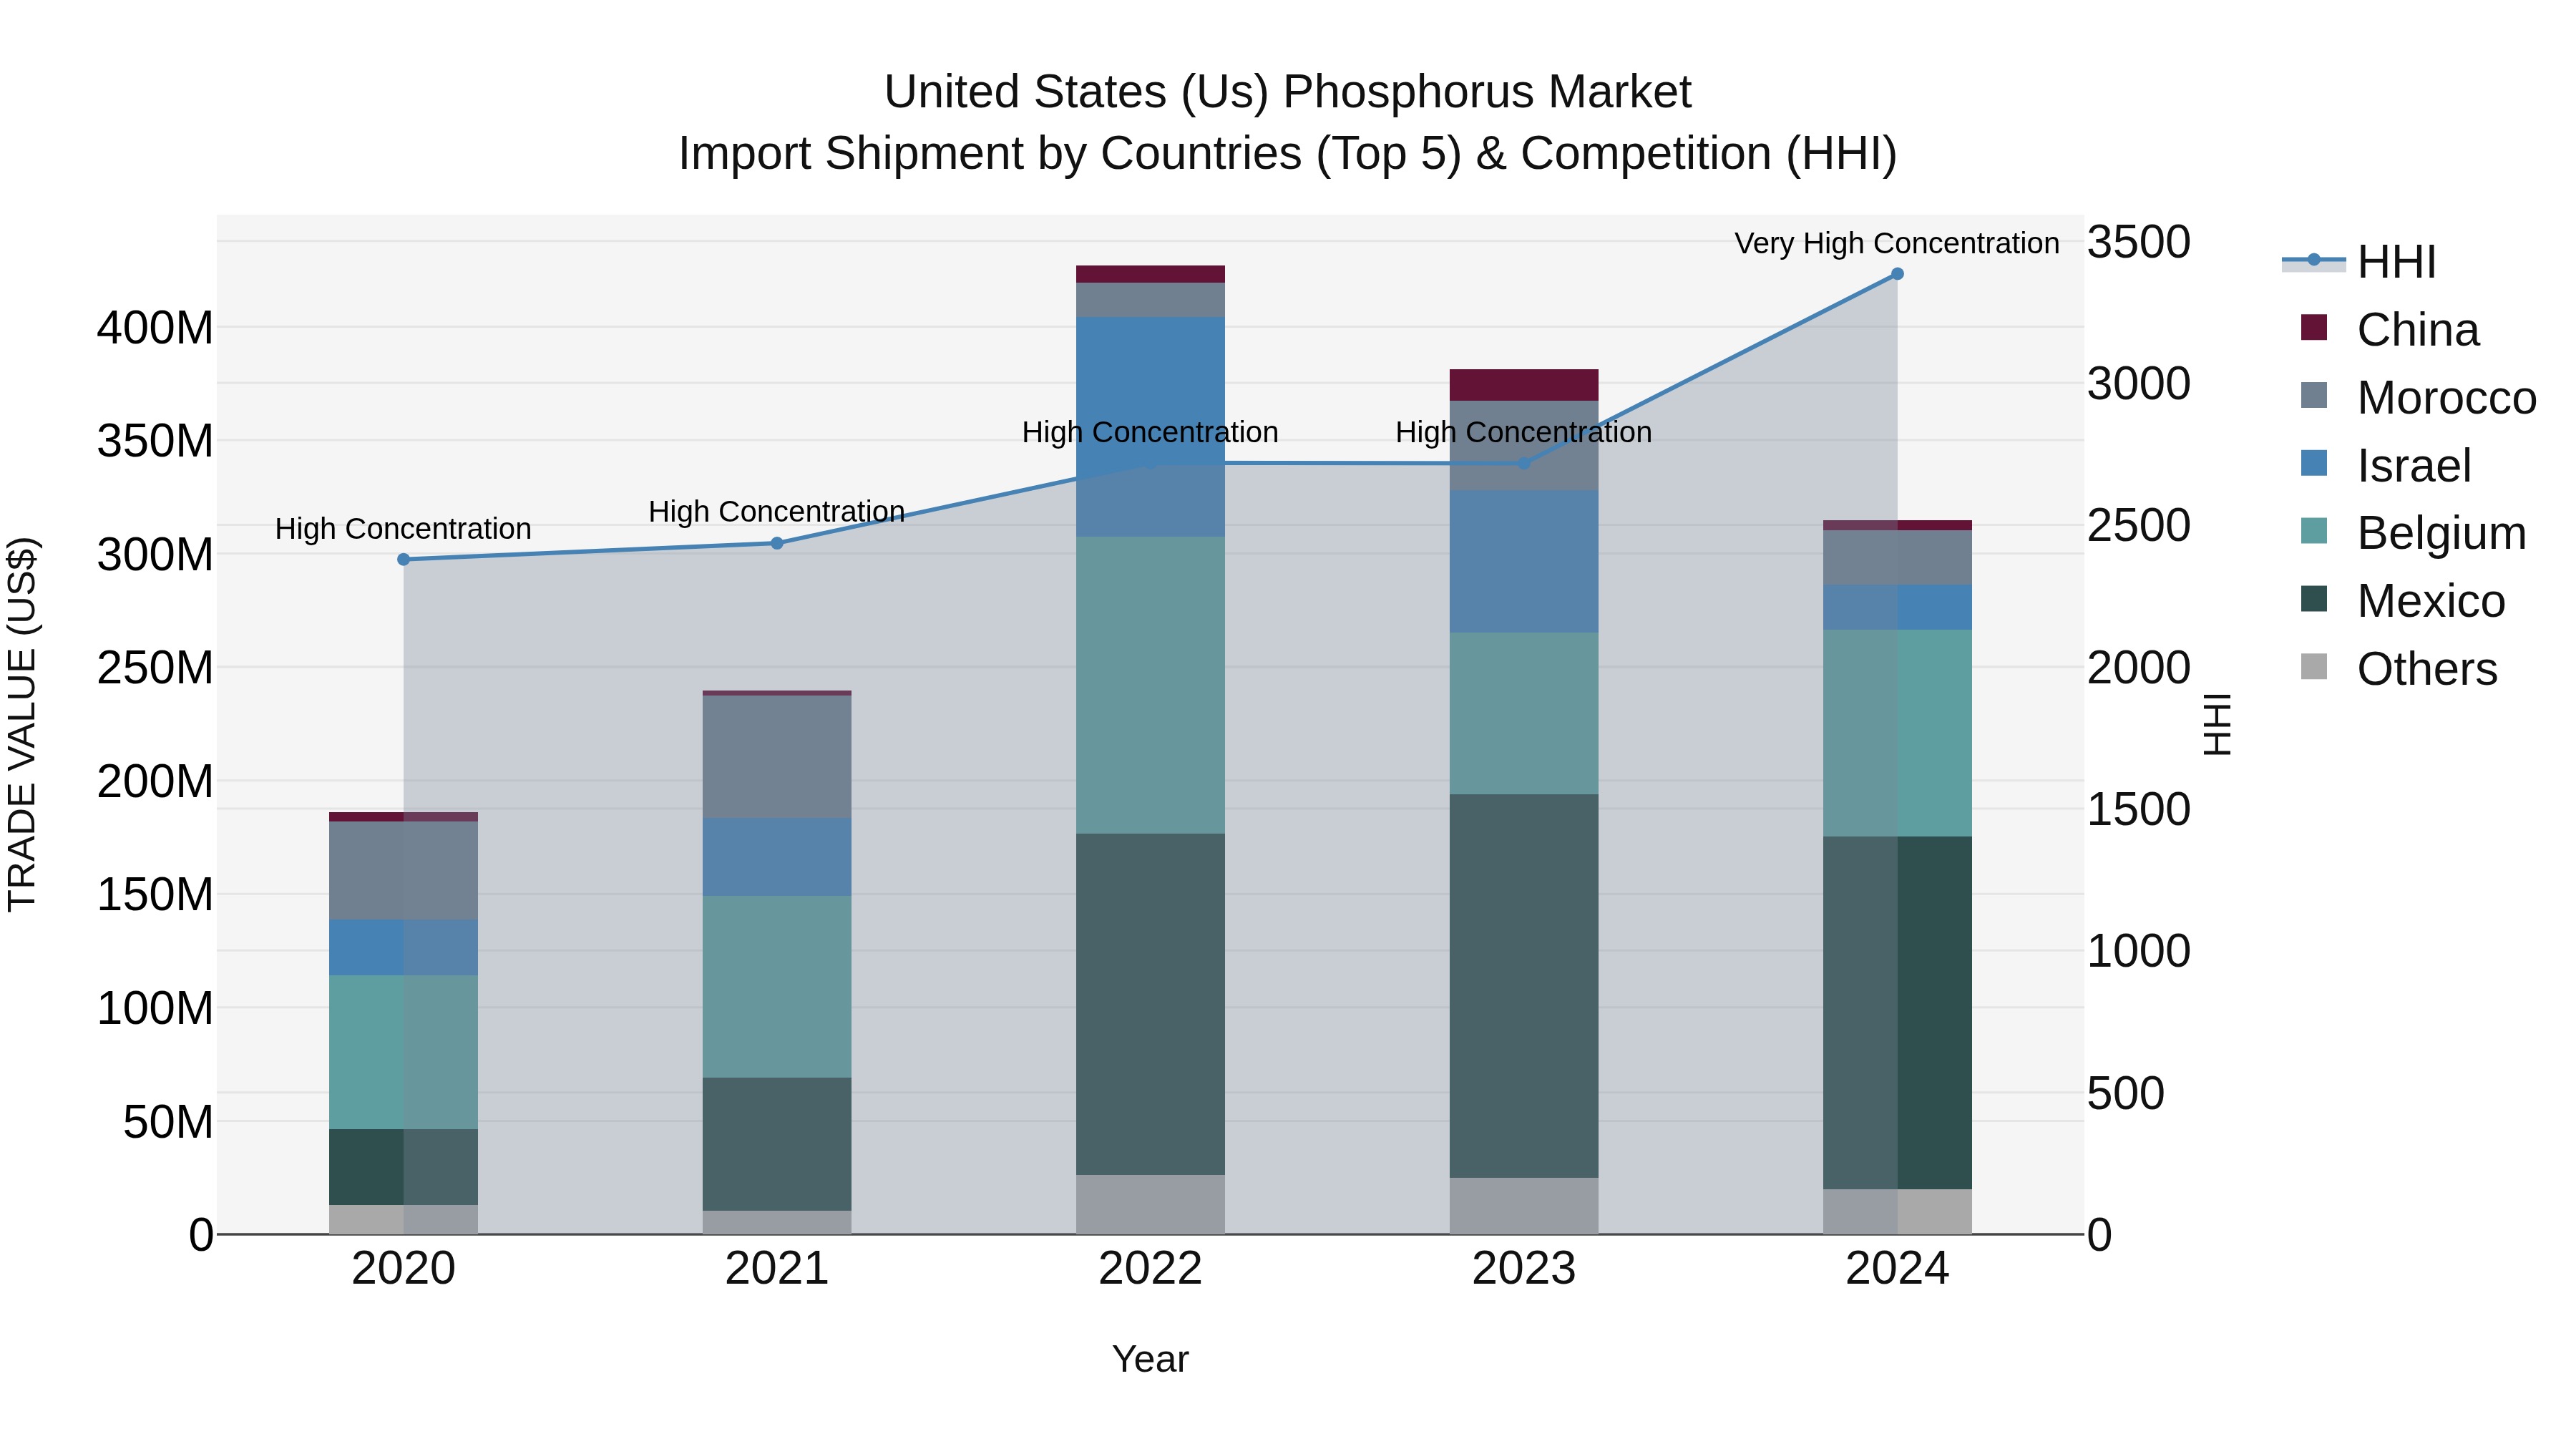
United States (US) PhosphorUS Market Top 5 Importing Countries and Market Competition (HHI) Analysis
The United States saw a significant increase in phosphorus import shipments in 2024, with top exporting countries including Mexico, Belgium, and Morocco. The market exhibited a very high concentration level, indicating a competitive landscape dominated by a few key players. Despite a notable CAGR of 14.04% from 2020 to 2024, the growth rate experienced a decline of -17.41% in 2024 compared to the previous year. This dynamic market trend suggests the need for strategic adjustments and proactive measures to navigate potential challenges and capitalize on emerging opportunities in the phosphorus import sector.
United States (US) Phosphorus Market Overview
The United States Phosphorus Market is a significant segment of the global fertilizer industry, driven primarily by agricultural demand. Phosphorus is an essential nutrient for plant growth, making it a crucial component in fertilizers used to enhance crop yields. The market is influenced by factors such as agricultural trends, government regulations, and technological advancements in fertilizer production. Major players in the US phosphorus market include companies like Mosaic Company, Nutrien Ltd., and PhosAgro. Sustainability concerns and environmental regulations are increasingly shaping the market dynamics, leading to a growing emphasis on eco-friendly phosphorus sources and efficient usage practices. Overall, the US phosphorus market is poised for steady growth, driven by the ongoing need to support the country`s agricultural sector and ensure food security.
United States (US) Phosphorus Market Trends
In the United States Phosphorus Market, a notable trend is the increasing demand for phosphorus-based fertilizers driven by the agriculture sector`s focus on improving crop yields. Additionally, there is a growing emphasis on sustainable agriculture practices, leading to the adoption of phosphorus sources that offer efficient nutrient utilization and minimize environmental impact. The market is also witnessing a shift towards specialty phosphorus products tailored for specific crops and soil conditions, as well as the development of innovative technologies for phosphorus extraction and production. Regulatory measures promoting nutrient management and conservation practices further influence market dynamics. Overall, the US Phosphorus Market is evolving towards more sustainable and efficient solutions to meet the demands of modern agriculture while addressing environmental concerns.
United States (US) Phosphorus Market Challenges
In the US Phosphorus Market, one of the key challenges is the increasing regulatory pressure related to environmental concerns. Phosphorus runoff from agricultural activities contributes to water pollution, leading to issues such as algal blooms in water bodies. This has resulted in stricter regulations on phosphorus usage in fertilizers and other agricultural products. Additionally, there is a growing demand for sustainable and environmentally friendly phosphorus sources, driving the need for innovation in phosphorus recycling and recovery technologies. Another challenge is the reliance on imports for phosphorus supply, as the US is heavily dependent on imported phosphate rock, making the market vulnerable to global supply chain disruptions and price fluctuations. Overall, navigating these regulatory, sustainability, and supply chain challenges is crucial for the US Phosphorus Market stakeholders.
United States (US) Phosphorus Market Investment Opportunities
The United States Phosphorus Market offers several investment opportunities due to its importance in agriculture, food production, and industrial applications. Investing in companies involved in phosphate mining, fertilizer production, or agricultural technology can be lucrative, as the demand for phosphorus continues to rise with increasing global population and food requirements. Additionally, there is potential for investment in sustainable phosphorus management technologies, such as recycling and recovery processes, as environmental concerns and regulations drive the need for more efficient use of this essential nutrient. Overall, the US Phosphorus Market presents diverse opportunities for investors looking to capitalize on the growing demand for phosphorus in various industries.
United States (US) Phosphorus Market Government Policy
The United States government regulates the phosphorus market primarily through environmental policies aimed at managing phosphorus pollution in water bodies. The Clean Water Act, the Comprehensive Environmental Response, Compensation, and Liability Act (CERCLA), and the Nutrient Management Strategy are key regulations that impact phosphorus use and disposal. These policies set limits on phosphorus discharges from industrial sources, promote best management practices in agriculture to minimize runoff, and encourage the development of technologies for phosphorus recovery and recycling. Additionally, the Environmental Protection Agency (EPA) monitors phosphorus levels in waterways and collaborates with state agencies to enforce compliance with regulatory standards, ensuring the sustainable management of phosphorus resources in the US market.
United States (US) Phosphorus Market Future Outlook
The future outlook for the United States Phosphorus Market appears promising, driven by increasing demand from the agriculture sector for fertilizers and animal feed, as well as the growing application of phosphorus in various industrial processes. Factors such as population growth, changing dietary preferences, and the need to improve crop yields are expected to sustain the demand for phosphorus in the coming years. Additionally, advancements in phosphorus recycling technologies and sustainable practices are likely to play a key role in ensuring the availability of phosphorus resources for the market. However, challenges related to environmental concerns, regulatory issues, and geopolitical factors could impact the market dynamics. Overall, the US Phosphorus Market is anticipated to witness steady growth with a focus on sustainability and innovation.
Key Highlights of the Report:
- United States (US) Phosphorus Market Outlook
- Market Size of United States (US) Phosphorus Market, 2021
- Forecast of United States (US) Phosphorus Market, 2031
- Historical Data and Forecast of United States (US) Phosphorus Revenues & Volume for the Period 2018 - 2031
- United States (US) Phosphorus Market Trend Evolution
- United States (US) Phosphorus Market Drivers and Challenges
- United States (US) Phosphorus Price Trends
- United States (US) Phosphorus Porter's Five Forces
- United States (US) Phosphorus Industry Life Cycle
- Historical Data and Forecast of United States (US) Phosphorus Market Revenues & Volume By Type for the Period 2018 - 2031
- Historical Data and Forecast of United States (US) Phosphorus Market Revenues & Volume By White phosphorus for the Period 2018 - 2031
- Historical Data and Forecast of United States (US) Phosphorus Market Revenues & Volume By Red phosphorus for the Period 2018 - 2031
- Historical Data and Forecast of United States (US) Phosphorus Market Revenues & Volume By Phosphorous chloride for the Period 2018 - 2031
- Historical Data and Forecast of United States (US) Phosphorus Market Revenues & Volume By Phosphoric acid for the Period 2018 - 2031
- Historical Data and Forecast of United States (US) Phosphorus Market Revenues & Volume By Industrial phosphates for the Period 2018 - 2031
- Historical Data and Forecast of United States (US) Phosphorus Market Revenues & Volume By Phosphorous penta-oxide for the Period 2018 - 2031
- Historical Data and Forecast of United States (US) Phosphorus Market Revenues & Volume By Application for the Period 2018 - 2031
- Historical Data and Forecast of United States (US) Phosphorus Market Revenues & Volume By Detergents for the Period 2018 - 2031
- Historical Data and Forecast of United States (US) Phosphorus Market Revenues & Volume By Water treatment for the Period 2018 - 2031
- Historical Data and Forecast of United States (US) Phosphorus Market Revenues & Volume By Flame retardants for the Period 2018 - 2031
- Historical Data and Forecast of United States (US) Phosphorus Market Revenues & Volume By Batteries for the Period 2018 - 2031
- Historical Data and Forecast of United States (US) Phosphorus Market Revenues & Volume By Chemical intermediates for the Period 2018 - 2031
- Historical Data and Forecast of United States (US) Phosphorus Market Revenues & Volume By Fertilizers for the Period 2018 - 2031
- United States (US) Phosphorus Import Export Trade Statistics
- Market Opportunity Assessment By Type
- Market Opportunity Assessment By Application
- United States (US) Phosphorus Top Companies Market Share
- United States (US) Phosphorus Competitive Benchmarking By Technical and Operational Parameters
- United States (US) Phosphorus Company Profiles
- United States (US) Phosphorus Key Strategic Recommendations
Frequently Asked Questions About the Market Study (FAQs):
6Wresearch actively monitors the United States (US) Phosphorus Market and publishes its comprehensive annual report, highlighting emerging trends, growth drivers, revenue analysis, and forecast outlook. Our insights help businesses to make data-backed strategic decisions with ongoing market dynamics. Our analysts track relevent industries related to the United States (US) Phosphorus Market, allowing our clients with actionable intelligence and reliable forecasts tailored to emerging regional needs.
Yes, we provide customisation as per your requirements. To learn more, feel free to contact us on sales@6wresearch.com
1 Executive Summary |
2 Introduction |
2.1 Key Highlights of the Report |
2.2 Report Description |
2.3 Market Scope & Segmentation |
2.4 Research Methodology |
2.5 Assumptions |
3 United States (US) Phosphorus Market Overview |
3.1 United States (US) Country Macro Economic Indicators |
3.2 United States (US) Phosphorus Market Revenues & Volume, 2021 & 2031F |
3.3 United States (US) Phosphorus Market - Industry Life Cycle |
3.4 United States (US) Phosphorus Market - Porter's Five Forces |
3.5 United States (US) Phosphorus Market Revenues & Volume Share, By Type, 2021 & 2031F |
3.6 United States (US) Phosphorus Market Revenues & Volume Share, By Application, 2021 & 2031F |
4 United States (US) Phosphorus Market Dynamics |
4.1 Impact Analysis |
4.2 Market Drivers |
4.2.1 Increasing demand for fertilizers in the agriculture sector, where phosphorus is a key component, is a major driver of the US phosphorus market. |
4.2.2 Growing population leading to higher food demand, which drives the need for increased agricultural productivity and, consequently, phosphorus usage. |
4.2.3 Technological advancements in phosphorus extraction and processing methods that improve efficiency and reduce costs. |
4.3 Market Restraints |
4.3.1 Environmental concerns related to phosphorus runoff and its impact on water quality, leading to regulations that restrict its usage. |
4.3.2 Fluctuating prices of phosphorus due to factors like supply chain disruptions, geopolitical tensions, and changing trade policies. |
5 United States (US) Phosphorus Market Trends |
6 United States (US) Phosphorus Market, By Types |
6.1 United States (US) Phosphorus Market, By Type |
6.1.1 Overview and Analysis |
6.1.2 United States (US) Phosphorus Market Revenues & Volume, By Type, 2021-2031F |
6.1.3 United States (US) Phosphorus Market Revenues & Volume, By White phosphorus, 2021-2031F |
6.1.4 United States (US) Phosphorus Market Revenues & Volume, By Red phosphorus, 2021-2031F |
6.1.5 United States (US) Phosphorus Market Revenues & Volume, By Phosphorous chloride, 2021-2031F |
6.1.6 United States (US) Phosphorus Market Revenues & Volume, By Phosphoric acid, 2021-2031F |
6.1.7 United States (US) Phosphorus Market Revenues & Volume, By Industrial phosphates, 2021-2031F |
6.1.8 United States (US) Phosphorus Market Revenues & Volume, By Phosphorous penta-oxide, 2021-2031F |
6.2 United States (US) Phosphorus Market, By Application |
6.2.1 Overview and Analysis |
6.2.2 United States (US) Phosphorus Market Revenues & Volume, By Detergents, 2021-2031F |
6.2.3 United States (US) Phosphorus Market Revenues & Volume, By Water treatment, 2021-2031F |
6.2.4 United States (US) Phosphorus Market Revenues & Volume, By Flame retardants, 2021-2031F |
6.2.5 United States (US) Phosphorus Market Revenues & Volume, By Batteries, 2021-2031F |
6.2.6 United States (US) Phosphorus Market Revenues & Volume, By Chemical intermediates, 2021-2031F |
6.2.7 United States (US) Phosphorus Market Revenues & Volume, By Fertilizers, 2021-2031F |
7 United States (US) Phosphorus Market Import-Export Trade Statistics |
7.1 United States (US) Phosphorus Market Export to Major Countries |
7.2 United States (US) Phosphorus Market Imports from Major Countries |
8 United States (US) Phosphorus Market Key Performance Indicators |
8.1 Average phosphorus application rates per acre in the US agricultural sector. |
8.2 Adoption rate of sustainable phosphorus management practices among farmers. |
8.3 Research and development investment in phosphorus recycling and recovery technologies. |
8.4 Percentage of phosphorus extracted from domestic sources compared to imported sources. |
9 United States (US) Phosphorus Market - Opportunity Assessment |
9.1 United States (US) Phosphorus Market Opportunity Assessment, By Type, 2021 & 2031F |
9.2 United States (US) Phosphorus Market Opportunity Assessment, By Application, 2021 & 2031F |
10 United States (US) Phosphorus Market - Competitive Landscape |
10.1 United States (US) Phosphorus Market Revenue Share, By Companies, 2021 |
10.2 United States (US) Phosphorus Market Competitive Benchmarking, By Operating and Technical Parameters |
11 Company Profiles |
12 Recommendations |
13 Disclaimer |
Global Go To Market Strategy - 2030
Export potential enables firms to identify high-growth global markets with greater confidence by combining advanced trade intelligence with a structured quantitative methodology. The framework analyzes emerging demand trends and country-level import patterns while integrating macroeconomic and trade datasets such as GDP and population forecasts, bilateral import–export flows, tariff structures, elasticity differentials between developed and developing economies, geographic distance, and import demand projections. Using weighted trade values from 2020–2024 as the base period to project country-to-country export potential for 2030, these inputs are operationalized through calculated drivers such as gravity model parameters, tariff impact factors, and projected GDP per-capita growth. Through an analysis of hidden potentials, demand hotspots, and market conditions that are most favorable to success, this method enables firms to focus on target countries, maximize returns, and global expansion with data, backed by accuracy.
By factoring in the projected importer demand gap that is currently unmet and could be potential opportunity, it identifies the potential for the Exporter (Country) among 190 countries, against the general trade analysis, which identifies the biggest importer or exporter.
To discover high-growth global markets and optimize your business strategy:
Click Here
Pricing
- Single User License$ 1,995
- Department License$ 2,400
- Site License$ 3,120
- Global License$ 3,795

Leadership Perspectives from Industry Events
Search
Thought Leadership and Analyst Meet


Our Clients
6WResearch In News
- India Air Conditioner Market Set for Strong Rebound in 2026 After Weather-Led Correction and GST-Driven Recovery: 6Wresearch
- ADAS in India: How Automatic Emergency Braking, Blind Spot Detection & Driver Monitoring are Transforming Road Safety
- Doha a strategic location for EV manufacturing hub: IPA Qatar
- Demand for luxury TVs surging in the GCC, says Samsung
- Empowering Growth: The Thriving Journey of Bangladesh’s Cable Industry
- Demand for luxury TVs surging in the GCC, says Samsung
Latest Reports
- Poland Fire Protection Systems Market (2026-2032)
- Cape Verde Portable Hand-Thrown Extinguisher Market (2026-2032)
- Canada Portable Hand-Thrown Extinguisher Market (2026-2032)
- Cameroon Portable Hand-Thrown Extinguisher Market (2026-2032)
- Burundi Portable Hand-Thrown Extinguisher Market (2026-2032)
- Burkina Faso Portable Hand-Thrown Extinguisher Market (2026-2032)
- Bulgaria Portable Hand-Thrown Extinguisher Market (2026-2032)
- Brunei Portable Hand-Thrown Extinguisher Market (2026-2032)
- Botswana Portable Hand-Thrown Extinguisher Market (2026-2032)
- Bosnia and Herzegovina Portable Hand-Thrown Extinguisher Market (2026-2032)
Industry Events and Analyst Meet

HIMTEX 2026

India Refining Summit 2026

India EV Show 2026

EV tech India Expo 2026

Auto Tech Asia 2026
Whitepaper
- Middle East & Africa Commercial Security Market Click here to view more.
- Middle East & Africa Fire Safety Systems & Equipment Market Click here to view more.
- GCC Drone Market Click here to view more.
- Middle East Lighting Fixture Market Click here to view more.
- GCC Physical & Perimeter Security Market Click here to view more.