United States (US) Stand-Up Paddleboard Market (2026-2032) | Segmentation, Competitive Landscape, Companies, Forecast, Value, Size & Revenue, Analysis, Trends, Growth, Industry, Outlook, Share
Market Forecast By Product (Solid SUP Boards, Inflatable SUP Boards), By Weight (56kg-68kg, 68kg-79kg, 79kg-91kg, 91kg-102kg, 22kg-56kg, 102kg-113kg, 113kg-125kg, above 125kg), By Length (9.1-12.0 feet, <9 feet, >12 feet), By Price (Medium, Low, Premium), By Material (PVC, EPOXY, Fiber Glass), By Distribution Channel (Online, Third Party Online, Franchised Sport Outlet, Retail Sports Outlet, Modern Trade Channel, Specialty Store, Independent Sports Outlets) And Competitive Landscape
| Product Code: ETC9977107 | Publication Date: Sep 2024 | Updated Date: Apr 2026 | Product Type: Market Research Report | |
| Publisher: 6Wresearch | Author: Summon Dutta | No. of Pages: 75 | No. of Figures: 35 | No. of Tables: 20 |
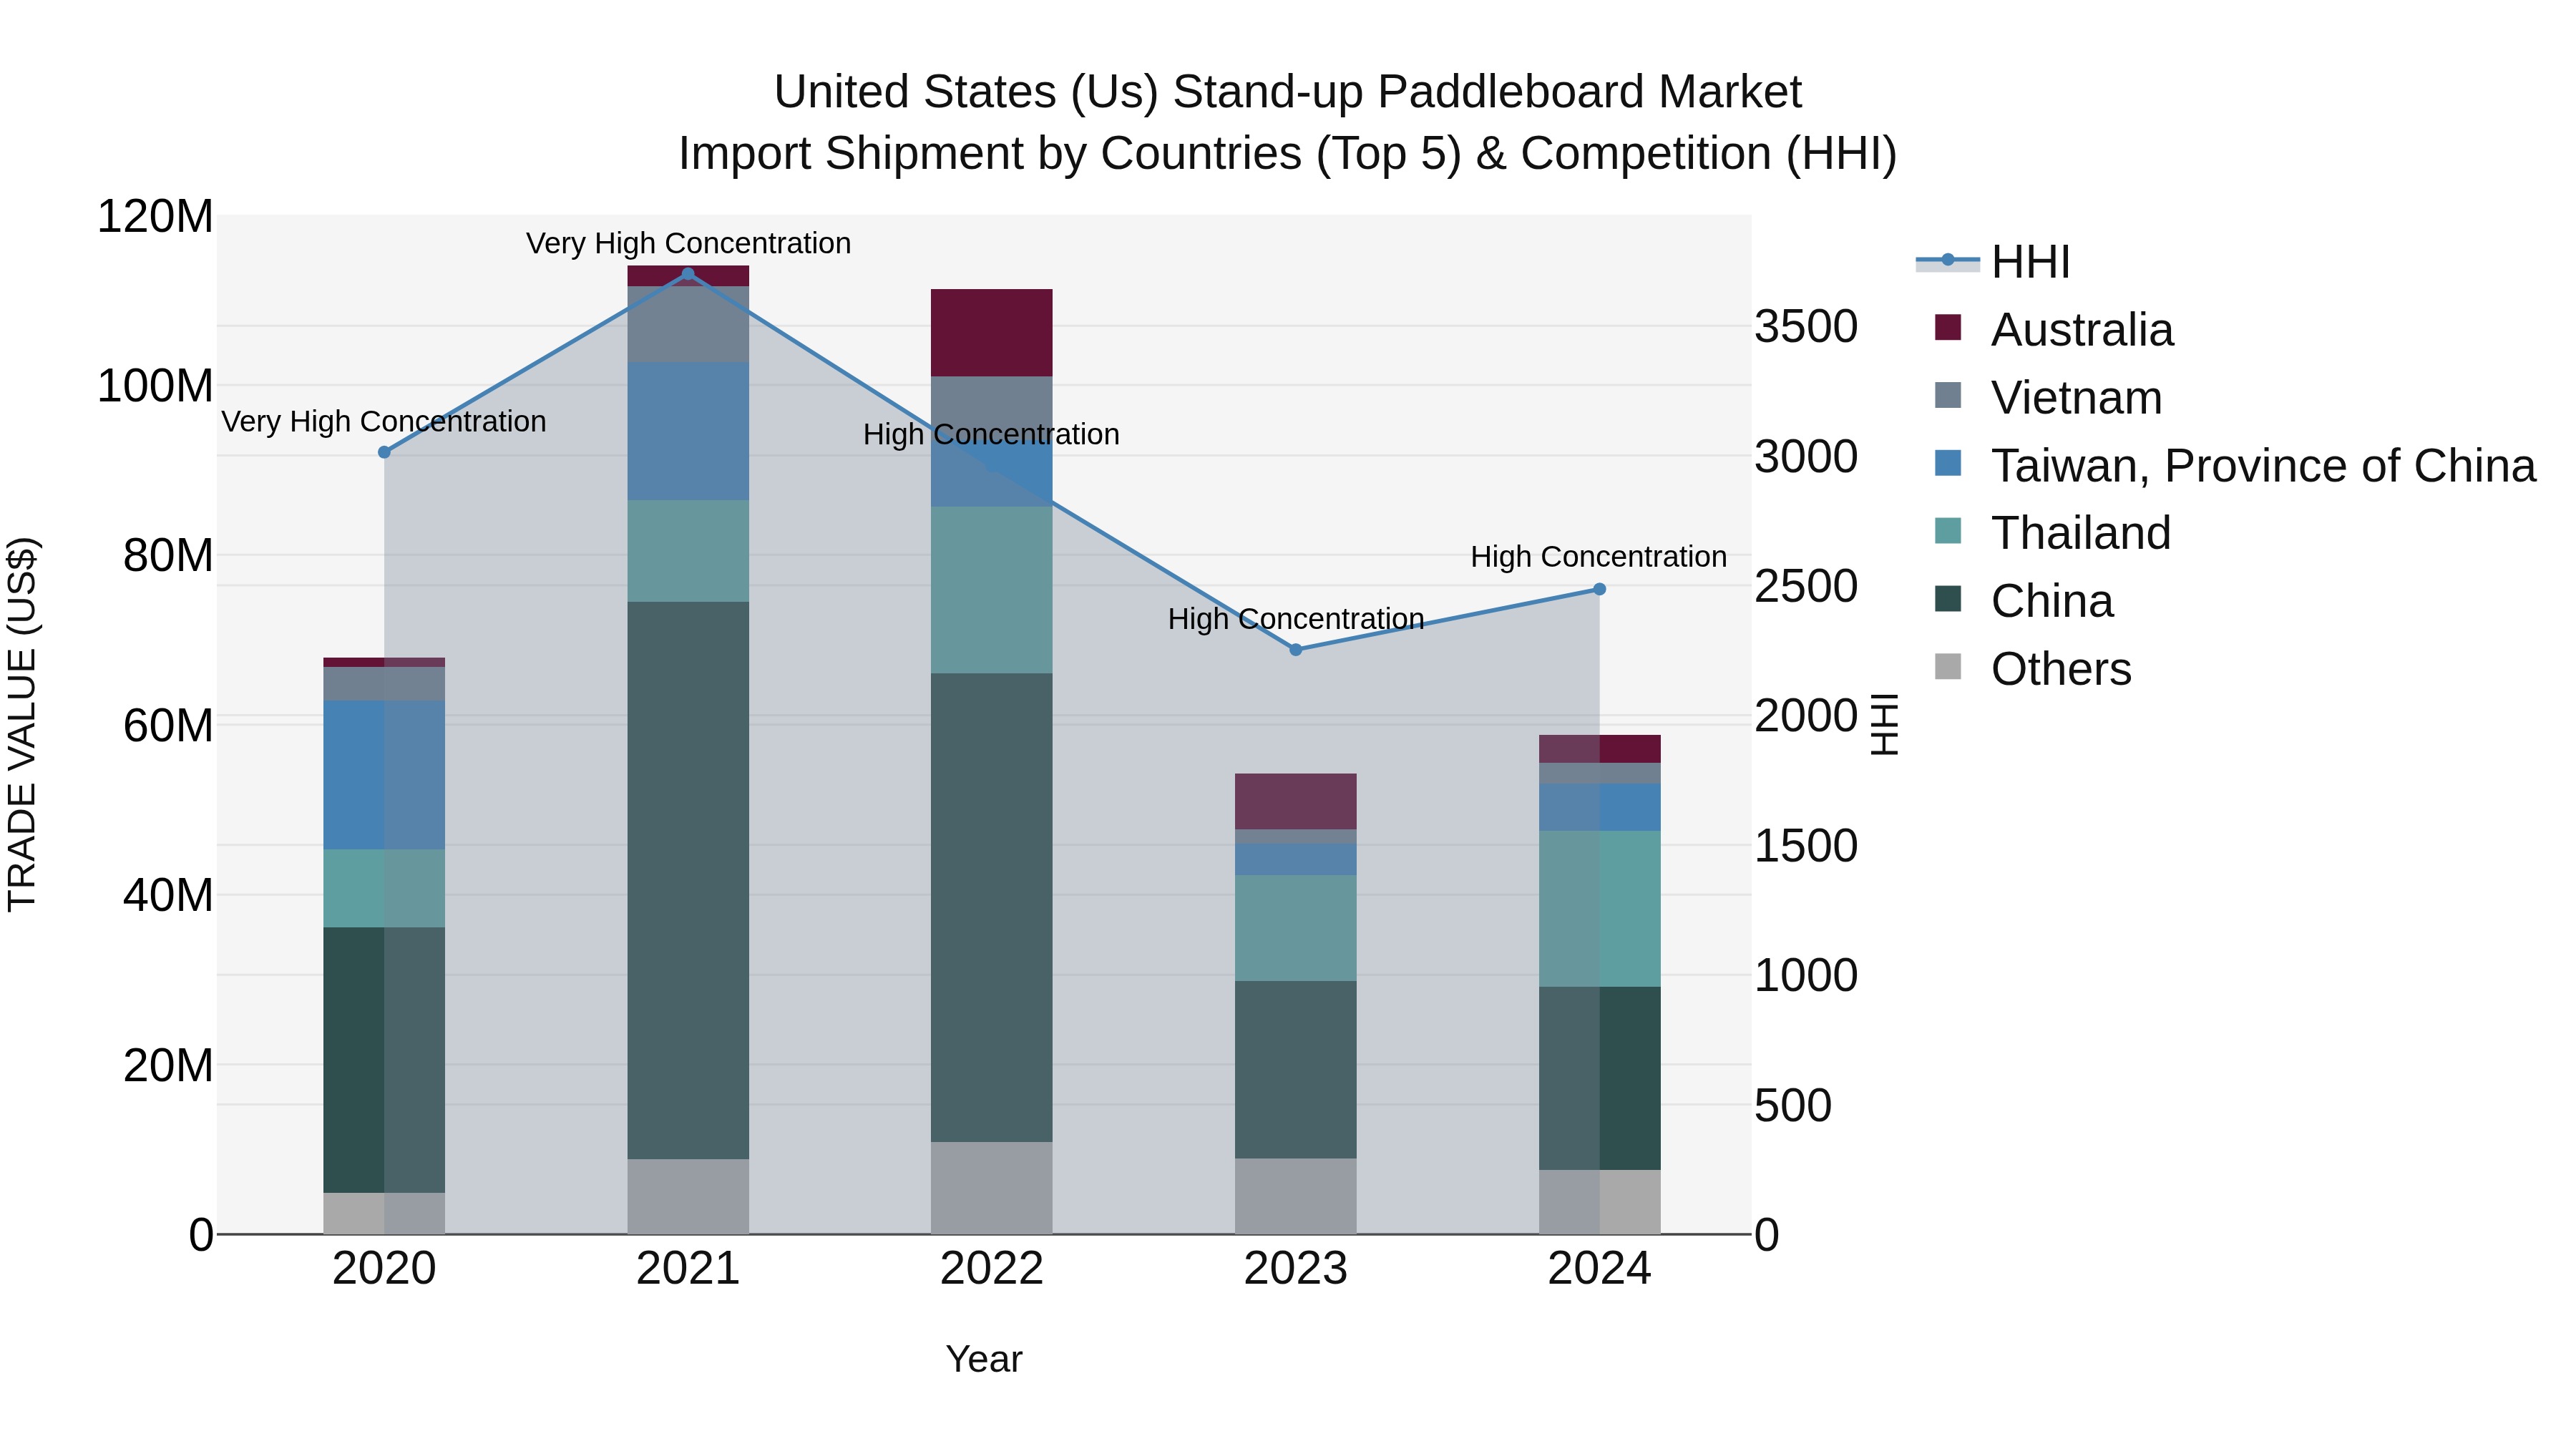
United States (US) Stand-up Paddleboard Market Top 5 Importing Countries and Market Competition (HHI) Analysis
In 2024, the United States continued to see significant imports of stand-up paddleboards, with China, Thailand, Taiwan, Australia, and Mexico being the top exporting countries. Despite a negative CAGR of -3.53% from 2020-2024, there was a promising growth rate of 8.4% from 2023-2024. The high concentration of import shipments, as indicated by the HHI, suggests that these top exporting countries dominate the market, reflecting the popularity and demand for stand-up paddleboards in the US.
Key Highlights of the Report:
- United States (US) Stand-Up Paddleboard Market Outlook
- Market Size of United States (US) Stand-Up Paddleboard Market, 2025
- Forecast of United States (US) Stand-Up Paddleboard Market, 2032
- Historical Data and Forecast of United States (US) Stand-Up Paddleboard Revenues & Volume for the Period 2022 - 2032
- United States (US) Stand-Up Paddleboard Market Trend Evolution
- United States (US) Stand-Up Paddleboard Market Drivers and Challenges
- United States (US) Stand-Up Paddleboard Price Trends
- United States (US) Stand-Up Paddleboard Porter's Five Forces
- United States (US) Stand-Up Paddleboard Industry Life Cycle
- Historical Data and Forecast of United States (US) Stand-Up Paddleboard Market Revenues & Volume By Product for the Period 2022 - 2032
- Historical Data and Forecast of United States (US) Stand-Up Paddleboard Market Revenues & Volume By Solid SUP Boards for the Period 2022 - 2032
- Historical Data and Forecast of United States (US) Stand-Up Paddleboard Market Revenues & Volume By Inflatable SUP Boards for the Period 2022 - 2032
- Historical Data and Forecast of United States (US) Stand-Up Paddleboard Market Revenues & Volume By Weight for the Period 2022 - 2032
- Historical Data and Forecast of United States (US) Stand-Up Paddleboard Market Revenues & Volume By 56kg-68kg for the Period 2022 - 2032
- Historical Data and Forecast of United States (US) Stand-Up Paddleboard Market Revenues & Volume By 68kg-79kg for the Period 2022 - 2032
- Historical Data and Forecast of United States (US) Stand-Up Paddleboard Market Revenues & Volume By 79kg-91kg for the Period 2022 - 2032
- Historical Data and Forecast of United States (US) Stand-Up Paddleboard Market Revenues & Volume By 91kg-102kg for the Period 2022 - 2032
- Historical Data and Forecast of United States (US) Stand-Up Paddleboard Market Revenues & Volume By 22kg-56kg for the Period 2022 - 2032
- Historical Data and Forecast of United States (US) Stand-Up Paddleboard Market Revenues & Volume By 102kg-113kg for the Period 2022 - 2032
- Historical Data and Forecast of United States (US) Stand-Up Paddleboard Market Revenues & Volume By 113kg-125kg for the Period 2022 - 2032
- Historical Data and Forecast of United States (US) Stand-Up Paddleboard Market Revenues & Volume By above 125kg for the Period 2022 - 2032
- Historical Data and Forecast of United States (US) Stand-Up Paddleboard Market Revenues & Volume By Length for the Period 2022 - 2032
- Historical Data and Forecast of United States (US) Stand-Up Paddleboard Market Revenues & Volume By 9.1-12.0 feet, for the Period 2022 - 2032
- Historical Data and Forecast of United States (US) Stand-Up Paddleboard Market Revenues & Volume By <9 feet for the Period 2022 - 2032
- Historical Data and Forecast of United States (US) Stand-Up Paddleboard Market Revenues & Volume By >12 feet for the Period 2022 - 2032
- Historical Data and Forecast of United States (US) Stand-Up Paddleboard Market Revenues & Volume By Price for the Period 2022 - 2032
- Historical Data and Forecast of United States (US) Stand-Up Paddleboard Market Revenues & Volume By Medium for the Period 2022 - 2032
- Historical Data and Forecast of United States (US) Stand-Up Paddleboard Market Revenues & Volume By Low for the Period 2022 - 2032
- Historical Data and Forecast of United States (US) Stand-Up Paddleboard Market Revenues & Volume By Premium for the Period 2022 - 2032
- Historical Data and Forecast of United States (US) Stand-Up Paddleboard Market Revenues & Volume By Material for the Period 2022 - 2032
- Historical Data and Forecast of United States (US) Stand-Up Paddleboard Market Revenues & Volume By PVC for the Period 2022 - 2032
- Historical Data and Forecast of United States (US) Stand-Up Paddleboard Market Revenues & Volume By EPOXY for the Period 2022 - 2032
- Historical Data and Forecast of United States (US) Stand-Up Paddleboard Market Revenues & Volume By Fiber Glass for the Period 2022 - 2032
- Historical Data and Forecast of United States (US) Stand-Up Paddleboard Market Revenues & Volume By Distribution Channel for the Period 2022 - 2032
- Historical Data and Forecast of United States (US) Stand-Up Paddleboard Market Revenues & Volume By Online for the Period 2022 - 2032
- Historical Data and Forecast of United States (US) Stand-Up Paddleboard Market Revenues & Volume By Third Party Online for the Period 2022 - 2032
- Historical Data and Forecast of United States (US) Stand-Up Paddleboard Market Revenues & Volume By Franchised Sport Outlet for the Period 2022 - 2032
- Historical Data and Forecast of United States (US) Stand-Up Paddleboard Market Revenues & Volume By Retail Sports Outlet for the Period 2022 - 2032
- Historical Data and Forecast of United States (US) Stand-Up Paddleboard Market Revenues & Volume By Modern Trade Channel for the Period 2022 - 2032
- Historical Data and Forecast of United States (US) Stand-Up Paddleboard Market Revenues & Volume By Specialty Store for the Period 2022 - 2032
- Historical Data and Forecast of United States (US) Stand-Up Paddleboard Market Revenues & Volume By Independent Sports Outlets for the Period 2022 - 2032
- United States (US) Stand-Up Paddleboard Import Export Trade Statistics
- Market Opportunity Assessment By Product
- Market Opportunity Assessment By Weight
- Market Opportunity Assessment By Length
- Market Opportunity Assessment By Price
- Market Opportunity Assessment By Material
- Market Opportunity Assessment By Distribution Channel
- United States (US) Stand-Up Paddleboard Top Companies Market Share
- United States (US) Stand-Up Paddleboard Competitive Benchmarking By Technical and Operational Parameters
- United States (US) Stand-Up Paddleboard Company Profiles
- United States (US) Stand-Up Paddleboard Key Strategic Recommendations
Frequently Asked Questions About the Market Study (FAQs):
6Wresearch actively monitors the United States (US) Stand-Up Paddleboard Market and publishes its comprehensive annual report, highlighting emerging trends, growth drivers, revenue analysis, and forecast outlook. Our insights help businesses to make data-backed strategic decisions with ongoing market dynamics. Our analysts track relevent industries related to the United States (US) Stand-Up Paddleboard Market, allowing our clients with actionable intelligence and reliable forecasts tailored to emerging regional needs.
Yes, we provide customisation as per your requirements. To learn more, feel free to contact us on sales@6wresearch.com
1 Executive Summary |
2 Introduction |
2.1 Key Highlights of the Report |
2.2 Report Description |
2.3 Market Scope & Segmentation |
2.4 Research Methodology |
2.5 Assumptions |
3 United States (US) Stand-Up Paddleboard Market Overview |
3.1 United States (US) Country Macro Economic Indicators |
3.2 United States (US) Stand-Up Paddleboard Market Revenues & Volume, 2022 & 2032F |
3.3 United States (US) Stand-Up Paddleboard Market - Industry Life Cycle |
3.4 United States (US) Stand-Up Paddleboard Market - Porter's Five Forces |
3.5 United States (US) Stand-Up Paddleboard Market Revenues & Volume Share, By Product, 2022 & 2032F |
3.6 United States (US) Stand-Up Paddleboard Market Revenues & Volume Share, By Weight, 2022 & 2032F |
3.7 United States (US) Stand-Up Paddleboard Market Revenues & Volume Share, By Length, 2022 & 2032F |
3.8 United States (US) Stand-Up Paddleboard Market Revenues & Volume Share, By Price, 2022 & 2032F |
3.9 United States (US) Stand-Up Paddleboard Market Revenues & Volume Share, By Material, 2022 & 2032F |
3.10 United States (US) Stand-Up Paddleboard Market Revenues & Volume Share, By Distribution Channel, 2022 & 2032F |
4 United States (US) Stand-Up Paddleboard Market Dynamics |
4.1 Impact Analysis |
4.2 Market Drivers |
4.2.1 Increasing popularity of water sports and outdoor recreational activities |
4.2.2 Growing awareness about health and fitness benefits of stand-up paddleboarding |
4.2.3 Rising interest in eco-friendly and sustainable water-based activities |
4.3 Market Restraints |
4.3.1 Seasonal demand due to weather conditions in certain regions |
4.3.2 High initial cost of stand-up paddleboarding equipment |
4.3.3 Limited accessibility to water bodies for paddleboarding activities |
5 United States (US) Stand-Up Paddleboard Market Trends |
6 United States (US) Stand-Up Paddleboard Market, By Types |
6.1 United States (US) Stand-Up Paddleboard Market, By Product |
6.1.1 Overview and Analysis |
6.1.2 United States (US) Stand-Up Paddleboard Market Revenues & Volume, By Product, 2022 - 2032F |
6.1.3 United States (US) Stand-Up Paddleboard Market Revenues & Volume, By Solid SUP Boards, 2022 - 2032F |
6.1.4 United States (US) Stand-Up Paddleboard Market Revenues & Volume, By Inflatable SUP Boards, 2022 - 2032F |
6.2 United States (US) Stand-Up Paddleboard Market, By Weight |
6.2.1 Overview and Analysis |
6.2.2 United States (US) Stand-Up Paddleboard Market Revenues & Volume, By 56kg-68kg, 2022 - 2032F |
6.2.3 United States (US) Stand-Up Paddleboard Market Revenues & Volume, By 68kg-79kg, 2022 - 2032F |
6.2.4 United States (US) Stand-Up Paddleboard Market Revenues & Volume, By 79kg-91kg, 2022 - 2032F |
6.2.5 United States (US) Stand-Up Paddleboard Market Revenues & Volume, By 91kg-102kg, 2022 - 2032F |
6.2.6 United States (US) Stand-Up Paddleboard Market Revenues & Volume, By 22kg-56kg, 2022 - 2032F |
6.2.7 United States (US) Stand-Up Paddleboard Market Revenues & Volume, By 102kg-113kg, 2022 - 2032F |
6.2.8 United States (US) Stand-Up Paddleboard Market Revenues & Volume, By above 125kg, 2022 - 2032F |
6.2.9 United States (US) Stand-Up Paddleboard Market Revenues & Volume, By above 125kg, 2022 - 2032F |
6.3 United States (US) Stand-Up Paddleboard Market, By Length |
6.3.1 Overview and Analysis |
6.3.2 United States (US) Stand-Up Paddleboard Market Revenues & Volume, By 9.1-12.0 feet,, 2022 - 2032F |
6.3.3 United States (US) Stand-Up Paddleboard Market Revenues & Volume, By <9 feet, 2022 - 2032F |
6.3.4 United States (US) Stand-Up Paddleboard Market Revenues & Volume, By >12 feet, 2022 - 2032F |
6.4 United States (US) Stand-Up Paddleboard Market, By Price |
6.4.1 Overview and Analysis |
6.4.2 United States (US) Stand-Up Paddleboard Market Revenues & Volume, By Medium, 2022 - 2032F |
6.4.3 United States (US) Stand-Up Paddleboard Market Revenues & Volume, By Low, 2022 - 2032F |
6.4.4 United States (US) Stand-Up Paddleboard Market Revenues & Volume, By Premium, 2022 - 2032F |
6.5 United States (US) Stand-Up Paddleboard Market, By Material |
6.5.1 Overview and Analysis |
6.5.2 United States (US) Stand-Up Paddleboard Market Revenues & Volume, By PVC, 2022 - 2032F |
6.5.3 United States (US) Stand-Up Paddleboard Market Revenues & Volume, By EPOXY, 2022 - 2032F |
6.5.4 United States (US) Stand-Up Paddleboard Market Revenues & Volume, By Fiber Glass, 2022 - 2032F |
6.6 United States (US) Stand-Up Paddleboard Market, By Distribution Channel |
6.6.1 Overview and Analysis |
6.6.2 United States (US) Stand-Up Paddleboard Market Revenues & Volume, By Online, 2022 - 2032F |
6.6.3 United States (US) Stand-Up Paddleboard Market Revenues & Volume, By Third Party Online, 2022 - 2032F |
6.6.4 United States (US) Stand-Up Paddleboard Market Revenues & Volume, By Franchised Sport Outlet, 2022 - 2032F |
6.6.5 United States (US) Stand-Up Paddleboard Market Revenues & Volume, By Retail Sports Outlet, 2022 - 2032F |
6.6.6 United States (US) Stand-Up Paddleboard Market Revenues & Volume, By Modern Trade Channel, 2022 - 2032F |
6.6.7 United States (US) Stand-Up Paddleboard Market Revenues & Volume, By Specialty Store, 2022 - 2032F |
7 United States (US) Stand-Up Paddleboard Market Import-Export Trade Statistics |
7.1 United States (US) Stand-Up Paddleboard Market Export to Major Countries |
7.2 United States (US) Stand-Up Paddleboard Market Imports from Major Countries |
8 United States (US) Stand-Up Paddleboard Market Key Performance Indicators |
8.1 Average number of stand-up paddleboard rentals per month |
8.2 Number of stand-up paddleboard events and competitions held annually |
8.3 Percentage increase in stand-up paddleboard instructors and certifications |
8.4 Average usage frequency of stand-up paddleboards per customer |
9 United States (US) Stand-Up Paddleboard Market - Opportunity Assessment |
9.1 United States (US) Stand-Up Paddleboard Market Opportunity Assessment, By Product, 2022 & 2032F |
9.2 United States (US) Stand-Up Paddleboard Market Opportunity Assessment, By Weight, 2022 & 2032F |
9.3 United States (US) Stand-Up Paddleboard Market Opportunity Assessment, By Length, 2022 & 2032F |
9.4 United States (US) Stand-Up Paddleboard Market Opportunity Assessment, By Price, 2022 & 2032F |
9.5 United States (US) Stand-Up Paddleboard Market Opportunity Assessment, By Material, 2022 & 2032F |
9.6 United States (US) Stand-Up Paddleboard Market Opportunity Assessment, By Distribution Channel, 2022 & 2032F |
10 United States (US) Stand-Up Paddleboard Market - Competitive Landscape |
10.1 United States (US) Stand-Up Paddleboard Market Revenue Share, By Companies, 2025 |
10.2 United States (US) Stand-Up Paddleboard Market Competitive Benchmarking, By Operating and Technical Parameters |
11 Company Profiles |
12 Recommendations |
13 Disclaimer |
Export potential assessment - trade Analytics for 2030
Export potential enables firms to identify high-growth global markets with greater confidence by combining advanced trade intelligence with a structured quantitative methodology. The framework analyzes emerging demand trends and country-level import patterns while integrating macroeconomic and trade datasets such as GDP and population forecasts, bilateral import–export flows, tariff structures, elasticity differentials between developed and developing economies, geographic distance, and import demand projections. Using weighted trade values from 2020–2024 as the base period to project country-to-country export potential for 2030, these inputs are operationalized through calculated drivers such as gravity model parameters, tariff impact factors, and projected GDP per-capita growth. Through an analysis of hidden potentials, demand hotspots, and market conditions that are most favorable to success, this method enables firms to focus on target countries, maximize returns, and global expansion with data, backed by accuracy.
By factoring in the projected importer demand gap that is currently unmet and could be potential opportunity, it identifies the potential for the Exporter (Country) among 190 countries, against the general trade analysis, which identifies the biggest importer or exporter.
To discover high-growth global markets and optimize your business strategy:
Click Here
Pricing
- Single User License$ 1,995
- Department License$ 2,400
- Site License$ 3,120
- Global License$ 3,795

Search
Thought Leadership and Analyst Meet


Our Clients
Latest Reports
- France Thermally Conductive Filler Dispersants Market (2026-2032) | Challenges, Restraints, Value, Share, Size, segmentation, Analysis, Trends, Investment Opportunities, Outlook, Pricing, Demand, Forecast, Revenue, Companies, Growth, Drivers, Strategy, Insights, Competition
- Egypt Thermally Conductive Filler Dispersants Market (2026-2032) | Competition, Forecast, Strategy, Value, Insights, Outlook, Investment Opportunities, Pricing, Demand, Share, segmentation, Drivers, Size, Companies, Restraints, Growth, Trends, Revenue, Challenges, Analysis
- Czech Republic Thermally Conductive Filler Dispersants Market (2026-2032) | Forecast, Pricing, Analysis, Drivers, Insights, Size, Demand, Growth, Challenges, segmentation, Competition, Outlook, Trends, Investment Opportunities, Companies, Strategy, Revenue, Share, Value, Restraints
- Colombia Thermally Conductive Filler Dispersants Market (2026-2032) | segmentation, Trends, Share, Drivers, Strategy, Companies, Demand, Insights, Size, Challenges, Value, Competition, Analysis, Growth, Revenue, Restraints, Forecast, Pricing, Outlook, Investment Opportunities
- China Thermally Conductive Filler Dispersants Market (2026-2032) | Restraints, Investment Opportunities, Pricing, Companies, Share, Size, Challenges, Trends, Outlook, Value, Analysis, Competition, Revenue, Drivers, Forecast, Demand, Insights, Growth, Strategy, segmentation
- Chile Thermally Conductive Filler Dispersants Market (2026-2032) | Investment Opportunities, Trends, Value, Restraints, Share, Companies, Forecast, segmentation, Pricing, Challenges, Demand, Size, Analysis, Drivers, Outlook, Growth, Competition, Strategy, Revenue, Insights
- Cambodia Thermally Conductive Filler Dispersants Market (2026-2032) | Analysis, Share, Outlook, Strategy, Pricing, Demand, Size, Growth, segmentation, Insights, Revenue, Forecast, Challenges, Competition, Companies, Investment Opportunities, Trends, Restraints, Value, Drivers
- Brazil Thermally Conductive Filler Dispersants Market (2026-2032) | Restraints, Forecast, Competition, Size, Revenue, Value, Investment Opportunities, Trends, Insights, Outlook, Growth, Analysis, Drivers, segmentation, Pricing, Challenges, Strategy, Share, Companies, Demand
- Bangladesh Thermally Conductive Filler Dispersants Market (2026-2032) | Restraints, Trends, Analysis, Competition, Insights, Forecast, Value, Investment Opportunities, Pricing, Share, Demand, Outlook, Revenue, segmentation, Companies, Drivers, Growth, Size, Challenges, Strategy
- Bahrain Thermally Conductive Filler Dispersants Market (2026-2032) | Trends, Outlook, Pricing, Demand, Value, Competition, Forecast, Growth, segmentation, Revenue, Companies, Analysis, Insights, Size, Drivers, Challenges, Strategy, Investment Opportunities, Share, Restraints
Industry Events and Analyst Meet

HIMTEX 2026

India Refining Summit 2026

India EV Show 2026

EV tech India Expo 2026

Auto Tech Asia 2026
Whitepaper
- Middle East & Africa Commercial Security Market Click here to view more.
- Middle East & Africa Fire Safety Systems & Equipment Market Click here to view more.
- GCC Drone Market Click here to view more.
- Middle East Lighting Fixture Market Click here to view more.
- GCC Physical & Perimeter Security Market Click here to view more.
6WResearch In News
- Doha a strategic location for EV manufacturing hub: IPA Qatar
- Demand for luxury TVs surging in the GCC, says Samsung
- Empowering Growth: The Thriving Journey of Bangladesh’s Cable Industry
- Demand for luxury TVs surging in the GCC, says Samsung
- Video call with a traditional healer? Once unthinkable, it’s now common in South Africa
- Intelligent Buildings To Smooth GCC’s Path To Net Zero