Uruguay Pine Bark Extract Market (2026-2032) | Revenue, Demand, Size, Strategic Insights, Strategy, Challenges, Segments, Analysis, Value, Trends, Competitive, Consumer Insights, Growth, Restraints, Supply, Forecast, Outlook, Pricing Analysis, Industry, Share, Competition, Segmentation, Opportunities, Investment Trends, Companies, Drivers
Market Forecast By Type (Capsules, Tablets, Liquid Extract, Powder, Others), By Key Component (Flavonoids, Antioxidants, Proanthocyanidins, Anti-Inflammatory, Others), By End User (Pharmaceutical, Dietary Supplements, Functional Foods, Sports Nutrition, Others), By Application (Nutraceuticals, Skin Health, Brain Function, Joint Health, Others) And Competitive Landscape
| Product Code: ETC13091958 | Publication Date: Apr 2025 | Updated Date: Feb 2026 | Product Type: Market Research Report | |
| Publisher: 6Wresearch | Author: Sachin Kumar Rai | No. of Pages: 65 | No. of Figures: 34 | No. of Tables: 19 |
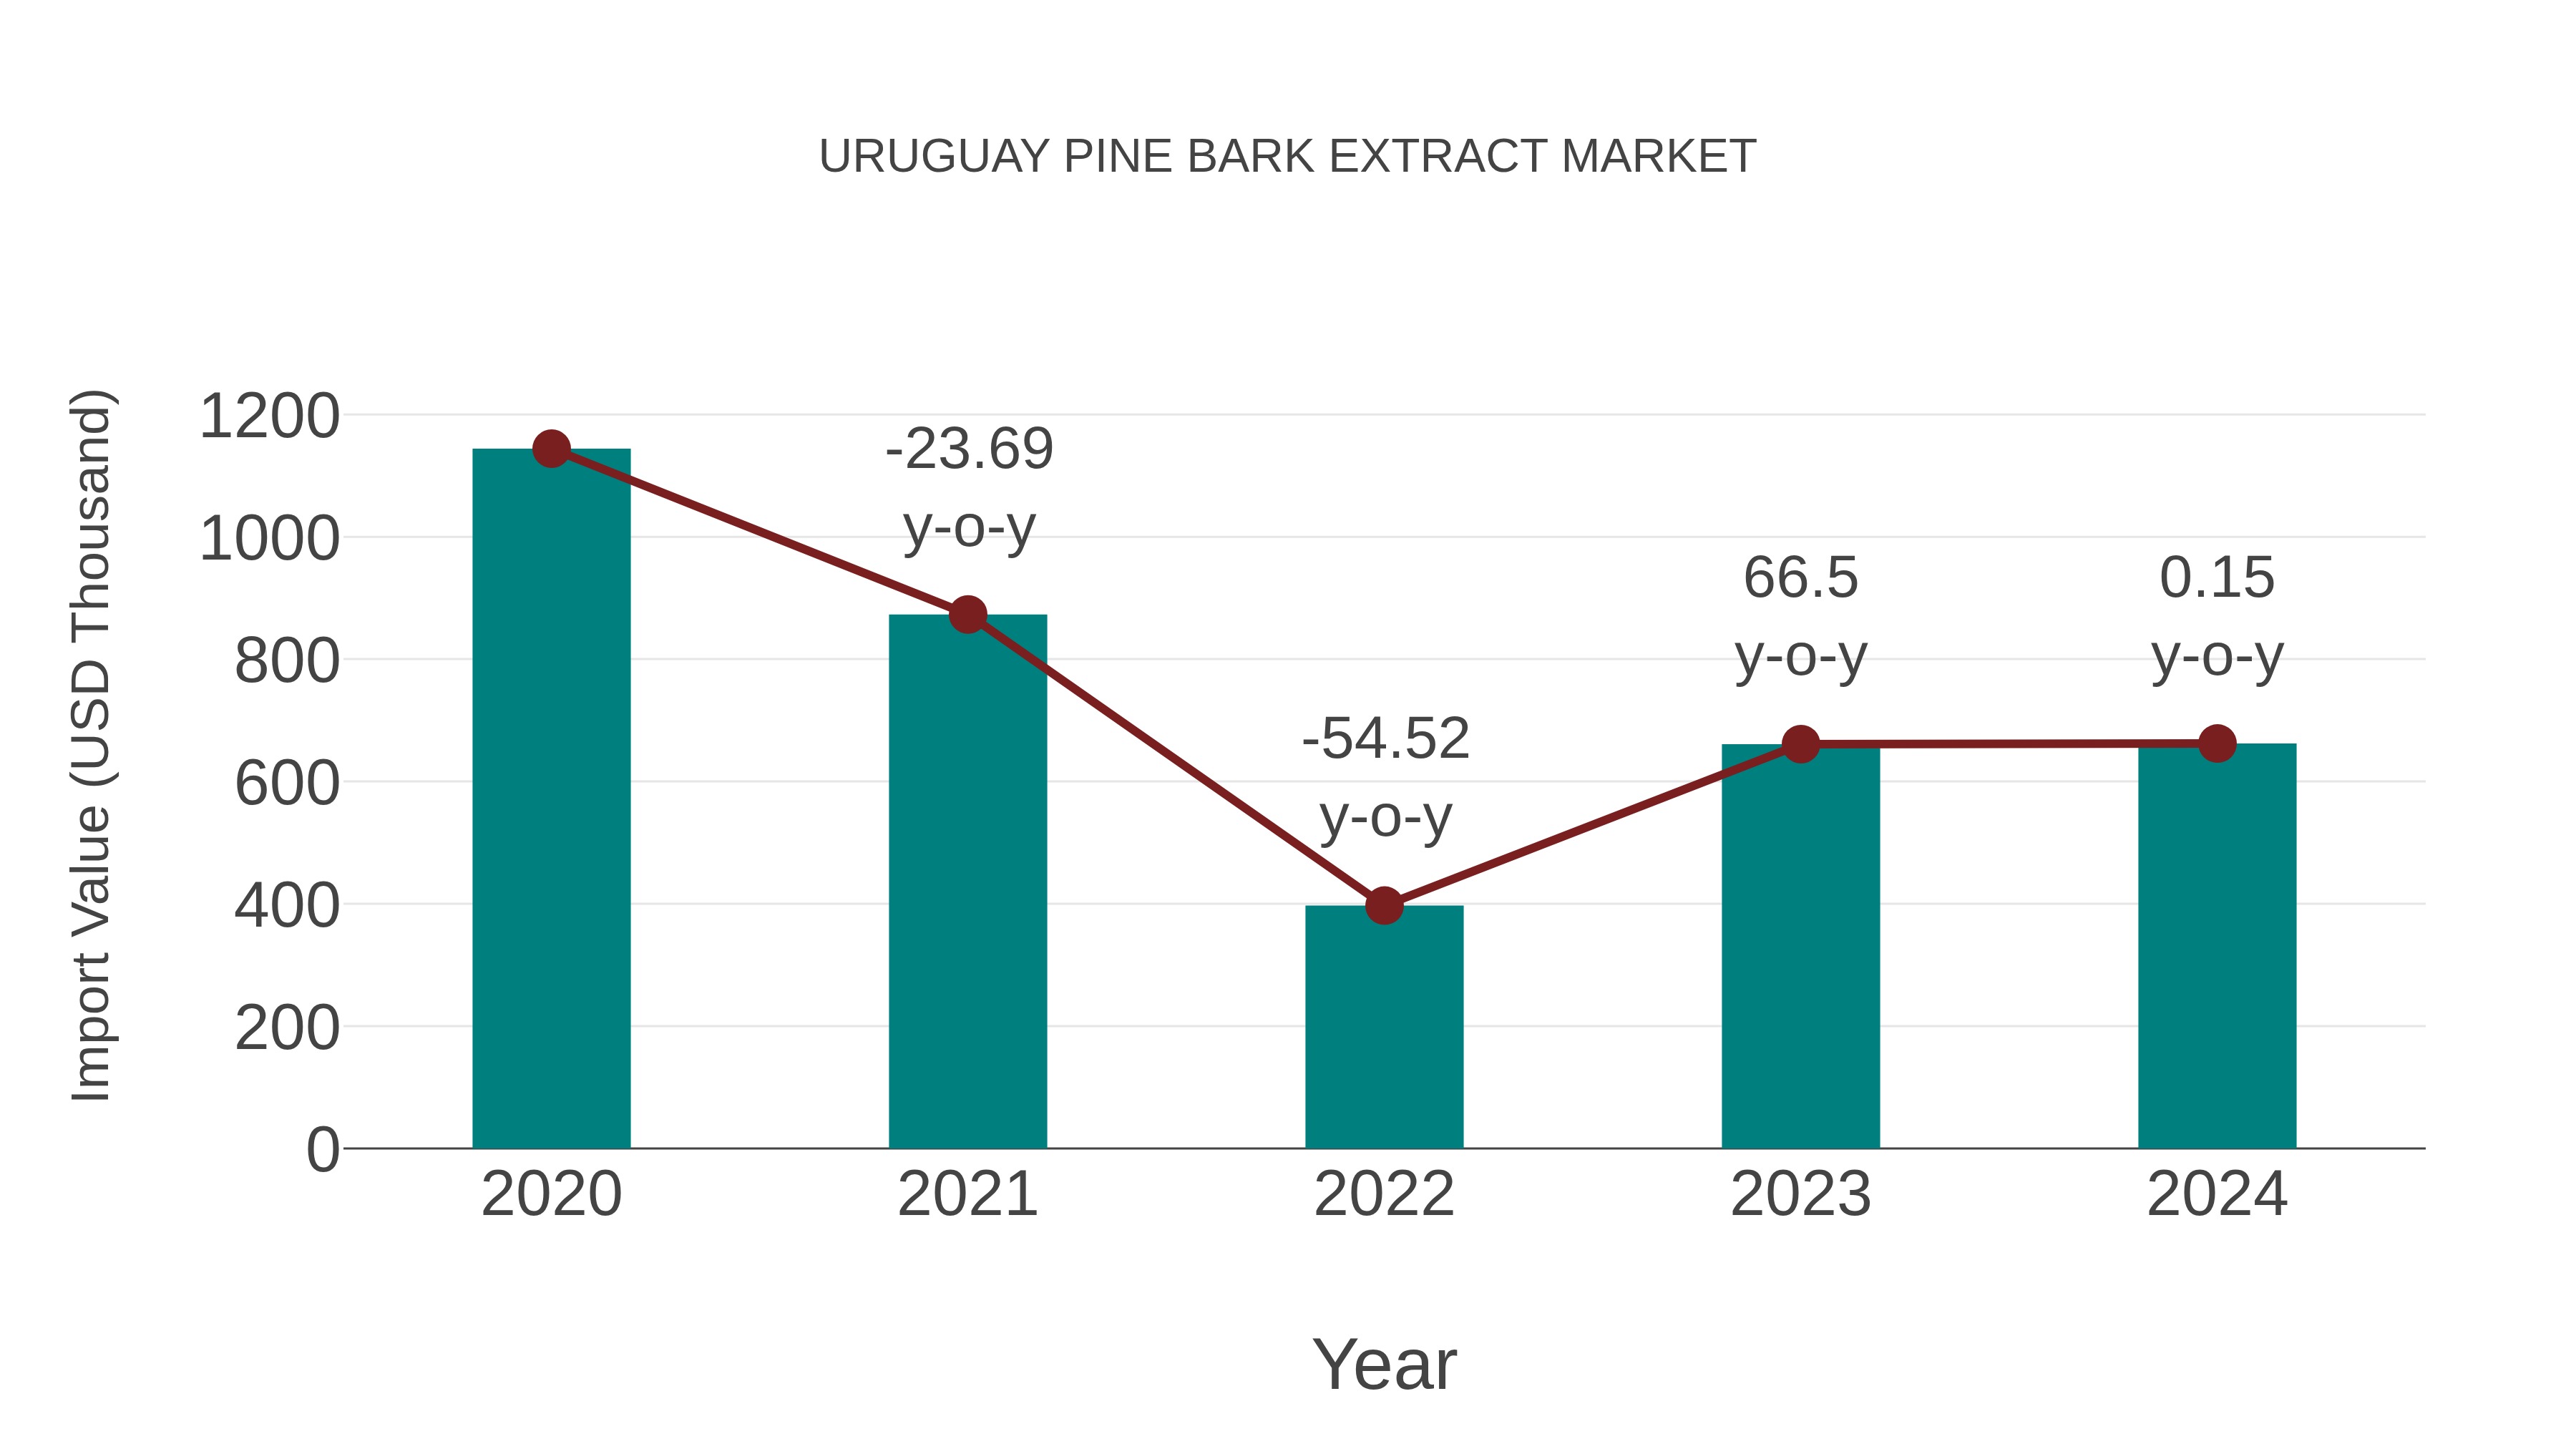
Uruguay Pine Bark Extract Market: Import Trend Analysis
Uruguay import trend for Uruguay pine bark extract experienced a slight decline from 2023 to 2024, with a growth rate of -0.15%. The compound annual growth rate (CAGR) for the period 2020-2024 stood at -12.81%. This trend could be attributed to shifts in market demand or changes in trade policies impacting the market stability during the period.
Key Highlights of the Report:
- Uruguay Pine Bark Extract Market Outlook
- Market Size of Uruguay Pine Bark Extract Market, 2025
- Forecast of Uruguay Pine Bark Extract Market, 2032
- Historical Data and Forecast of Uruguay Pine Bark Extract Revenues & Volume for the Period 2022-2032F
- Uruguay Pine Bark Extract Market Trend Evolution
- Uruguay Pine Bark Extract Market Drivers and Challenges
- Uruguay Pine Bark Extract Price Trends
- Uruguay Pine Bark Extract Porter's Five Forces
- Uruguay Pine Bark Extract Industry Life Cycle
- Historical Data and Forecast of Uruguay Pine Bark Extract Market Revenues & Volume By Type for the Period 2022-2032F
- Historical Data and Forecast of Uruguay Pine Bark Extract Market Revenues & Volume By Capsules for the Period 2022-2032F
- Historical Data and Forecast of Uruguay Pine Bark Extract Market Revenues & Volume By Tablets for the Period 2022-2032F
- Historical Data and Forecast of Uruguay Pine Bark Extract Market Revenues & Volume By Liquid Extract for the Period 2022-2032F
- Historical Data and Forecast of Uruguay Pine Bark Extract Market Revenues & Volume By Powder for the Period 2022-2032F
- Historical Data and Forecast of Uruguay Pine Bark Extract Market Revenues & Volume By Others for the Period 2022 - 2032F
- Historical Data and Forecast of Uruguay Pine Bark Extract Market Revenues & Volume By Key Component for the Period 2022-2032F
- Historical Data and Forecast of Uruguay Pine Bark Extract Market Revenues & Volume By Flavonoids for the Period 2022-2032F
- Historical Data and Forecast of Uruguay Pine Bark Extract Market Revenues & Volume By Antioxidants for the Period 2022-2032F
- Historical Data and Forecast of Uruguay Pine Bark Extract Market Revenues & Volume By Proanthocyanidins for the Period 2022-2032F
- Historical Data and Forecast of Uruguay Pine Bark Extract Market Revenues & Volume By Anti-Inflammatory for the Period 2022-2032F
- Historical Data and Forecast of Uruguay Pine Bark Extract Market Revenues & Volume By Others for the Period 2022 - 2032F
- Historical Data and Forecast of Uruguay Pine Bark Extract Market Revenues & Volume By End User for the Period 2022-2032F
- Historical Data and Forecast of Uruguay Pine Bark Extract Market Revenues & Volume By Pharmaceutical for the Period 2022-2032F
- Historical Data and Forecast of Uruguay Pine Bark Extract Market Revenues & Volume By Dietary Supplements for the Period 2022-2032F
- Historical Data and Forecast of Uruguay Pine Bark Extract Market Revenues & Volume By Functional Foods for the Period 2022-2032F
- Historical Data and Forecast of Uruguay Pine Bark Extract Market Revenues & Volume By Sports Nutrition for the Period 2022-2032F
- Historical Data and Forecast of Uruguay Pine Bark Extract Market Revenues & Volume By Others for the Period 2022 - 2032F
- Historical Data and Forecast of Uruguay Pine Bark Extract Market Revenues & Volume By Application for the Period 2022-2032F
- Historical Data and Forecast of Uruguay Pine Bark Extract Market Revenues & Volume By Nutraceuticals for the Period 2022-2032F
- Historical Data and Forecast of Uruguay Pine Bark Extract Market Revenues & Volume By Skin Health for the Period 2022-2032F
- Historical Data and Forecast of Uruguay Pine Bark Extract Market Revenues & Volume By Brain Function for the Period 2022-2032F
- Historical Data and Forecast of Uruguay Pine Bark Extract Market Revenues & Volume By Joint Health for the Period 2022-2032F
- Historical Data and Forecast of Uruguay Pine Bark Extract Market Revenues & Volume By Others for the Period 2022 - 2032F
- Uruguay Pine Bark Extract Import Export Trade Statistics
- Market Opportunity Assessment By Type
- Market Opportunity Assessment By Key Component
- Market Opportunity Assessment By End User
- Market Opportunity Assessment By Application
- Uruguay Pine Bark Extract Top Companies Market Share
- Uruguay Pine Bark Extract Competitive Benchmarking By Technical and Operational Parameters
- Uruguay Pine Bark Extract Company Profiles
- Uruguay Pine Bark Extract Key Strategic Recommendations
Frequently Asked Questions About the Market Study (FAQs):
6Wresearch actively monitors the Uruguay Pine Bark Extract Market and publishes its comprehensive annual report, highlighting emerging trends, growth drivers, revenue analysis, and forecast outlook. Our insights help businesses to make data-backed strategic decisions with ongoing market dynamics. Our analysts track relevent industries related to the Uruguay Pine Bark Extract Market, allowing our clients with actionable intelligence and reliable forecasts tailored to emerging regional needs.
Yes, we provide customisation as per your requirements. To learn more, feel free to contact us on sales@6wresearch.com
1 Executive Summary |
2 Introduction |
2.1 Key Highlights of the Report |
2.2 Report Description |
2.3 Market Scope & Segmentation |
2.4 Research Methodology |
2.5 Assumptions |
3 Uruguay Pine Bark Extract Market Overview |
3.1 Uruguay Country Macro Economic Indicators |
3.2 Uruguay Pine Bark Extract Market Revenues & Volume, 2022 & 2032F |
3.3 Uruguay Pine Bark Extract Market - Industry Life Cycle |
3.4 Uruguay Pine Bark Extract Market - Porter's Five Forces |
3.5 Uruguay Pine Bark Extract Market Revenues & Volume Share, By Type, 2022 & 2032F |
3.6 Uruguay Pine Bark Extract Market Revenues & Volume Share, By Key Component, 2022 & 2032F |
3.7 Uruguay Pine Bark Extract Market Revenues & Volume Share, By End User, 2022 & 2032F |
3.8 Uruguay Pine Bark Extract Market Revenues & Volume Share, By Application, 2022 & 2032F |
4 Uruguay Pine Bark Extract Market Dynamics |
4.1 Impact Analysis |
4.2 Market Drivers |
4.2.1 Increasing consumer awareness about the health benefits of Uruguay pine bark extract |
4.2.2 Growing demand for natural and organic ingredients in the pharmaceutical and nutraceutical industries |
4.2.3 Rising prevalence of chronic diseases driving the adoption of natural supplements |
4.3 Market Restraints |
4.3.1 Seasonal variations in the availability and supply of Uruguay pine bark extract |
4.3.2 Lack of standardized regulations and quality control measures in the production of pine bark extract |
4.3.3 Competition from substitute products in the market |
5 Uruguay Pine Bark Extract Market Trends |
6 Uruguay Pine Bark Extract Market, By Types |
6.1 Uruguay Pine Bark Extract Market, By Type |
6.1.1 Overview and Analysis |
6.1.2 Uruguay Pine Bark Extract Market Revenues & Volume, By Type, 2022 - 2032F |
6.1.3 Uruguay Pine Bark Extract Market Revenues & Volume, By Capsules, 2022 - 2032F |
6.1.4 Uruguay Pine Bark Extract Market Revenues & Volume, By Tablets, 2022 - 2032F |
6.1.5 Uruguay Pine Bark Extract Market Revenues & Volume, By Liquid Extract, 2022 - 2032F |
6.1.6 Uruguay Pine Bark Extract Market Revenues & Volume, By Powder, 2022 - 2032F |
6.1.7 Uruguay Pine Bark Extract Market Revenues & Volume, By Others, 2022 - 2032F |
6.2 Uruguay Pine Bark Extract Market, By Key Component |
6.2.1 Overview and Analysis |
6.2.2 Uruguay Pine Bark Extract Market Revenues & Volume, By Flavonoids, 2022 - 2032F |
6.2.3 Uruguay Pine Bark Extract Market Revenues & Volume, By Antioxidants, 2022 - 2032F |
6.2.4 Uruguay Pine Bark Extract Market Revenues & Volume, By Proanthocyanidins, 2022 - 2032F |
6.2.5 Uruguay Pine Bark Extract Market Revenues & Volume, By Anti-Inflammatory, 2022 - 2032F |
6.2.6 Uruguay Pine Bark Extract Market Revenues & Volume, By Others, 2022 - 2032F |
6.3 Uruguay Pine Bark Extract Market, By End User |
6.3.1 Overview and Analysis |
6.3.2 Uruguay Pine Bark Extract Market Revenues & Volume, By Pharmaceutical, 2022 - 2032F |
6.3.3 Uruguay Pine Bark Extract Market Revenues & Volume, By Dietary Supplements, 2022 - 2032F |
6.3.4 Uruguay Pine Bark Extract Market Revenues & Volume, By Functional Foods, 2022 - 2032F |
6.3.5 Uruguay Pine Bark Extract Market Revenues & Volume, By Sports Nutrition, 2022 - 2032F |
6.3.6 Uruguay Pine Bark Extract Market Revenues & Volume, By Others, 2022 - 2032F |
6.4 Uruguay Pine Bark Extract Market, By Application |
6.4.1 Overview and Analysis |
6.4.2 Uruguay Pine Bark Extract Market Revenues & Volume, By Nutraceuticals, 2022 - 2032F |
6.4.3 Uruguay Pine Bark Extract Market Revenues & Volume, By Skin Health, 2022 - 2032F |
6.4.4 Uruguay Pine Bark Extract Market Revenues & Volume, By Brain Function, 2022 - 2032F |
6.4.5 Uruguay Pine Bark Extract Market Revenues & Volume, By Joint Health, 2022 - 2032F |
6.4.6 Uruguay Pine Bark Extract Market Revenues & Volume, By Others, 2022 - 2032F |
7 Uruguay Pine Bark Extract Market Import-Export Trade Statistics |
7.1 Uruguay Pine Bark Extract Market Export to Major Countries |
7.2 Uruguay Pine Bark Extract Market Imports from Major Countries |
8 Uruguay Pine Bark Extract Market Key Performance Indicators |
8.1 Research and development investment in improving the extraction process and purity of Uruguay pine bark extract |
8.2 Number of clinical trials and studies showcasing the effectiveness of pine bark extract in treating various health conditions |
8.3 Adoption rate of Uruguay pine bark extract in new product formulations in the pharmaceutical and nutraceutical industries |
9 Uruguay Pine Bark Extract Market - Opportunity Assessment |
9.1 Uruguay Pine Bark Extract Market Opportunity Assessment, By Type, 2022 & 2032F |
9.2 Uruguay Pine Bark Extract Market Opportunity Assessment, By Key Component, 2022 & 2032F |
9.3 Uruguay Pine Bark Extract Market Opportunity Assessment, By End User, 2022 & 2032F |
9.4 Uruguay Pine Bark Extract Market Opportunity Assessment, By Application, 2022 & 2032F |
10 Uruguay Pine Bark Extract Market - Competitive Landscape |
10.1 Uruguay Pine Bark Extract Market Revenue Share, By Companies, 2025 |
10.2 Uruguay Pine Bark Extract Market Competitive Benchmarking, By Operating and Technical Parameters |
11 Company Profiles |
12 Recommendations |
13 Disclaimer |
Export potential assessment - trade Analytics for 2030
Export potential enables firms to identify high-growth global markets with greater confidence by combining advanced trade intelligence with a structured quantitative methodology. The framework analyzes emerging demand trends and country-level import patterns while integrating macroeconomic and trade datasets such as GDP and population forecasts, bilateral import–export flows, tariff structures, elasticity differentials between developed and developing economies, geographic distance, and import demand projections. Using weighted trade values from 2020–2024 as the base period to project country-to-country export potential for 2030, these inputs are operationalized through calculated drivers such as gravity model parameters, tariff impact factors, and projected GDP per-capita growth. Through an analysis of hidden potentials, demand hotspots, and market conditions that are most favorable to success, this method enables firms to focus on target countries, maximize returns, and global expansion with data, backed by accuracy.
By factoring in the projected importer demand gap that is currently unmet and could be potential opportunity, it identifies the potential for the Exporter (Country) among 190 countries, against the general trade analysis, which identifies the biggest importer or exporter.
To discover high-growth global markets and optimize your business strategy:
Click Here
Pricing
- Single User License$ 1,995
- Department License$ 2,400
- Site License$ 3,120
- Global License$ 3,795

Search
Thought Leadership and Analyst Meet


Our Clients
Latest Reports
- France Thermally Conductive Filler Dispersants Market (2026-2032) | Challenges, Restraints, Value, Share, Size, segmentation, Analysis, Trends, Investment Opportunities, Outlook, Pricing, Demand, Forecast, Revenue, Companies, Growth, Drivers, Strategy, Insights, Competition
- Egypt Thermally Conductive Filler Dispersants Market (2026-2032) | Competition, Forecast, Strategy, Value, Insights, Outlook, Investment Opportunities, Pricing, Demand, Share, segmentation, Drivers, Size, Companies, Restraints, Growth, Trends, Revenue, Challenges, Analysis
- Czech Republic Thermally Conductive Filler Dispersants Market (2026-2032) | Forecast, Pricing, Analysis, Drivers, Insights, Size, Demand, Growth, Challenges, segmentation, Competition, Outlook, Trends, Investment Opportunities, Companies, Strategy, Revenue, Share, Value, Restraints
- Colombia Thermally Conductive Filler Dispersants Market (2026-2032) | segmentation, Trends, Share, Drivers, Strategy, Companies, Demand, Insights, Size, Challenges, Value, Competition, Analysis, Growth, Revenue, Restraints, Forecast, Pricing, Outlook, Investment Opportunities
- China Thermally Conductive Filler Dispersants Market (2026-2032) | Restraints, Investment Opportunities, Pricing, Companies, Share, Size, Challenges, Trends, Outlook, Value, Analysis, Competition, Revenue, Drivers, Forecast, Demand, Insights, Growth, Strategy, segmentation
- Chile Thermally Conductive Filler Dispersants Market (2026-2032) | Investment Opportunities, Trends, Value, Restraints, Share, Companies, Forecast, segmentation, Pricing, Challenges, Demand, Size, Analysis, Drivers, Outlook, Growth, Competition, Strategy, Revenue, Insights
- Cambodia Thermally Conductive Filler Dispersants Market (2026-2032) | Analysis, Share, Outlook, Strategy, Pricing, Demand, Size, Growth, segmentation, Insights, Revenue, Forecast, Challenges, Competition, Companies, Investment Opportunities, Trends, Restraints, Value, Drivers
- Brazil Thermally Conductive Filler Dispersants Market (2026-2032) | Restraints, Forecast, Competition, Size, Revenue, Value, Investment Opportunities, Trends, Insights, Outlook, Growth, Analysis, Drivers, segmentation, Pricing, Challenges, Strategy, Share, Companies, Demand
- Bangladesh Thermally Conductive Filler Dispersants Market (2026-2032) | Restraints, Trends, Analysis, Competition, Insights, Forecast, Value, Investment Opportunities, Pricing, Share, Demand, Outlook, Revenue, segmentation, Companies, Drivers, Growth, Size, Challenges, Strategy
- Bahrain Thermally Conductive Filler Dispersants Market (2026-2032) | Trends, Outlook, Pricing, Demand, Value, Competition, Forecast, Growth, segmentation, Revenue, Companies, Analysis, Insights, Size, Drivers, Challenges, Strategy, Investment Opportunities, Share, Restraints
Industry Events and Analyst Meet

HIMTEX 2026

India Refining Summit 2026

India EV Show 2026

EV tech India Expo 2026

Auto Tech Asia 2026
Whitepaper
- Middle East & Africa Commercial Security Market Click here to view more.
- Middle East & Africa Fire Safety Systems & Equipment Market Click here to view more.
- GCC Drone Market Click here to view more.
- Middle East Lighting Fixture Market Click here to view more.
- GCC Physical & Perimeter Security Market Click here to view more.
6WResearch In News
- Doha a strategic location for EV manufacturing hub: IPA Qatar
- Demand for luxury TVs surging in the GCC, says Samsung
- Empowering Growth: The Thriving Journey of Bangladesh’s Cable Industry
- Demand for luxury TVs surging in the GCC, says Samsung
- Video call with a traditional healer? Once unthinkable, it’s now common in South Africa
- Intelligent Buildings To Smooth GCC’s Path To Net Zero