Vietnam Mobile Asset Management (MAM) Market (2026-2032) Outlook | Value, Forecast, Companies, Analysis, Trends, Revenue, Industry, Share, Size & Growth
Market Forecast By Components (Solutions, Services), By Asset Types (Fixed Assets, Mobile Assets), By Organization Size (SMEs, Large Enterprises), By Vertical (Building Automation, Manufacturing, Healthcare, Retail, Energy & Utilities, Transportation & Logistics, Metal & Mining, Others), By Deployment Modes (On-premises, Cloud) And Competitive Landscape
| Product Code: ETC067849 | Publication Date: Aug 2023 | Updated Date: Jun 2026 | Product Type: Report | |
| Publisher: 6Wresearch | Author: Ravi Bhandari | No. of Pages: 70 | No. of Figures: 35 | No. of Tables: 5 |
Vietnam Mobile Asset Management (MAM) Market Size, Share & Growth Rate
The Vietnam Mobile Asset Management (MAM) Market was estimated at USD 437 Million in 2025 and is projected to reach USD 622 Million by 2032, growing at a CAGR of 5.2% from 2026 to 2032. This trajectory is fueled by the widespread adoption of mobile devices across various sectors, particularly in business operations where efficient asset management is crucial. As enterprises recognize the importance of optimizing asset utilization and securing sensitive data, the demand for comprehensive MAM solutions continues to surge.
Vietnam Mobile Asset Management (MAM) Market Year-wise Growth Rate and Key Drivers
This graph highlights how the Vietnam Mobile Asset Management (MAM) Market has steadily grown over the years, supported by major growth factors.
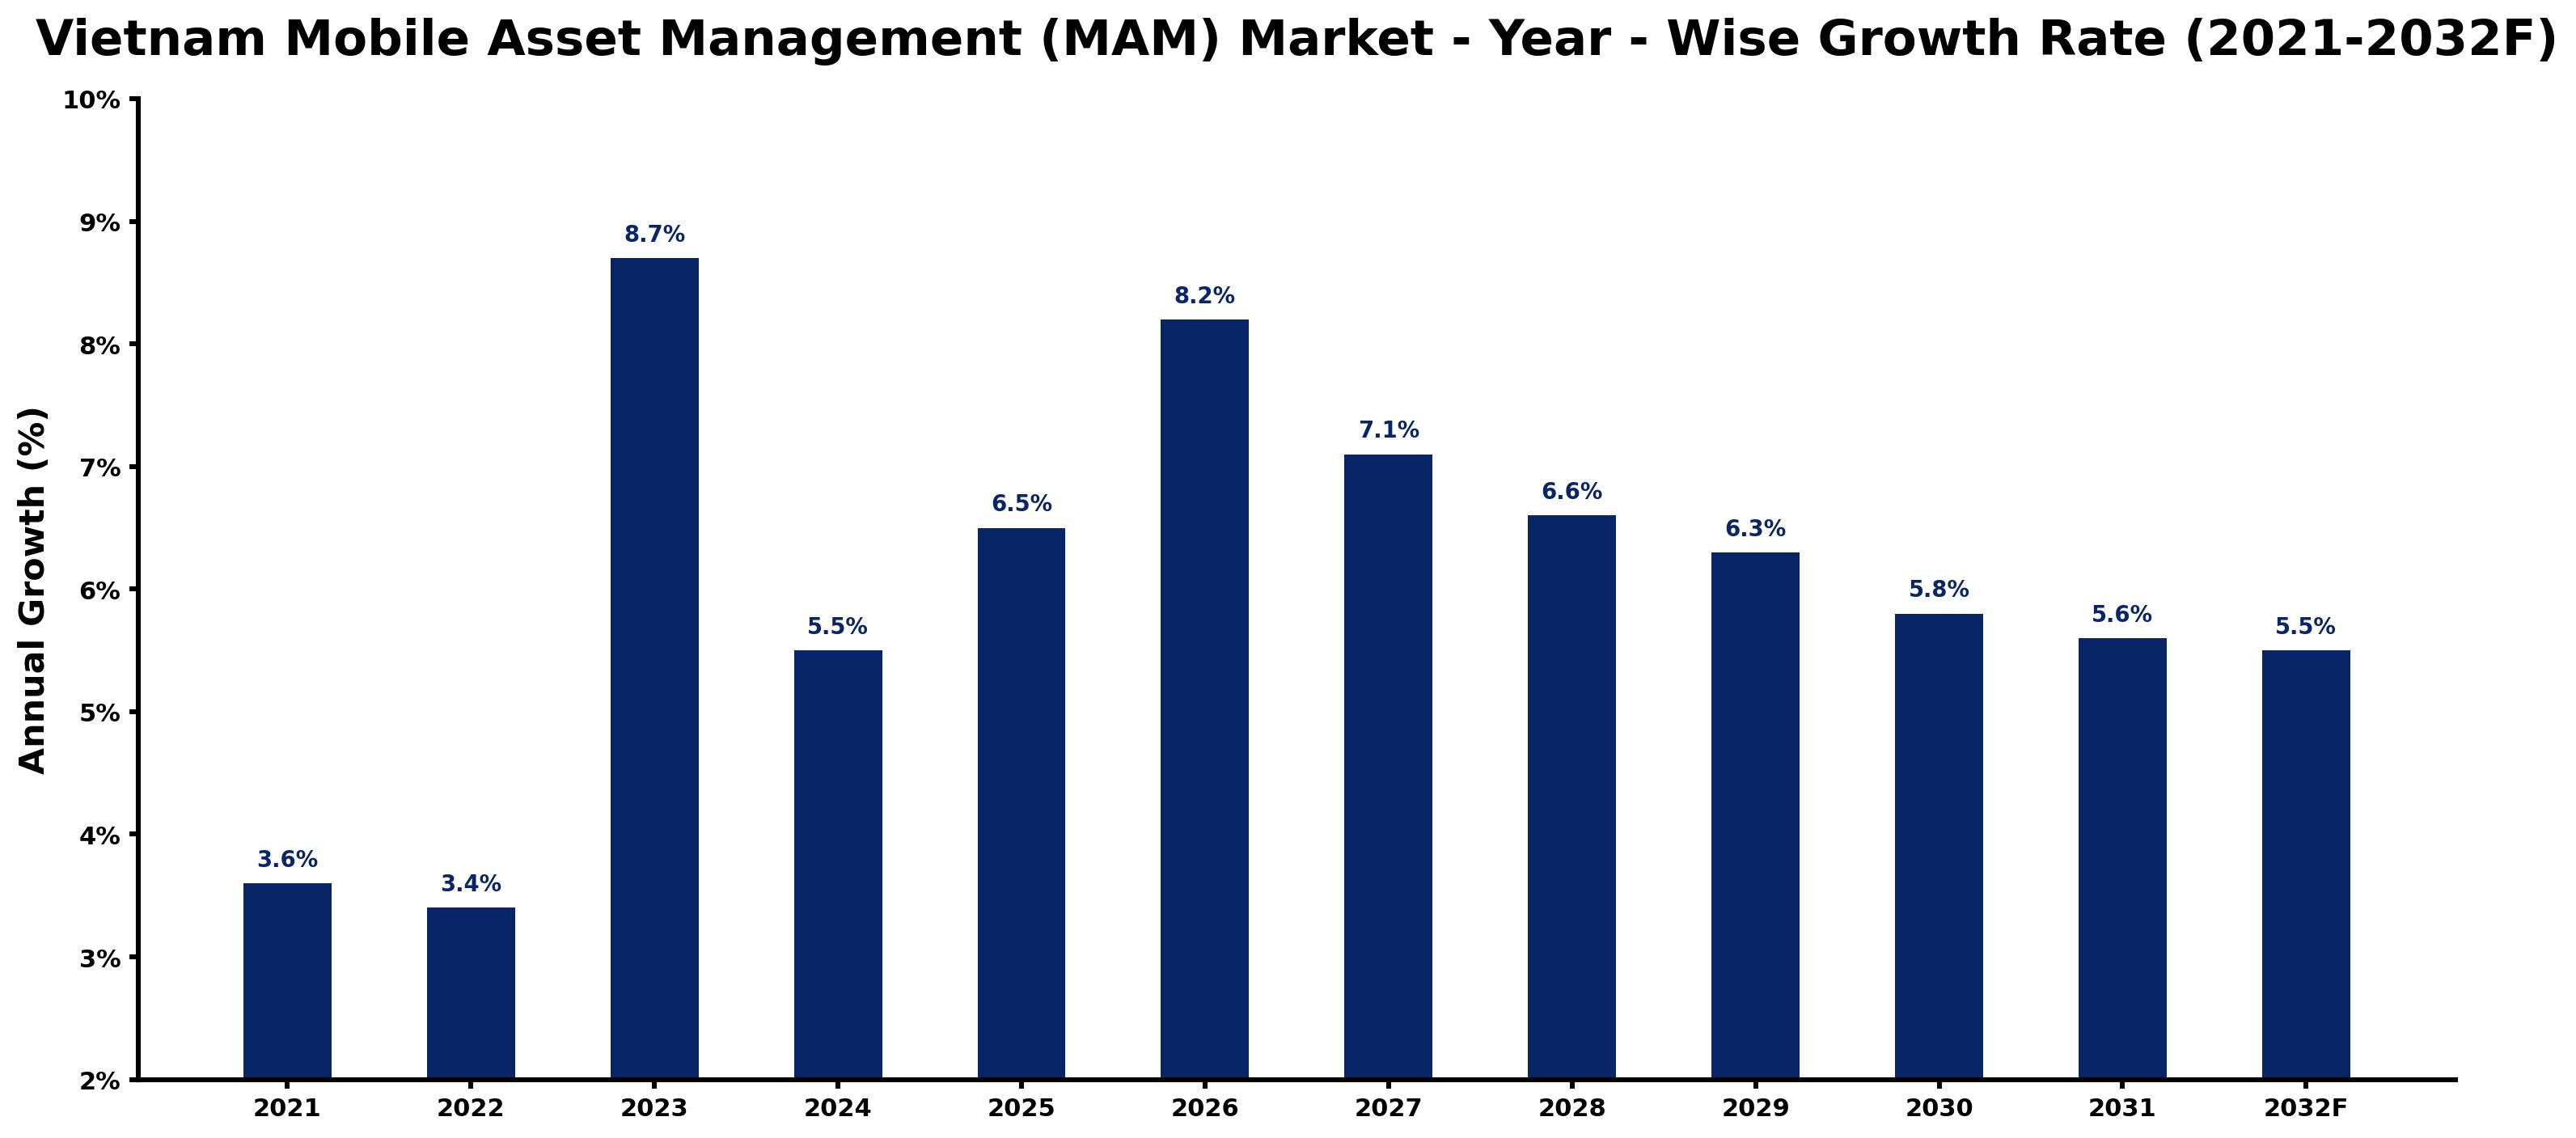
The table below presents the year‑wise growth rates along with the key drivers influencing the market
| Year | Growth Rate | Major Drivers |
| 2021 | 3.6% | Growing renewable energy integration projects |
| 2022 | 3.4% | Increasing industrial automation investments |
| 2023 | 8.7% | Expansion of commercial construction activities |
| 2024 | 5.5% | Expansion of commercial construction activities |
| 2025 | 6.5% | Increasing industrial infrastructure investments |
| 2026 | 8.2% | Increasing industrial infrastructure investments |
| 2027 | 7.1% | Expansion of transportation and logistics networks |
| 2028 | 6.6% | Growing urbanization and commercial development |
| 2029 | 6.3% | Expansion of transportation and logistics networks |
| 2030 | 5.8% | Expansion of manufacturing activities |
| 2031 | 5.6% | Increasing smart city development projects |
| 2032 | 5.5% | Growing renewable energy integration projects |
Note - Market size estimations and growth projections presented in this report are based on 6Wresearch’s advanced forecasting approach, validated with industry datasets as of June 2026.
Vietnam Mobile Asset Management (MAM) Market Synopsis
In Vietnam, the need for robust mobile asset management solutions is underscored by the rapid increase in mobile device usage within enterprises. Businesses are keenly aware that efficient tracking and management of assets like smartphones, tablets, and laptops can significantly enhance operational efficiency and minimize losses. The growing trend of remote work further amplifies this demand, as organizations seek to maintain control over their assets regardless of location.
Additionally, local IT service providers are stepping up to meet the evolving needs of various industries, tailoring MAM solutions to fit specific operational requirements. This localized approach has spurred competition, driving innovation and leading to the emergence of new functionalities within the MAM landscape in Vietnam.
Vietnam Mobile Asset Management (MAM) Market Key Takeaways
- The MAM market is driven by the proliferation of mobile devices in business settings.
- Increased remote work and mobility trends have escalated the need for effective asset management.
- Data security remains a critical concern, prompting the development of more secure MAM solutions.
- Local IT service providers are increasingly active, contributing to a competitive market landscape.
- The COVID-19 pandemic has accelerated the adoption of mobile asset management technologies.
Evaluation of Restraints in Vietnam Mobile Asset Management (MAM) Market
Despite its growth trajectory, the Vietnam Mobile Asset Management (MAM) Market faces notable constraints, particularly around data security and privacy concerns. As businesses rely more on mobile devices to manage sensitive information, vulnerabilities in data protection can pose significant risks. Moreover, integrating MAM systems into existing IT infrastructures can prove challenging, often requiring a comprehensive approach to ensure smooth implementation and user acceptance across organizations.
Vietnam Mobile Asset Management (MAM) Market Trends
Key trends shaping the Vietnam MAM market include the increased integration of artificial intelligence and machine learning technologies, which enhance asset tracking and predictive maintenance. Furthermore, there is a marked shift towards cloud-based solutions, enabling real-time data access and management from any location. As digital transformation accelerates across various industries, businesses are also prioritizing the need for comprehensive analytics that allow for better decision-making regarding asset utilization.
Vietnam Mobile Asset Management (MAM) Market Opportunities
The landscape for investment in the Vietnam Mobile Asset Management (MAM) Market is ripe with opportunities, particularly in sectors like healthcare, logistics, and retail, where asset tracking is vital. Companies can leverage innovations in IoT to create smarter asset management systems, further driving efficiency. Additionally, as the workforce increasingly shifts to remote operations, there's a growing market for tailored MAM solutions that facilitate remote monitoring and management.
Government Initiatives in the Vietnam Mobile Asset Management (MAM) Market
The Vietnamese government has been actively promoting digital transformation across various sectors, which indirectly benefits the MAM market. Policies aimed at fostering IT infrastructure development and incentivizing technology adoption are paving the way for innovative asset management solutions. Additionally, public spending on digitalization initiatives enhances the overall capacity of businesses to integrate effective mobile asset management systems into their operations.
Future Insights of the Vietnam Mobile Asset Management (MAM) Market
Looking ahead to the period from 2026 to 2032, the Vietnam Mobile Asset Management (MAM) Market is expected to experience significant advancements in technology and service offerings. The push for more robust data security measures will be paramount, and companies that prioritize integrating next-gen MAM solutions are likely to lead the market. Furthermore, the ongoing evolution of work dynamics—such as hybrid work environments—will continue to shape demand for flexible, scalable asset management strategies.
Vietnam Mobile Asset Management (MAM) Market Latest Developments (May 2025 - June 2026)
In recent months, there has been a marked increase in partnerships among technology firms and local IT service providers, aimed at enhancing mobile asset management capabilities. New product launches focusing on integrating advanced security features and real-time monitoring functionalities have garnered attention. The market is also witnessing a rising interest in mobile asset management solutions tailored specifically for the healthcare and logistics sectors, driven by the ongoing demand for efficiency in these critical industries.
Vietnam Mobile Asset Management (MAM) Market - Key Attractiveness of the Report
- 10 Years of Market Numbers
- Historical Data Starting from 2022 to 2025
- Base Year: 2025
- Forecast Data until 2032
- Key Performance Indicators Impacting the Market
- Major Upcoming Developments and Projects
Key Highlights of the Report:
- Vietnam Mobile Asset Management (MAM) Market Outlook
- Market Size of Vietnam Mobile Asset Management (MAM) Market, 2025
- Forecast of Vietnam Mobile Asset Management (MAM) Market, 2032
- Historical Data and Forecast of Vietnam Mobile Asset Management (MAM) Revenues & Volume for the Period 2022-2032F
- Vietnam Mobile Asset Management (MAM) Market Trend Evolution
- Vietnam Mobile Asset Management (MAM) Market Drivers and Challenges
- Vietnam Mobile Asset Management (MAM) Price Trends
- Vietnam Mobile Asset Management (MAM) Porter's Five Forces
- Vietnam Mobile Asset Management (MAM) Industry Life Cycle
- Historical Data and Forecast of Vietnam Mobile Asset Management (MAM) Market Revenues & Volume By Components for the Period 2022-2032F
- Historical Data and Forecast of Vietnam Mobile Asset Management (MAM) Market Revenues & Volume By Solutions for the Period 2022-2032F
- Historical Data and Forecast of Vietnam Mobile Asset Management (MAM) Market Revenues & Volume By Services for the Period 2022-2032F
- Historical Data and Forecast of Vietnam Mobile Asset Management (MAM) Market Revenues & Volume By Asset Types for the Period 2022-2032F
- Historical Data and Forecast of Vietnam Mobile Asset Management (MAM) Market Revenues & Volume By Fixed Assets for the Period 2022-2032F
- Historical Data and Forecast of Vietnam Mobile Asset Management (MAM) Market Revenues & Volume By Mobile Assets for the Period 2022-2032F
- Historical Data and Forecast of Vietnam Mobile Asset Management (MAM) Market Revenues & Volume By Organization Size for the Period 2022-2032F
- Historical Data and Forecast of Vietnam Mobile Asset Management (MAM) Market Revenues & Volume By SMEs for the Period 2022-2032F
- Historical Data and Forecast of Vietnam Mobile Asset Management (MAM) Market Revenues & Volume By Large Enterprises for the Period 2022-2032F
- Historical Data and Forecast of Vietnam Mobile Asset Management (MAM) Market Revenues & Volume By Vertical for the Period 2022-2032F
- Historical Data and Forecast of Vietnam Mobile Asset Management (MAM) Market Revenues & Volume By Building Automation for the Period 2022-2032F
- Historical Data and Forecast of Vietnam Mobile Asset Management (MAM) Market Revenues & Volume By Manufacturing for the Period 2022-2032F
- Historical Data and Forecast of Vietnam Mobile Asset Management (MAM) Market Revenues & Volume By Healthcare for the Period 2022-2032F
- Historical Data and Forecast of Vietnam Mobile Asset Management (MAM) Market Revenues & Volume By Retail for the Period 2022-2032F
- Historical Data and Forecast of Vietnam Mobile Asset Management (MAM) Market Revenues & Volume By Energy & Utilities for the Period 2022-2032F
- Historical Data and Forecast of Vietnam Mobile Asset Management (MAM) Market Revenues & Volume By Transportation & Logistics for the Period 2022-2032F
- Historical Data and Forecast of Vietnam Mobile Asset Management (MAM) Market Revenues & Volume By Metal & Mining for the Period 2022-2032F
- Historical Data and Forecast of Vietnam Mobile Asset Management (MAM) Market Revenues & Volume By Others for the Period 2022-2032F
- Historical Data and Forecast of Vietnam Mobile Asset Management (MAM) Market Revenues & Volume By Deployment Modes for the Period 2022-2032F
- Historical Data and Forecast of Vietnam Mobile Asset Management (MAM) Market Revenues & Volume By On-premises for the Period 2022-2032F
- Historical Data and Forecast of Vietnam Mobile Asset Management (MAM) Market Revenues & Volume By Cloud for the Period 2022-2032F
- Vietnam Mobile Asset Management (MAM) Import Export Trade Statistics
- Market Opportunity Assessment By Components
- Market Opportunity Assessment By Asset Types
- Market Opportunity Assessment By Organization Size
- Market Opportunity Assessment By Vertical
- Market Opportunity Assessment By Deployment Modes
- Vietnam Mobile Asset Management (MAM) Top Companies Market Share
- Vietnam Mobile Asset Management (MAM) Competitive Benchmarking By Technical and Operational Parameters
- Vietnam Mobile Asset Management (MAM) Company Profiles
- Vietnam Mobile Asset Management (MAM) Key Strategic Recommendations
Vietnam Mobile Asset Management (MAM) Market - Frequently Asked Questions
The growth of the Vietnam Mobile Asset Management (MAM) Market is largely driven by the increase in mobile device adoption and the necessity for businesses to manage these assets efficiently. The shift to remote work has also emphasized the need for effective asset tracking solutions.
The Vietnam Mobile Asset Management (MAM) Market was estimated at USD 437 Million in 2025 and is projected to reach USD 622 Million by 2032, growing at a CAGR of 5.2% from 2026 to 2032. This growth indicates a robust demand for MAM solutions as businesses increasingly prioritize asset efficiency.
Companies often encounter hurdles related to integrating mobile asset management systems with existing IT frameworks. Additionally, there are significant concerns around data security, as protecting sensitive information stored on mobile devices is critical.
The integration of AI and machine learning is significantly enhancing mobile asset management solutions. These technologies enable predictive maintenance and improve overall asset tracking efficiency.
Local IT service providers are increasingly vital in the Vietnam Mobile Asset Management (MAM) Market, offering customized solutions that cater to the specific needs of various industries. This localized approach fosters innovation and competition, driving the market forward.
6Wresearch actively monitors the Vietnam Mobile Asset Management (MAM) Market and publishes its comprehensive annual report, highlighting emerging trends, growth drivers, revenue analysis, and forecast outlook. Our insights help businesses to make data-backed strategic decisions with ongoing market dynamics. Our analysts track relevent industries related to the Vietnam Mobile Asset Management (MAM) Market, allowing our clients with actionable intelligence and reliable forecasts tailored to emerging regional needs.
Yes, we provide customisation as per your requirements. To learn more, feel free to contact us on sales@6wresearch.com
1 Executive Summary |
2 Introduction |
2.1 Key Highlights of the Report |
2.2 Report Description |
2.3 Market Scope & Segmentation |
2.4 Research Methodology |
2.5 Assumptions |
3 Vietnam Mobile Asset Management (MAM) Market Overview |
3.1 Vietnam Country Macro Economic Indicators |
3.2 Vietnam Mobile Asset Management (MAM) Market Revenues & Volume, 2022 & 2032F |
3.3 Vietnam Mobile Asset Management (MAM) Market - Industry Life Cycle |
3.4 Vietnam Mobile Asset Management (MAM) Market - Porter's Five Forces |
3.5 Vietnam Mobile Asset Management (MAM) Market Revenues & Volume Share, By Components, 2022 & 2032F |
3.6 Vietnam Mobile Asset Management (MAM) Market Revenues & Volume Share, By Asset Types, 2022 & 2032F |
3.7 Vietnam Mobile Asset Management (MAM) Market Revenues & Volume Share, By Organization Size, 2022 & 2032F |
3.8 Vietnam Mobile Asset Management (MAM) Market Revenues & Volume Share, By Vertical, 2022 & 2032F |
3.9 Vietnam Mobile Asset Management (MAM) Market Revenues & Volume Share, By Deployment Modes, 2022 & 2032F |
4 Vietnam Mobile Asset Management (MAM) Market Dynamics |
4.1 Impact Analysis |
4.2 Market Drivers |
4.2.1 Increasing adoption of IoT and connected devices in Vietnam |
4.2.2 Growing focus on improving operational efficiency and cost savings among businesses |
4.2.3 Rising demand for real-time tracking and monitoring of assets in various industries |
4.3 Market Restraints |
4.3.1 Data security and privacy concerns related to mobile asset management solutions |
4.3.2 Lack of awareness and understanding about the benefits of mobile asset management among potential users |
5 Vietnam Mobile Asset Management (MAM) Market Trends |
6 Vietnam Mobile Asset Management (MAM) Market, By Types |
6.1 Vietnam Mobile Asset Management (MAM) Market, By Components |
6.1.1 Overview and Analysis |
6.1.2 Vietnam Mobile Asset Management (MAM) Market Revenues & Volume, By Components, 2022-2032F |
6.1.3 Vietnam Mobile Asset Management (MAM) Market Revenues & Volume, By Solutions, 2022-2032F |
6.1.4 Vietnam Mobile Asset Management (MAM) Market Revenues & Volume, By Services, 2022-2032F |
6.2 Vietnam Mobile Asset Management (MAM) Market, By Asset Types |
6.2.1 Overview and Analysis |
6.2.2 Vietnam Mobile Asset Management (MAM) Market Revenues & Volume, By Fixed Assets, 2022-2032F |
6.2.3 Vietnam Mobile Asset Management (MAM) Market Revenues & Volume, By Mobile Assets, 2022-2032F |
6.3 Vietnam Mobile Asset Management (MAM) Market, By Organization Size |
6.3.1 Overview and Analysis |
6.3.2 Vietnam Mobile Asset Management (MAM) Market Revenues & Volume, By SMEs, 2022-2032F |
6.3.3 Vietnam Mobile Asset Management (MAM) Market Revenues & Volume, By Large Enterprises, 2022-2032F |
6.4 Vietnam Mobile Asset Management (MAM) Market, By Vertical |
6.4.1 Overview and Analysis |
6.4.2 Vietnam Mobile Asset Management (MAM) Market Revenues & Volume, By Building Automation, 2022-2032F |
6.4.3 Vietnam Mobile Asset Management (MAM) Market Revenues & Volume, By Manufacturing, 2022-2032F |
6.4.4 Vietnam Mobile Asset Management (MAM) Market Revenues & Volume, By Healthcare, 2022-2032F |
6.4.5 Vietnam Mobile Asset Management (MAM) Market Revenues & Volume, By Retail, 2022-2032F |
6.4.6 Vietnam Mobile Asset Management (MAM) Market Revenues & Volume, By Energy & Utilities, 2022-2032F |
6.4.7 Vietnam Mobile Asset Management (MAM) Market Revenues & Volume, By Transportation & Logistics, 2022-2032F |
6.4.8 Vietnam Mobile Asset Management (MAM) Market Revenues & Volume, By Others, 2022-2032F |
6.4.9 Vietnam Mobile Asset Management (MAM) Market Revenues & Volume, By Others, 2022-2032F |
6.5 Vietnam Mobile Asset Management (MAM) Market, By Deployment Modes |
6.5.1 Overview and Analysis |
6.5.2 Vietnam Mobile Asset Management (MAM) Market Revenues & Volume, By On-premises, 2022-2032F |
6.5.3 Vietnam Mobile Asset Management (MAM) Market Revenues & Volume, By Cloud, 2022-2032F |
7 Vietnam Mobile Asset Management (MAM) Market Import-Export Trade Statistics |
7.1 Vietnam Mobile Asset Management (MAM) Market Export to Major Countries |
7.2 Vietnam Mobile Asset Management (MAM) Market Imports from Major Countries |
8 Vietnam Mobile Asset Management (MAM) Market Key Performance Indicators |
8.1 Percentage increase in the number of connected devices in Vietnam |
8.2 Average time savings achieved by businesses using mobile asset management solutions |
8.3 Percentage improvement in asset utilization rates |
8.4 Reduction in asset downtime due to proactive maintenance strategies |
8.5 Increase in the number of companies investing in mobile asset management technologies |
9 Vietnam Mobile Asset Management (MAM) Market - Opportunity Assessment |
9.1 Vietnam Mobile Asset Management (MAM) Market Opportunity Assessment, By Components, 2022 & 2032F |
9.2 Vietnam Mobile Asset Management (MAM) Market Opportunity Assessment, By Asset Types, 2022 & 2032F |
9.3 Vietnam Mobile Asset Management (MAM) Market Opportunity Assessment, By Organization Size, 2022 & 2032F |
9.4 Vietnam Mobile Asset Management (MAM) Market Opportunity Assessment, By Vertical, 2022 & 2032F |
9.5 Vietnam Mobile Asset Management (MAM) Market Opportunity Assessment, By Deployment Modes, 2022 & 2032F |
10 Vietnam Mobile Asset Management (MAM) Market - Competitive Landscape |
10.1 Vietnam Mobile Asset Management (MAM) Market Revenue Share, By Companies, 2025 |
10.2 Vietnam Mobile Asset Management (MAM) Market Competitive Benchmarking, By Operating and Technical Parameters |
11 Company Profiles |
12 Recommendations |
13 Disclaimer |
Global Go To Market Strategy - 2030
Export potential enables firms to identify high-growth global markets with greater confidence by combining advanced trade intelligence with a structured quantitative methodology. The framework analyzes emerging demand trends and country-level import patterns while integrating macroeconomic and trade datasets such as GDP and population forecasts, bilateral import–export flows, tariff structures, elasticity differentials between developed and developing economies, geographic distance, and import demand projections. Using weighted trade values from 2020–2024 as the base period to project country-to-country export potential for 2030, these inputs are operationalized through calculated drivers such as gravity model parameters, tariff impact factors, and projected GDP per-capita growth. Through an analysis of hidden potentials, demand hotspots, and market conditions that are most favorable to success, this method enables firms to focus on target countries, maximize returns, and global expansion with data, backed by accuracy.
By factoring in the projected importer demand gap that is currently unmet and could be potential opportunity, it identifies the potential for the Exporter (Country) among 190 countries, against the general trade analysis, which identifies the biggest importer or exporter.
To discover high-growth global markets and optimize your business strategy:
Click Here
Pricing
- Single User License$ 1,995
- Department License$ 2,400
- Site License$ 3,120
- Global License$ 3,795

Leadership Perspectives from Industry Events
Search
Thought Leadership and Analyst Meet


Our Clients
6WResearch In News
- India Air Conditioner Market Set for Strong Rebound in 2026 After Weather-Led Correction and GST-Driven Recovery: 6Wresearch
- ADAS in India: How Automatic Emergency Braking, Blind Spot Detection & Driver Monitoring are Transforming Road Safety
- Doha a strategic location for EV manufacturing hub: IPA Qatar
- Demand for luxury TVs surging in the GCC, says Samsung
- Empowering Growth: The Thriving Journey of Bangladesh’s Cable Industry
- Demand for luxury TVs surging in the GCC, says Samsung
Latest Reports
- Nicaragua RPG Gaming Market (2026-2032)
- New Zealand RPG Gaming Market (2026-2032)
- Netherlands RPG Gaming Market (2026-2032)
- Nauru RPG Gaming Market (2026-2032)
- Namibia RPG Gaming Market (2026-2032)
- Mozambique RPG Gaming Market (2026-2032)
- Montenegro RPG Gaming Market (2026-2032)
- Mongolia RPG Gaming Market (2026-2032)
- Monaco RPG Gaming Market (2026-2032)
- Micronesia RPG Gaming Market (2026-2032)
Industry Events and Analyst Meet

EV India Expo 2026

HIMTEX 2026

India Refining Summit 2026

India EV Show 2026

EV tech India Expo 2026
Whitepaper
- Middle East & Africa Commercial Security Market Click here to view more.
- Middle East & Africa Fire Safety Systems & Equipment Market Click here to view more.
- GCC Drone Market Click here to view more.
- Middle East Lighting Fixture Market Click here to view more.
- GCC Physical & Perimeter Security Market Click here to view more.