Vietnam Physical Security Market Size & Growth Rate (2026-2032)
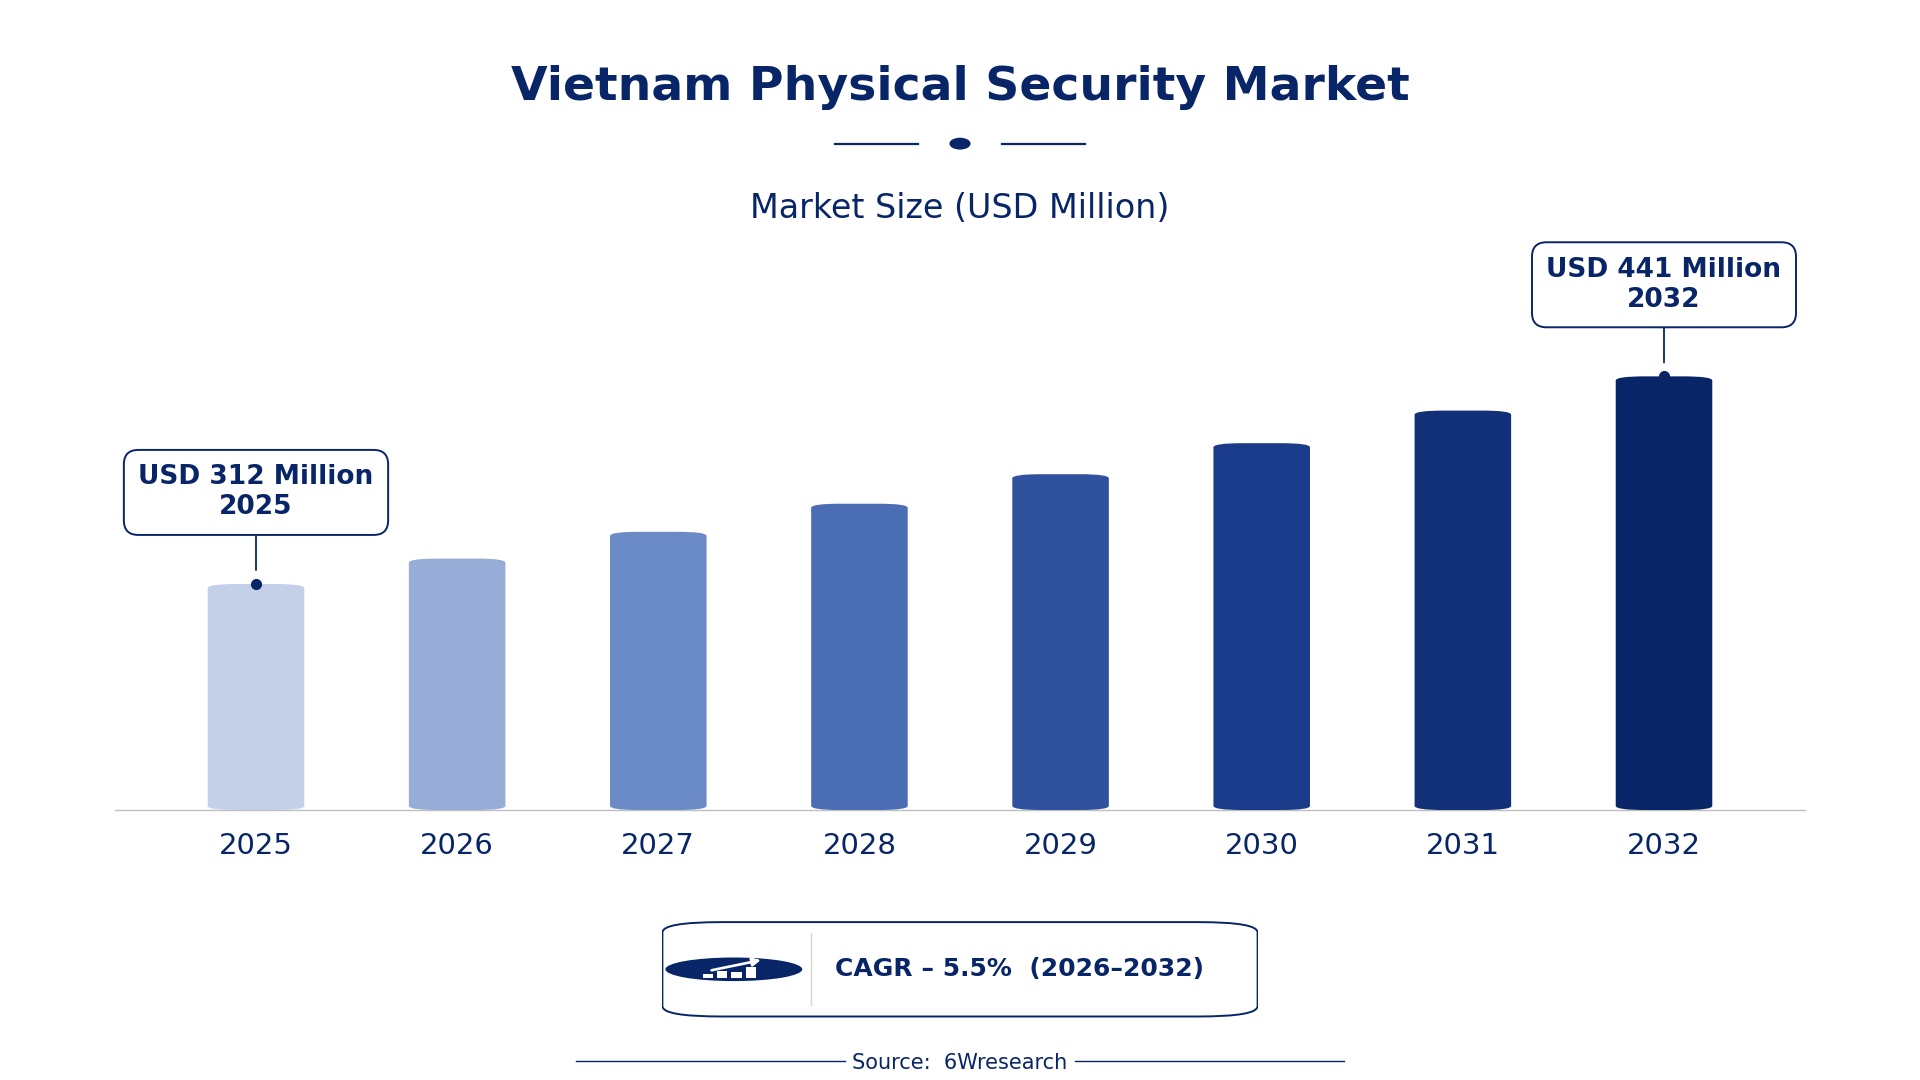
The Vietnam Physical Security Market was estimated at USD 312 Million in 2025 and is projected to reach USD 441 Million by 2032, growing at a CAGR of 5.5% from 2026 to 2032.
Vietnam Physical Security Market Synopsis
Vietnam's approach to physical security is experiencing a significant shift, driven by rapid urbanization and an increasing focus on infrastructure protection. Businesses and government agencies are prioritizing advanced security solutions, from video surveillance to access control systems, recognizing the need to safeguard both physical assets and individuals.
The demand for physical security solutions in Vietnam reflects a broader trend of enhanced safety and risk management practices. As security threats evolve, the market is adapting, integrating technologies that ensure compliance with international standards while addressing local vulnerabilities.
Vietnam Physical Security Market Year-wise Growth Rate and Key Drivers
This graph illustrates the annual growth rates of the Vietnam Physical Security Market from 2021 to 2032, highlighting a steady upward trajectory and projected expansion over the forecast period.
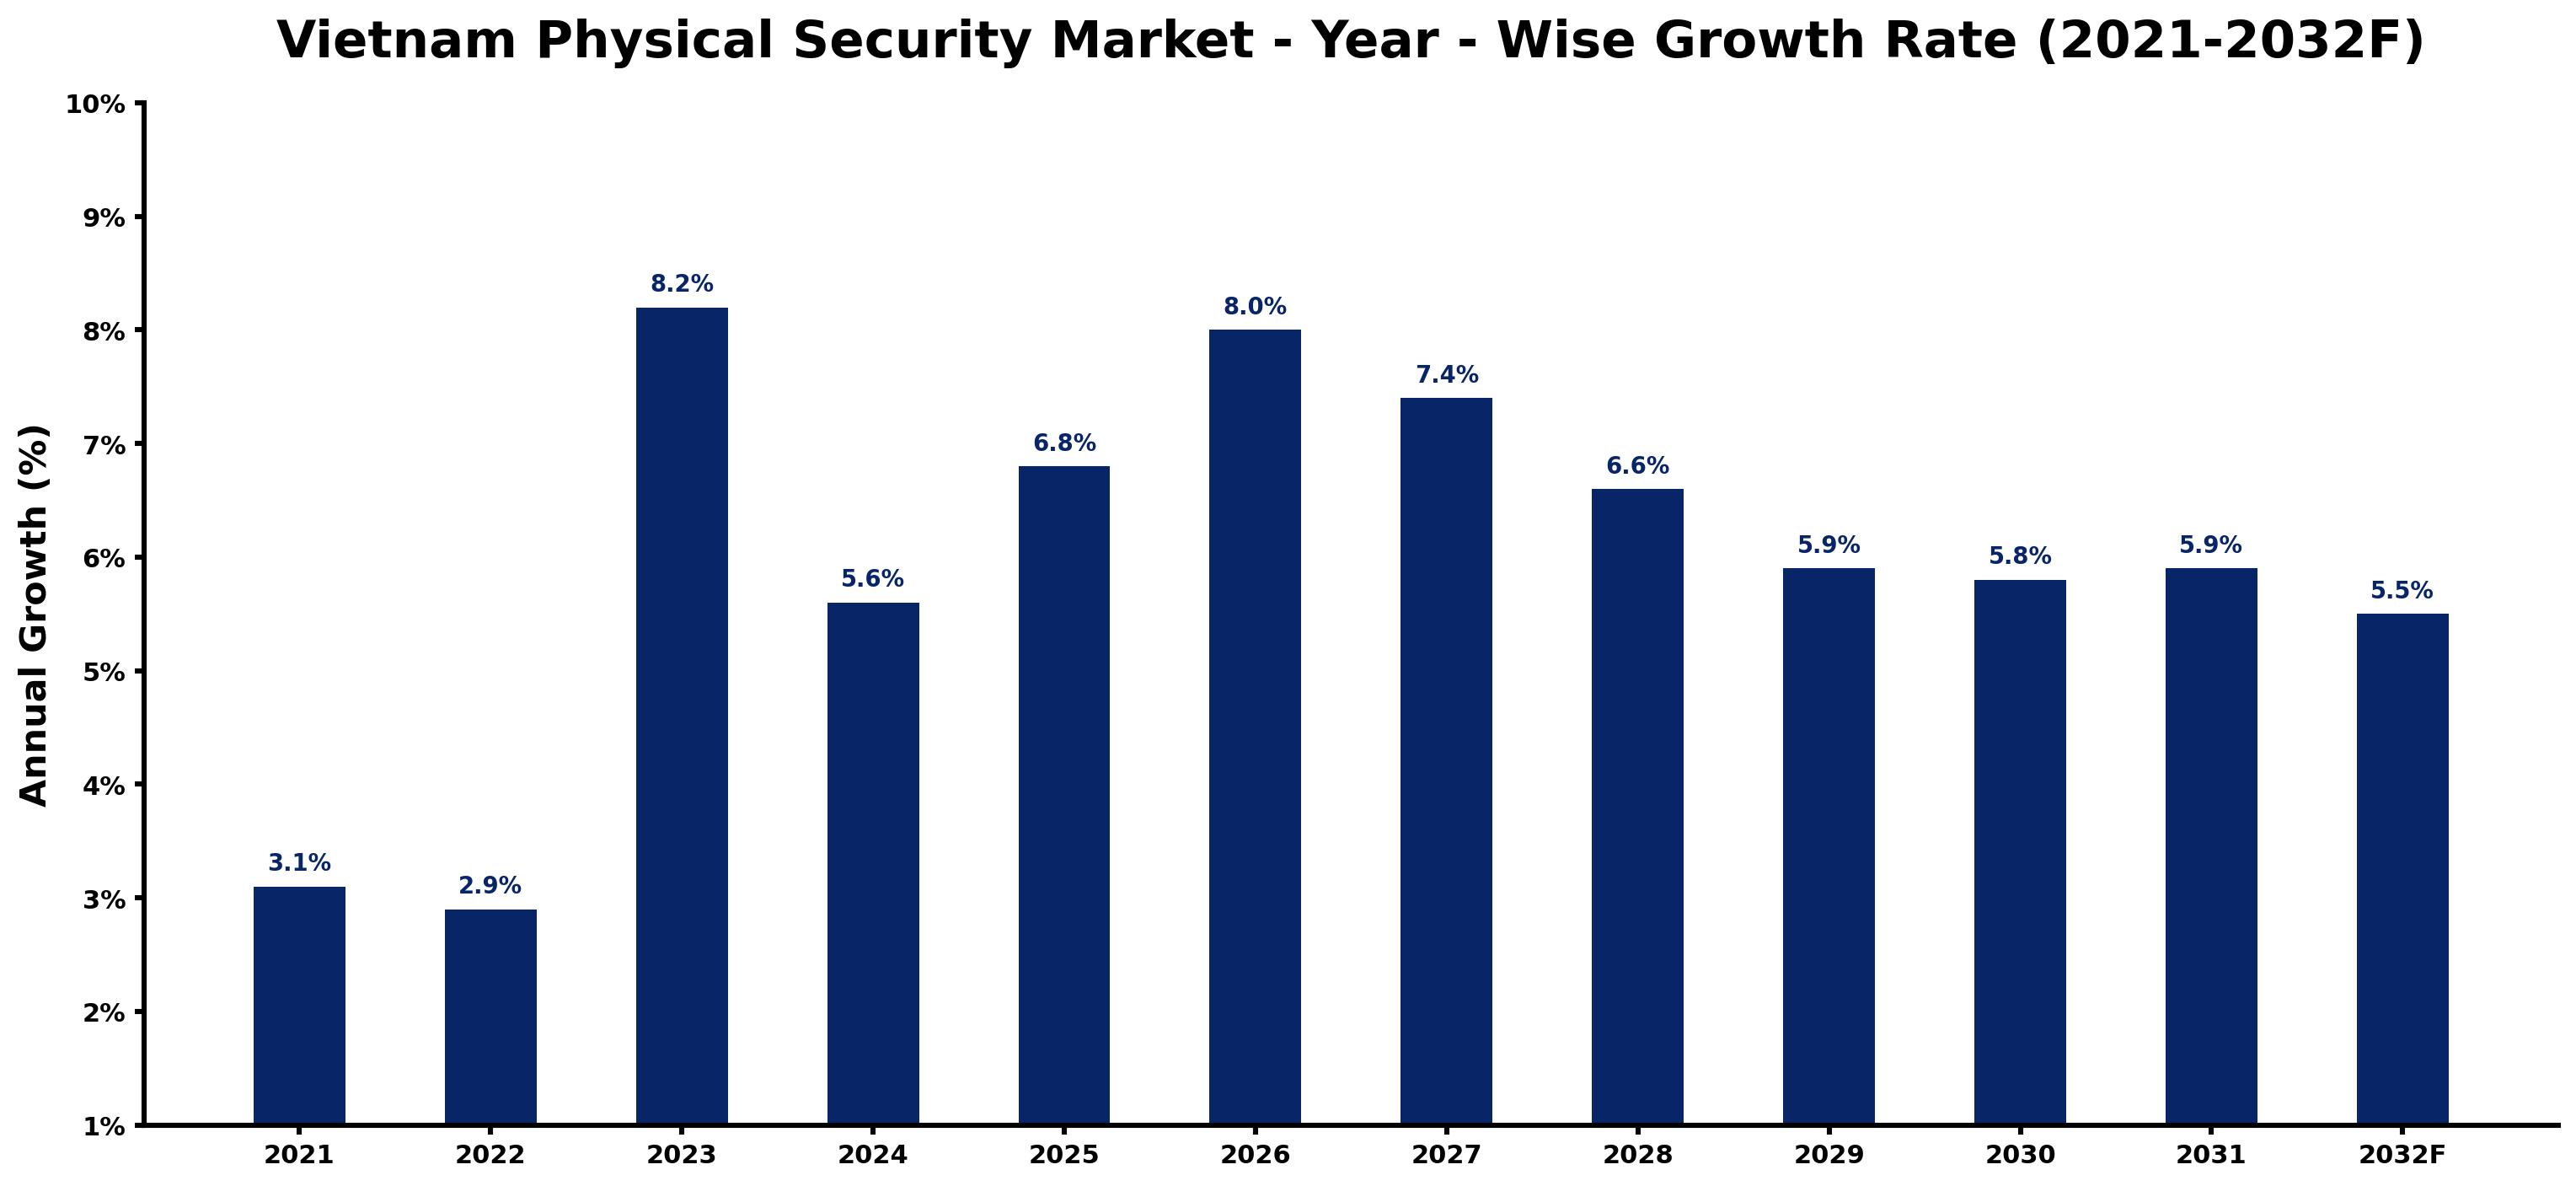
The table below presents the year‑wise growth rates along with the key drivers influencing the market
| Year | Growth Rate | Major Drivers |
| 2021 | 3.1% | Increased government focus on public safety initiatives. |
| 2022 | 2.9% | Rising concerns over theft in urban areas. |
| 2023 | 8.2% | Expanding urbanization driving demand for surveillance systems. |
| 2024 | 5.6% | Local regulations mandating security checks in businesses. |
| 2025 | 6.8% | Growing adoption of smart security technology solutions. |
| 2026 | 8.0% | Government incentives for security infrastructure upgrades. |
| 2027 | 7.4% | Strengthening cybersecurity protocols enhancing physical security needs. |
| 2028 | 6.6% | Increased foreign investment in safety-conscious industries. |
| 2029 | 5.9% | Heightened awareness of crime rates influencing security sales. |
| 2030 | 5.8% | Emergence of local security firms enhancing market competition. |
| 2031 | 5.9% | Rising residential security system installations in cities. |
| 2032 | 5.5% | Government collaborations with private firms on security solutions. |
Note: Market size estimations and growth projections presented in this report are based on 6Wresearch's proprietary forecasting methodology, utilizing the latest available industry data, government publications, and primary research inputs.
Vietnam Physical Security Market Key Takeaways
Below are some of the specific key takeaways from the market, including:
- The market is fueled by increased investments in advanced security technologies by both public and private sectors.
- Integration of health safety measures into security systems has been accelerated due to the COVID-19 pandemic.
- Government initiatives are crucial in shaping market dynamics, ensuring regulatory compliance and infrastructure protection.
- The trend toward biometrics and smart surveillance solutions is growing rapidly, driven by both demand and technological advancements.
- Skilled workforce shortages pose a challenge in adopting and managing sophisticated security technologies effectively.
Evaluation of Restraints in Vietnam Physical Security Market
The Vietnam Physical Security market is hampered by several restraints that inhibit its full potential. A critical issue is the escalating demand for advanced technology capable of countering increasingly sophisticated security threats. This necessitates significant investment in research and development to stay ahead of cybercriminal tactics.
on top of that, infrastructure upgrades are essential, especially in high-stakes sectors such as government and finance. Such upgrades involve complex integrations that can be both costly and time-consuming. Concerns about regulatory compliance and data privacy continue to complicate the environment, further stifling the market's growth.
Vietnam Physical Security Market Trends
Emerging trends indicate a significant pivot towards integrated security systems that combine physical and digital measures. Organizations are increasingly adopting smart surveillance technologies, including AI and IoT integration, to enhance threat detection and response capabilities.
Health safety measures have also become central, especially post-pandemic, with demand surging for thermal imaging and health monitoring systems as part of comprehensive security solutions. This shift signals a broader recognition of the importance of health alongside traditional security measures.
Vietnam Physical Security Market Opportunities
The future of the Vietnam Physical Security market is bright, with numerous opportunities ripe for investment. As urban centers expand, there is an increasing need for sophisticated security solutions tailored to high-density areas, providing avenues for innovation in product offerings.
Additionally, the emphasis on regulatory compliance and infrastructure protection by the government opens up possibilities for new public-private partnerships. Companies that can offer cutting-edge, compliant solutions are well-positioned to capture significant market share.
Government Initiatives in the Vietnam Physical Security Market
The Vietnamese government is actively shaping the physical security market through a series of strategic initiatives that enhance public safety and regulatory compliance. With an increasing focus on critical infrastructure protection, government policies prioritize the integration of advanced security technologies.
- A recent initiative launched in early 2025 aims to improve public facility safety through upgraded surveillance and access control systems.
- Currently underway is a nationwide regulatory framework focused on enhancing cybersecurity measures within physical security systems.
- A planned program set to start in 2027 intends to incentivize the adoption of smart security solutions across commercial enterprises.
- The government is supporting infrastructure projects aimed at enhancing connectivity and security for remote areas, expected to roll out by mid-2026.
- An ongoing public awareness campaign is designed to educate citizens about the importance of physical security measures in safeguarding communities.
Future Insights of the Vietnam Physical Security Market
As we look ahead to 2032, the Vietnam Physical Security market will increasingly focus on integrating advanced technologies that address contemporary threats. The role of artificial intelligence and machine learning in security applications is expected to expand, paving the way for smarter, more responsive systems.
Investment in human resources will become equally crucial. Upskilling the workforce in emerging technologies will help close the gap in talent that currently hinders effective adoption. The interplay between evolving regulations and technological innovation will shape future market dynamics and opportunities.
Vietnam Physical Security Market Latest Developments
In the past year, the Vietnam Physical Security market has seen dynamic shifts characterized by strategic advancements and emerging technologies. Stakeholders are rapidly adjusting to meet the increasing demands for sophisticated security solutions.
- A technology vendor completed a rollout of an enhanced video surveillance system in multiple urban locations, significantly improving monitoring capabilities in Q2 2025.
- A major regional operator is currently underway with a biometric access control project that started in late 2025, targeting critical infrastructure sites.
- An upcoming initiative is expected to launch in early 2026, focused on integrating health safety features into existing physical security systems across several government facilities.
- A partnership was announced in mid-2025 between local manufacturers to develop next-gen intrusion detection technologies, expected to hit the market by late 2026.
Vietnam Physical Security Market - Key Attractiveness of the Report
- 10 Years of Market Numbers
- Historical Data Starting from 2022 to 2025
- Base Year: 2025
- Forecast Data until 2032
- Key Performance Indicators Impacting the Market
- Major Upcoming Developments and Projects
Key Highlights of the Report:
- Vietnam Physical Security Market Outlook
- Market Size of Vietnam Physical Security Market, 2025
- Forecast of Vietnam Physical Security Market, 2032
- Historical Data and Forecast of Vietnam Physical Security Revenues & Volume for the Period 2022-2032F
- Vietnam Physical Security Market Trend Evolution
- Vietnam Physical Security Market Drivers and Challenges
- Vietnam Physical Security Price Trends
- Vietnam Physical Security Porter's Five Forces
- Vietnam Physical Security Industry Life Cycle
- Historical Data and Forecast of Vietnam Physical Security Market Revenues & Volume By Component for the Period 2022-2032F
- Historical Data and Forecast of Vietnam Physical Security Market Revenues & Volume By Systems (PACS, PSIM, PIAM, Video Surveillance, Fire and Life Safety) for the Period 2022-2032F
- Historical Data and Forecast of Vietnam Physical Security Market Revenues & Volume By Services for the Period 2022-2032F
- Historical Data and Forecast of Vietnam Physical Security Market Revenues & Volume By Vertical for the Period 2022-2032F
- Historical Data and Forecast of Vietnam Physical Security Market Revenues & Volume By BFSI for the Period 2022-2032F
- Historical Data and Forecast of Vietnam Physical Security Market Revenues & Volume By Government for the Period 2022-2032F
- Historical Data and Forecast of Vietnam Physical Security Market Revenues & Volume By Retail for the Period 2022-2032F
- Historical Data and Forecast of Vietnam Physical Security Market Revenues & Volume By Transportation for the Period 2022-2032F
- Historical Data and Forecast of Vietnam Physical Security Market Revenues & Volume By Residential for the Period 2022-2032F
- Historical Data and Forecast of Vietnam Physical Security Market Revenues & Volume By Telecom and IT for the Period 2022-2032F
- Historical Data and Forecast of Vietnam Physical Security Market Revenues & Volume By Other Verticals (Healthcare, Manufacturing, Energy and Utilities, and Education). for the Period 2022-2032F
- Historical Data and Forecast of Vietnam Physical Security Market Revenues & Volume By Organization Size for the Period 2022-2032F
- Historical Data and Forecast of Vietnam Physical Security Market Revenues & Volume By SMEs for the Period 2022-2032F
- Historical Data and Forecast of Vietnam Physical Security Market Revenues & Volume By Large Enterprises for the Period 2022-2032F
- Vietnam Physical Security Import Export Trade Statistics
- Market Opportunity Assessment By Component
- Market Opportunity Assessment By Vertical
- Market Opportunity Assessment By Organization Size
- Vietnam Physical Security Top Companies Market Share
- Vietnam Physical Security Competitive Benchmarking By Technical and Operational Parameters
- Vietnam Physical Security Company Profiles
- Vietnam Physical Security Key Strategic Recommendations






































