Vietnam Processed Fruit Market (2026-2032) | Companies, Share, Growth, Analysis, Forecast, Trends, Size, Value, Revenue, Industry & Outlook
Market Forecast By Product (Fresh, Fresh- Cut, Canned, Frozen, Drying &Dehydration), By Processing Equipment (Pre-processing, Processing, Washing, Filling, Seasoning, Packaging) And Competitive Landscape
| Product Code: ETC040451 | Publication Date: Aug 2023 | Updated Date: Jun 2026 | Product Type: Report | |
| Publisher: 6Wresearch | Author: Ravi Bhandari | No. of Pages: 70 | No. of Figures: 35 | No. of Tables: 5 |
Vietnam Processed Fruit Market Summary
The vietnam processed fruit market was estimated at USD 278 Million in 2025 and is projected to reach USD 391 Million by 2032, growing at a CAGR of 8.1% from 2026 to 2032.
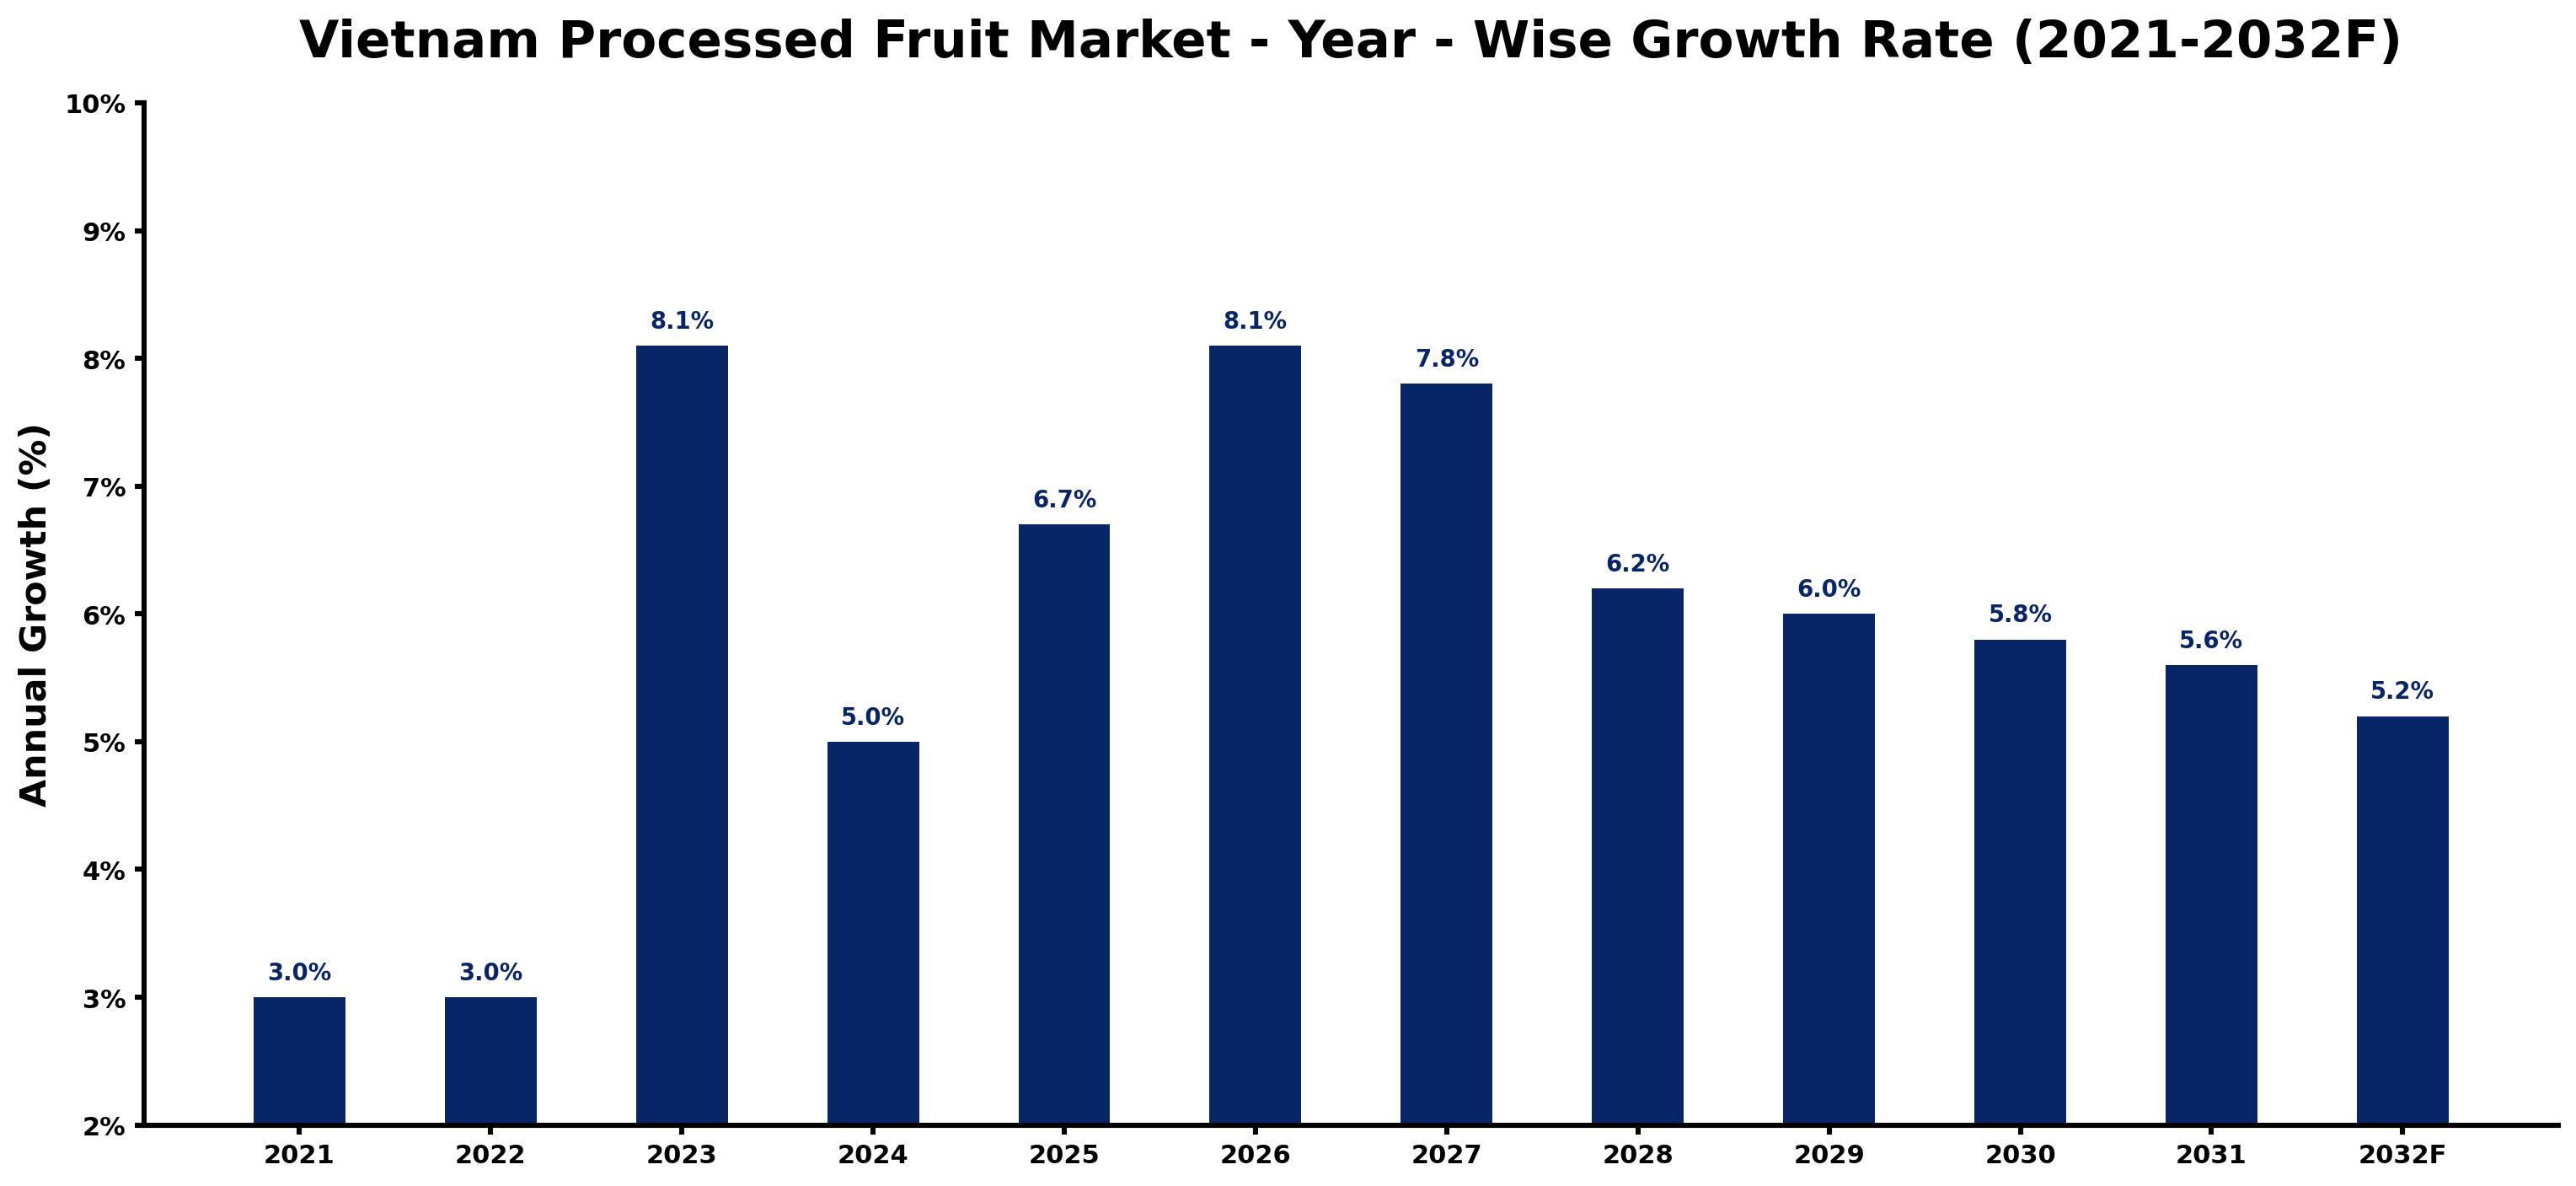
Vietnam Processed Fruit Market Growth Rate Analysis (2021-2032)
The Vietnam processed fruit market is experiencing a robust upward trend, with growth rates rising notably from 3.0% in 2021 and 2022 to an impressive 8.1% in 2023. This spike can be attributed to increasing consumer demand for convenience and healthy snacking options, coupled with advancements in food processing technologies that enhance product quality. Continued investments in infrastructure and supply chain efficiencies are expected to sustain growth, projected at 5.0% in 2024 and peaking again at 8.1% in 2026. However, as the market matures, growth rates will moderate, with estimates of 5.6% by 2031 and 5.2% in 2032, reflecting a balancing act between innovation and market saturation.
Vietnam Processed Fruit Market Year-wise Growth Rate and Key Drivers
This graph highlights how the Vietnam Processed Fruit Market has steadily grown over the past five years, supported by major growth factors.
The table below presents the year wise growth rates along with the key drivers influencing the market
| Year | Growth Rate | Major Drivers |
| 2021 | 3.0% | Post-lockdown retail projects have invigorated the processed fruit sector in Vietnam. |
| 2022 | 3.0% | Rising health consciousness among consumers boosts interest in convenient fruit options. |
| 2023 | 8.1% | E-commerce platforms expand reach, facilitating easier access to processed fruit products. |
| 2024 | 5.0% | Local manufacturers increasingly leverage advanced technologies to improve production efficiency. |
| 2025 | 6.7% | Young urban populations show preference for innovative snack alternatives, driving product diversity. |
| 2026 | 8.1% | Supply chain enhancements create opportunities for fresh local produce integration into products. |
| 2027 | 7.8% | Market players are focusing on sustainable practices to attract eco-conscious consumers. |
| 2028 | 6.2% | Emerging food trends highlight unique flavors, prompting new product development initiatives. |
| 2029 | 6.0% | Investment in rural infrastructure enhances distribution channels for processed fruit products. |
| 2030 | 5.8% | Brand collaborations with local farmers strengthen community ties, enriching supply chains. |
| 2031 | 5.6% | Consumer demand encourages diversification into organic and health-oriented processed fruit lines. |
| 2032 | 5.2% | Global trade partnerships facilitate imports, expanding the variety available in Vietnamese markets. |
Note - Market size estimations and growth projections presented in this report are based on 6Wresearch's advanced forecasting approach, validated with industry datasets as of June 2026.
Vietnam Processed Fruit Market Synopsis
The Vietnam Processed Fruit Market is projected to reach 8.1% and witness significant growth during the forecast period (2026-2032). This flourishing segment of the food and beverage industry encompasses a diverse array of products including canned, frozen, and dried fruits. The increasing consumer preference for convenience and longer shelf life has amplified the popularity of processed fruit goods amid the rapidly changing lifestyles of urban populations. Factors such as rising disposable incomes, health consciousness, and urbanization are all contributing to this market's robust expansion.
Vietnam Processed Fruit Market Growth Drivers
The growth of the Vietnam Processed Fruit Market is propelled by several interlinked drivers. Firstly, urbanization in Vietnam is leading to transformative changes in consumer behavior.
- The increasing number of urban residents is correlating with a demand for convenient, ready-to-eat food options that processed fruits readily fulfill.
- Health awareness among consumers is on the rise, resulting in an emphasis on nutritious snacks, particularly dried and freeze-dried fruits, viewed as healthier alternatives.
- Modern retail channels are expanding throughout Vietnam, enhancing accessibility to processed fruit products, which encourages consumer trials and purchases.
- Increasing disposable incomes allow consumers to spend more on food products, favoring those that are convenient and perceived as premium options.
- The cultural shift towards snacking is nurturing consistent consumption of processed fruits as they fit seamlessly into on-the-go lifestyles.
Vietnam Processed Fruit Market Challenges and Restraints
Despite its potential for growth, the Vietnam Processed Fruit Market faces several challenges that could impact its trajectory.
- One prominent challenge includes the perishability of raw fruits, which necessitates advanced processing and storage capabilities to prevent wastage and retain nutritional value.
- The need for specialized infrastructure is paramount in maintaining product quality, yet many regions still lack adequate facilities, complicating the supply chain.
- Competition from imported processed fruit products is intensifying as international brands penetrate the Vietnamese market, potentially undermining local producers.
- Seasonal fluctuations and adverse weather conditions can disrupt local fruit supply chains, affecting the availability of high-quality raw materials for processing.
- Consumer preferences may vary widely, thus requiring constant innovation and adaptation to maintain market relevance amid evolving tastes and trends.
Vietnam Processed Fruit Market Government Investment and Initiatives
The government of Vietnam is heavily investing in initiatives that support the growth of the processed fruit market. Policies aimed at promoting agricultural modernization are being implemented to enhance quality and productivity. These initiatives are designed to:
- Encourage the establishment of modern processing facilities that can handle large volumes of fruit while maintaining quality standards.
- Provide financial incentives for farmers who adopt sustainable practices and engage in high-quality fruit production.
- Facilitate partnerships between local producers and academic institutions for research and development in food processing technologies.
- Support small and medium enterprises in the processed fruits sector through access to funding and training programs.
- Promote awareness of Vietnamese processed fruits in both domestic and international markets through trade fairs and promotional campaigns.
Vietnam Processed Fruit Market Latest Developments (May 2025 - June 2026)
Recent developments within the Vietnam Processed Fruit Market highlight a dynamic evolution as the industry adapts to changing conditions. The shift in consumer purchasing behavior, influenced by the lingering effects of the COVID-19 pandemic, has reshaped product offerings and marketing strategies. Notable changes include:
- A noticeable increase in online sales channels for processed fruit, as e-commerce continues to be a preferred shopping method for many consumers.
- Introducing new flavors and packaging formats to attract a younger demographic while catering to diverse consumer preferences.
- Collaborations between local manufacturers and international businesses aimed at enhancing product quality and expanding market reach.
- Increased focus on sustainability in production methods, including reduced use of preservatives and environmentally friendly packaging.
- Efforts to strengthen supply chains post-pandemic, ensuring that processed fruit products remain available year-round, regardless of agricultural production cycles.
Vietnam Processed Fruit Market - Key Attractiveness of the Report
- 10 Years of Market Numbers
- Historical Data Starting from 2022 to 2025
- Base Year: 2025
- Forecast Data until 2032
- Key Performance Indicators Impacting the Market
- Major Upcoming Developments and Projects
Key Highlights of the Report:
- Vietnam Processed Fruit Market Outlook
- Market Size of Vietnam Processed Fruit Market, 2025
- Forecast of Vietnam Processed Fruit Market, 2032
- Historical Data and Forecast of Vietnam Processed Fruit Revenues & Volume for the Period 2022-2032F
- Vietnam Processed Fruit Market Trend Evolution
- Vietnam Processed Fruit Market Drivers and Challenges
- Vietnam Processed Fruit Price Trends
- Vietnam Processed Fruit Porter's Five Forces
- Vietnam Processed Fruit Industry Life Cycle
- Historical Data and Forecast of Vietnam Processed Fruit Market Revenues & Volume By Product for the Period 2022-2032F
- Historical Data and Forecast of Vietnam Processed Fruit Market Revenues & Volume By Fresh for the Period 2022-2032F
- Historical Data and Forecast of Vietnam Processed Fruit Market Revenues & Volume By Fresh- Cut for the Period 2022-2032F
- Historical Data and Forecast of Vietnam Processed Fruit Market Revenues & Volume By Canned for the Period 2022-2032F
- Historical Data and Forecast of Vietnam Processed Fruit Market Revenues & Volume By Frozen for the Period 2022-2032F
- Historical Data and Forecast of Vietnam Processed Fruit Market Revenues & Volume By Drying &Dehydration for the Period 2022-2032F
- Historical Data and Forecast of Vietnam Processed Fruit Market Revenues & Volume By Processing Equipment for the Period 2022-2032F
- Historical Data and Forecast of Vietnam Processed Fruit Market Revenues & Volume By Pre-processing for the Period 2022-2032F
- Historical Data and Forecast of Vietnam Processed Fruit Market Revenues & Volume By Processing for the Period 2022-2032F
- Historical Data and Forecast of Vietnam Processed Fruit Market Revenues & Volume By Washing for the Period 2022-2032F
- Historical Data and Forecast of Vietnam Processed Fruit Market Revenues & Volume By Filling for the Period 2022-2032F
- Historical Data and Forecast of Vietnam Processed Fruit Market Revenues & Volume By Seasoning for the Period 2022-2032F
- Historical Data and Forecast of Vietnam Processed Fruit Market Revenues & Volume By Packaging for the Period 2022-2032F
- Vietnam Processed Fruit Import Export Trade Statistics
- Market Opportunity Assessment By Product
- Market Opportunity Assessment By Processing Equipment
- Vietnam Processed Fruit Top Companies Market Share
- Vietnam Processed Fruit Competitive Benchmarking By Technical and Operational Parameters
- Vietnam Processed Fruit Company Profiles
- Vietnam Processed Fruit Key Strategic Recommendations
Frequently Asked Questions About the Market Study (FAQs):
The primary products include canned fruits, frozen fruits, and dried fruits, which are gaining popularity due to their convenience and extended shelf life.
Urbanization is leading to changes in consumer preferences toward convenience foods, driving demand for processed fruit products that are quick and easy to consume.
The Vietnamese government is promoting agricultural modernization and providing incentives to improve fruit quality and processing capabilities, thus fostering market growth.
Challenges include the perishability of fruits, competition from imports, and the need for better processing infrastructure, which can affect overall market stability.
6Wresearch actively monitors the Vietnam Processed Fruit Market and publishes its comprehensive annual report, highlighting emerging trends, growth drivers, revenue analysis, and forecast outlook. Our insights help businesses to make data-backed strategic decisions with ongoing market dynamics. Our analysts track relevent industries related to the Vietnam Processed Fruit Market, allowing our clients with actionable intelligence and reliable forecasts tailored to emerging regional needs.
Yes, we provide customisation as per your requirements. To learn more, feel free to contact us on sales@6wresearch.com
1 Executive Summary |
2 Introduction |
2.1 Key Highlights of the Report |
2.2 Report Description |
2.3 Market Scope & Segmentation |
2.4 Research Methodology |
2.5 Assumptions |
3 Vietnam Processed Fruit Market Overview |
3.1 Vietnam Country Macro Economic Indicators |
3.2 Vietnam Processed Fruit Market Revenues & Volume, 2022 & 2032F |
3.3 Vietnam Processed Fruit Market - Industry Life Cycle |
3.4 Vietnam Processed Fruit Market - Porter's Five Forces |
3.5 Vietnam Processed Fruit Market Revenues & Volume Share, By Product, 2022 & 2032F |
3.6 Vietnam Processed Fruit Market Revenues & Volume Share, By Processing Equipment, 2022 & 2032F |
4 Vietnam Processed Fruit Market Dynamics |
4.1 Impact Analysis |
4.2 Market Drivers |
4.3 Market Restraints |
5 Vietnam Processed Fruit Market Trends |
6 Vietnam Processed Fruit Market, By Types |
6.1 Vietnam Processed Fruit Market, By Product |
6.1.1 Overview and Analysis |
6.1.2 Vietnam Processed Fruit Market Revenues & Volume, By Product, 2022-2032F |
6.1.3 Vietnam Processed Fruit Market Revenues & Volume, By Fresh, 2022-2032F |
6.1.4 Vietnam Processed Fruit Market Revenues & Volume, By Fresh- Cut, 2022-2032F |
6.1.5 Vietnam Processed Fruit Market Revenues & Volume, By Canned, 2022-2032F |
6.1.6 Vietnam Processed Fruit Market Revenues & Volume, By Frozen, 2022-2032F |
6.1.7 Vietnam Processed Fruit Market Revenues & Volume, By Drying &Dehydration, 2022-2032F |
6.2 Vietnam Processed Fruit Market, By Processing Equipment |
6.2.1 Overview and Analysis |
6.2.2 Vietnam Processed Fruit Market Revenues & Volume, By Pre-processing, 2022-2032F |
6.2.3 Vietnam Processed Fruit Market Revenues & Volume, By Processing, 2022-2032F |
6.2.4 Vietnam Processed Fruit Market Revenues & Volume, By Washing, 2022-2032F |
6.2.5 Vietnam Processed Fruit Market Revenues & Volume, By Filling, 2022-2032F |
6.2.6 Vietnam Processed Fruit Market Revenues & Volume, By Seasoning, 2022-2032F |
6.2.7 Vietnam Processed Fruit Market Revenues & Volume, By Packaging, 2022-2032F |
7 Vietnam Processed Fruit Market Import-Export Trade Statistics |
7.1 Vietnam Processed Fruit Market Export to Major Countries |
7.2 Vietnam Processed Fruit Market Imports from Major Countries |
8 Vietnam Processed Fruit Market Key Performance Indicators |
9 Vietnam Processed Fruit Market - Opportunity Assessment |
9.1 Vietnam Processed Fruit Market Opportunity Assessment, By Product, 2022 & 2032F |
9.2 Vietnam Processed Fruit Market Opportunity Assessment, By Processing Equipment, 2022 & 2032F |
10 Vietnam Processed Fruit Market - Competitive Landscape |
10.1 Vietnam Processed Fruit Market Revenue Share, By Companies, 2025 |
10.2 Vietnam Processed Fruit Market Competitive Benchmarking, By Operating and Technical Parameters |
11 Company Profiles |
12 Recommendations |
13 Disclaimer |
Global Go To Market Strategy - 2030
Export potential enables firms to identify high-growth global markets with greater confidence by combining advanced trade intelligence with a structured quantitative methodology. The framework analyzes emerging demand trends and country-level import patterns while integrating macroeconomic and trade datasets such as GDP and population forecasts, bilateral import–export flows, tariff structures, elasticity differentials between developed and developing economies, geographic distance, and import demand projections. Using weighted trade values from 2020–2024 as the base period to project country-to-country export potential for 2030, these inputs are operationalized through calculated drivers such as gravity model parameters, tariff impact factors, and projected GDP per-capita growth. Through an analysis of hidden potentials, demand hotspots, and market conditions that are most favorable to success, this method enables firms to focus on target countries, maximize returns, and global expansion with data, backed by accuracy.
By factoring in the projected importer demand gap that is currently unmet and could be potential opportunity, it identifies the potential for the Exporter (Country) among 190 countries, against the general trade analysis, which identifies the biggest importer or exporter.
To discover high-growth global markets and optimize your business strategy:
Click Here
Pricing
- Single User License$ 1,995
- Department License$ 2,400
- Site License$ 3,120
- Global License$ 3,795

Leadership Perspectives from Industry Events
Search
Thought Leadership and Analyst Meet


Our Clients
6WResearch In News
- India Air Conditioner Market Set for Strong Rebound in 2026 After Weather-Led Correction and GST-Driven Recovery: 6Wresearch
- ADAS in India: How Automatic Emergency Braking, Blind Spot Detection & Driver Monitoring are Transforming Road Safety
- Doha a strategic location for EV manufacturing hub: IPA Qatar
- Demand for luxury TVs surging in the GCC, says Samsung
- Empowering Growth: The Thriving Journey of Bangladesh’s Cable Industry
- Demand for luxury TVs surging in the GCC, says Samsung
Latest Reports
- Poland Fire Protection Systems Market (2026-2032)
- Cape Verde Portable Hand-Thrown Extinguisher Market (2026-2032)
- Canada Portable Hand-Thrown Extinguisher Market (2026-2032)
- Cameroon Portable Hand-Thrown Extinguisher Market (2026-2032)
- Burundi Portable Hand-Thrown Extinguisher Market (2026-2032)
- Burkina Faso Portable Hand-Thrown Extinguisher Market (2026-2032)
- Bulgaria Portable Hand-Thrown Extinguisher Market (2026-2032)
- Brunei Portable Hand-Thrown Extinguisher Market (2026-2032)
- Botswana Portable Hand-Thrown Extinguisher Market (2026-2032)
- Bosnia and Herzegovina Portable Hand-Thrown Extinguisher Market (2026-2032)
Industry Events and Analyst Meet

HIMTEX 2026

India Refining Summit 2026

India EV Show 2026

EV tech India Expo 2026

Auto Tech Asia 2026
Whitepaper
- Middle East & Africa Commercial Security Market Click here to view more.
- Middle East & Africa Fire Safety Systems & Equipment Market Click here to view more.
- GCC Drone Market Click here to view more.
- Middle East Lighting Fixture Market Click here to view more.
- GCC Physical & Perimeter Security Market Click here to view more.