Vietnam Tables Market (2026-2032) | Trends, Size, Forecast, Companies, Outlook, Share, Industry, Growth, Revenue, Analysis & Value
Market Forecast By Types (Fabric, Leather, Metal, Wooden, Others), By Applications (Family, Office, Others) And Competitive Landscape
| Product Code: ETC034670 | Publication Date: Aug 2023 | Updated Date: Jun 2026 | Product Type: Report | |
| Publisher: 6Wresearch | Author: Ravi Bhandari | No. of Pages: 70 | No. of Figures: 35 | No. of Tables: 5 |
Vietnam Tables Market Summary
The vietnam tables market was estimated at USD 1261 Million in 2025 and is projected to reach USD 1788 Million by 2032, growing at a CAGR of 7.7% from 2026 to 2032.
Vietnam Tables Market Growth Rate Analysis (2021-2032)
The Vietnam tables market has showcased a notable upward trend, with growth rates fluctuating from 3.5% in 2021 to an impressive 8.4% in 2023. This surge can be attributed to increased consumer demand driven by urbanization and evolving lifestyles. Key infrastructural investments and a growing middle class are further fueling the expansion, particularly in sectors like hospitality and office spaces. However, growth is projected to moderate slightly to 5.2% in 2024, reflecting potential market saturation and competition. Nonetheless, robust gains of up to 7.7% by 2026 underline the ongoing investments in sustainable materials and digitalization processes within manufacturing, ensuring the market remains dynamic amidst changing consumer preferences.
Vietnam Tables Market Year-wise Growth Rate and Key Drivers
This graph highlights how the Vietnam Tables Market has steadily grown over the past five years, supported by major growth factors.
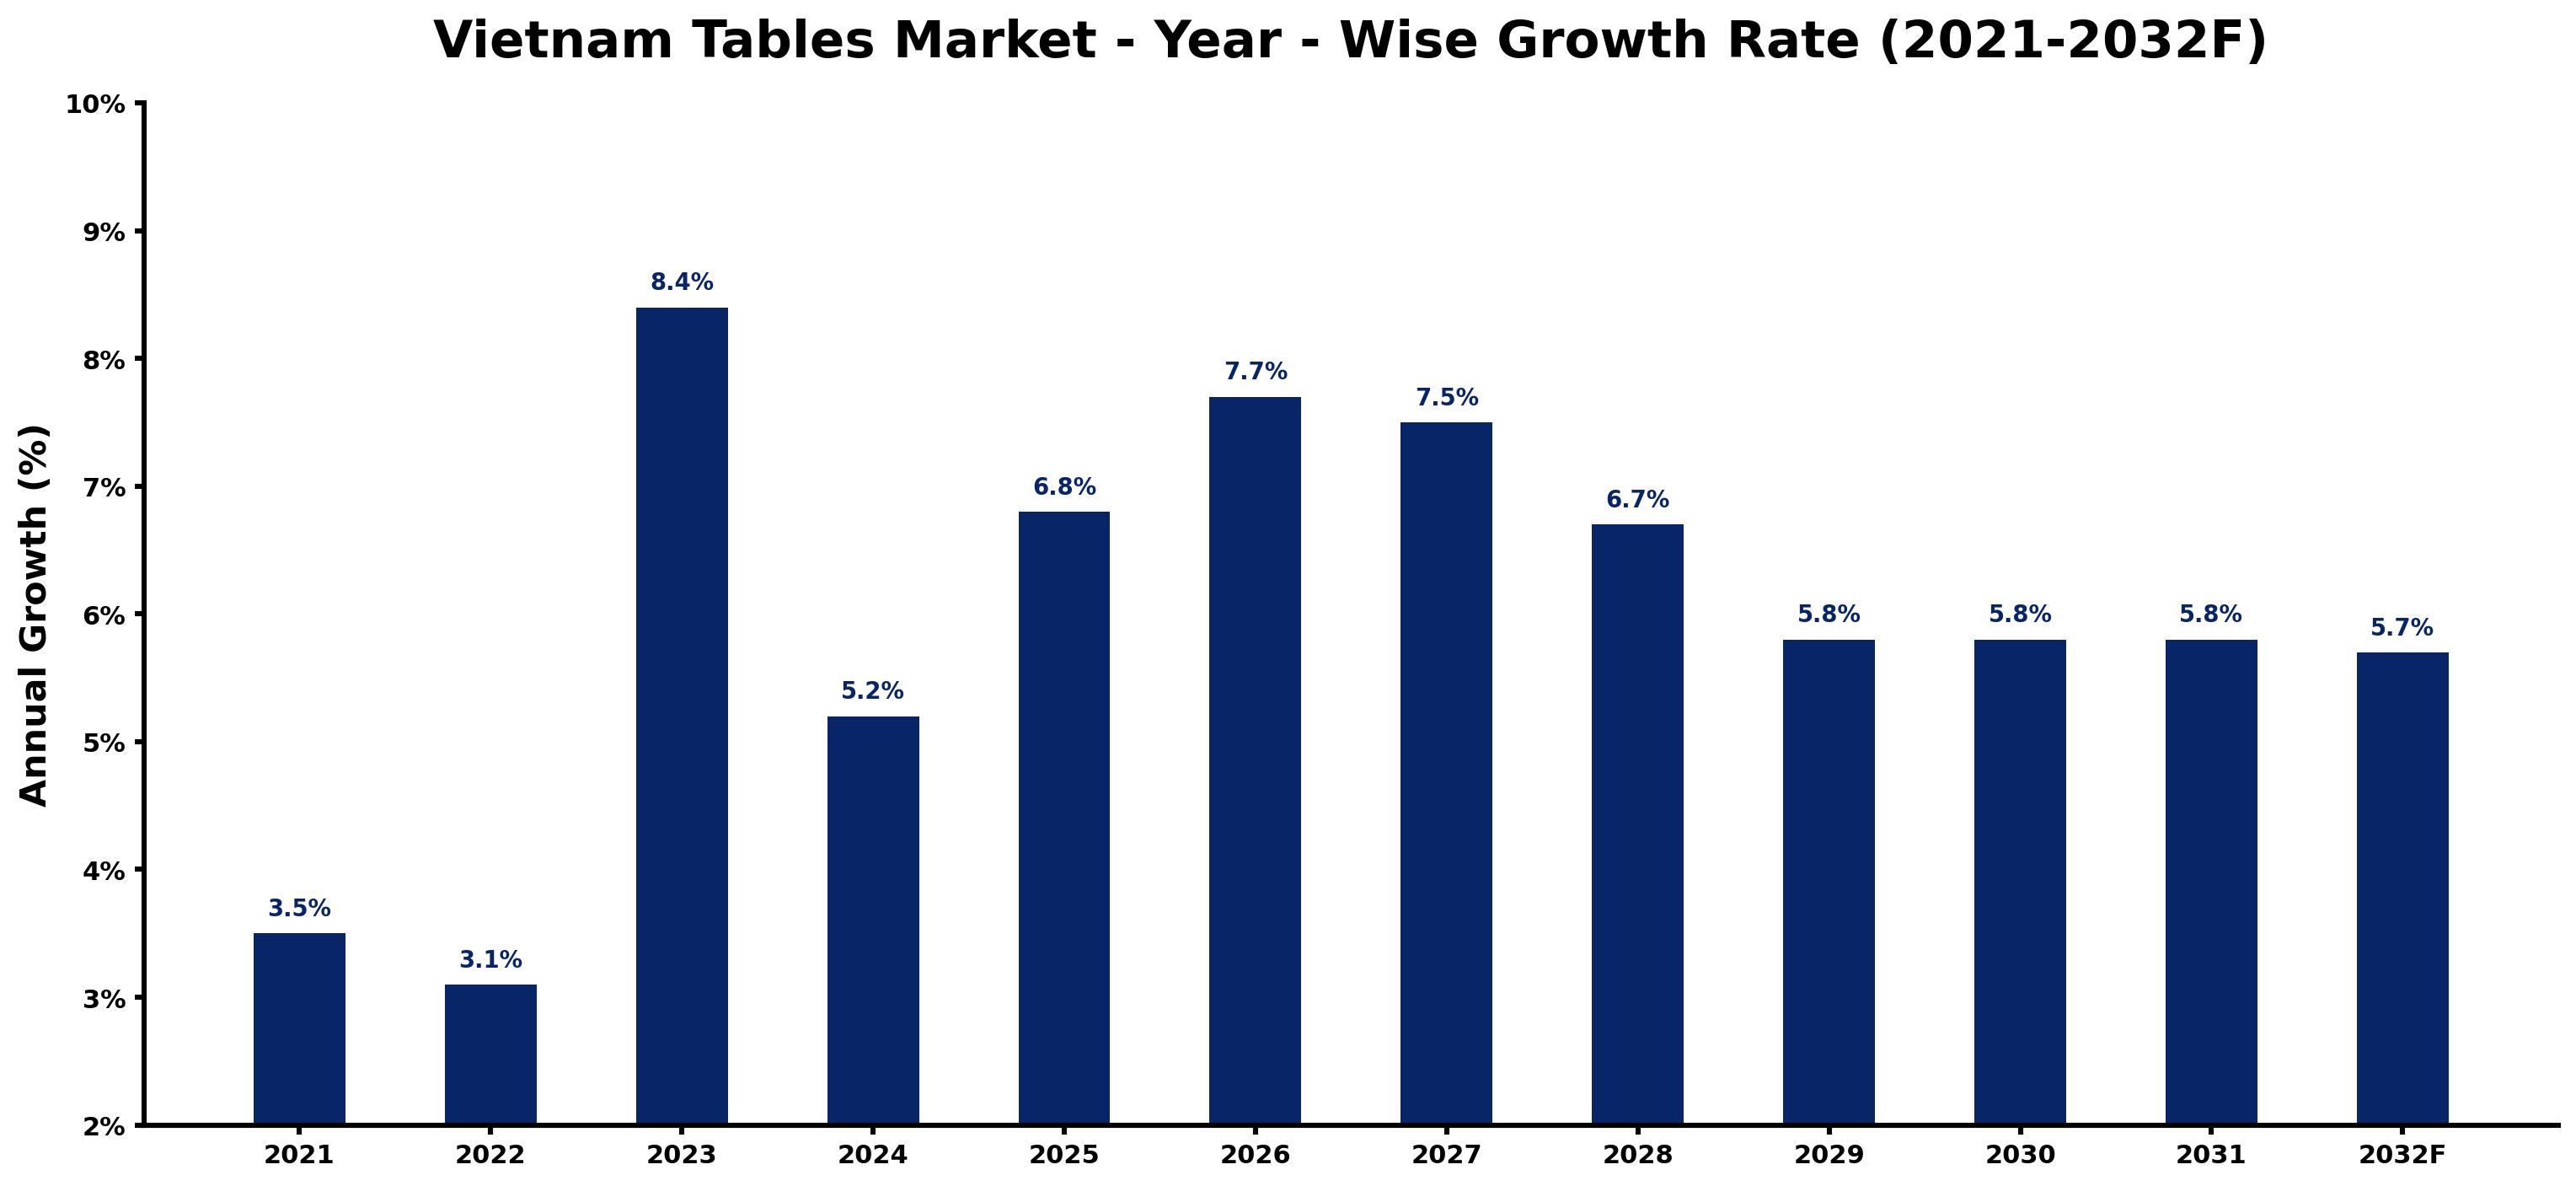
The table below presents the year wise growth rates along with the key drivers influencing the market
| Year | Growth Rate | Major Drivers |
| 2021 | 3.5% | Post-lockdown retail projects sparked a renewed interest in home furnishings across Vietnam. |
| 2022 | 3.1% | Increased urbanization shifted consumer preferences towards modern and multifunctional furniture designs. |
| 2023 | 8.4% | E-commerce platforms gained traction, enhancing accessibility to diverse table styles and prices. |
| 2024 | 5.2% | Rising disposable incomes inspired consumers to invest in premium quality dining experiences. |
| 2025 | 6.8% | Local artisans began collaborating with designers, enriching the market with unique handcrafted tables. |
| 2026 | 7.7% | Corporate offices upgraded interiors, driving demand for stylish conference and meeting tables. |
| 2027 | 7.5% | Sustainability trends encouraged the use of eco-friendly materials in table manufacturing processes. |
| 2028 | 6.7% | Urban dwellers favored space-saving furniture, prompting innovation in compact table designs. |
| 2029 | 5.8% | Vietnam's tourism sector revitalization led to higher demand for hospitality furniture solutions. |
| 2030 | 5.8% | Increased focus on home aesthetics motivated consumers to replace old furniture with modern alternatives. |
| 2031 | 5.8% | Smart home trends influenced table designs to incorporate technology for convenience and functionality. |
| 2032 | 5.7% | Rising international investments in Vietnam's furniture sector improved manufacturing capabilities and quality. |
Note - Market size estimations and growth projections presented in this report are based on 6Wresearch's advanced forecasting approach, validated with industry datasets as of June 2026.
Vietnam Tables Market Synopsis
The Vietnam Tables Market is projected to reach 7.7% and witness significant growth during the forecast period (2026-2032). Tables are a fundamental component of various environments, including residential, commercial, and educational settings. The market's expansion is driven by several factors such as the booming construction sector, rapid urbanization, and a shift in consumer preferences toward stylish and functional furniture. As Vietnam's economy continues to advance, there is an increasing demand for tables that blend aesthetics with utility, thereby propelling the market forward. Moreover, the trend of home improvement and renovation further stimulates market growth in this period.
Vietnam Tables Market Growth Drivers
Several pivotal factors are driving the growth of the Vietnam Tables Market. Firstly, the robust construction and real estate sectors significantly contribute to the increasing demand for tables in both residential and commercial buildings. As urban areas expand and more offices emerge, there is a heightened requirement for tables suitable for workplace environments and dining spaces. Secondly, the trend of urbanization continues to accelerate, leading to a surge in household formations in cities. This demographic shift results in increased need for modern furniture, including various types of tables. Furthermore, disposable income levels are rising, which influences consumer spending patterns towards high-quality and aesthetically pleasing tables.
- Increased investment in infrastructure developments has generated demand for tables across different sectors.
- Changing lifestyles and consumer preferences are driving the inclination towards multifunctional and stylish table designs.
- Covid-19 catalyzed a surge in home renovations, emphasizing the need for new furniture, notably tables.
- The rise of remote work and online education has amplified the demand for dedicated office and study tables.
- Enhanced marketing strategies adopted by manufacturers are expanding consumer awareness about the diverse table options available.
Vietnam Tables Market Challenges and Restraints
Despite the positive outlook, the Vietnam Tables Market faces several challenges. One significant obstacle pertains to the competition from alternative materials and designs. While traditional wooden tables have maintained popularity, there is an increasing consumer shift towards tables made from metal, glass, and engineered wood, necessitating manufacturers to innovate and diversify their product lines. Additionally, the impact of supply chain disruptions remains a pressing concern. The pandemic-induced lockdowns led to significant delays in manufacturing and distribution, adversely affecting table availability in certain regions. Understanding these challenges is crucial for stakeholders aiming to navigate this evolving market.
Vietnam Tables Market COVID-19 Impact
The COVID-19 pandemic had a mixed impact on the Vietnam Tables Market. Initially, the market experienced a decline in demand as lockdowns and restrictions curtailed economic activities, leading to reduced consumer spending on non-essential items, including furniture. However, as restrictions began to ease, a recovery was noted. The resumption of construction projects and increased home improvement activities revitalized demand for tables. Additionally, the shift to remote working and online learning highlighted the necessity for dedicated workspace solutions, which included office and study tables. This evolving consumer need underscored the importance of adaptable furniture that caters to both functional and aesthetic demands.
Vietnam Tables Market Government Investment and Initiatives
The Vietnamese government has been proactive in supporting infrastructure development and urbanization initiatives, which positively impact the Vietnam Tables Market. Public spending on housing and commercial facilities is expected to remain robust, as the government emphasizes the importance of improving living standards and promoting economic growth. In addition to direct investments in construction, various government policies aim to facilitate foreign investment and enhance the overall business environment, which indirectly supports furniture manufacturing. Such initiatives encourage the production of high-quality tables that adhere to international standards, fostering innovation and competitiveness within the market.
Vietnam Tables Market Latest Developments (May 2025 - June 2026)
From May 2025 to June 2026, the Vietnam Tables Market has experienced notable developments that illustrate its evolving landscape. There has been an increasing focus on sustainability, with manufacturers integrating eco-friendly materials and production processes into their offerings. This reflects a broader consumer shift toward environmentally responsible purchasing. Moreover, digital transformation has influenced marketing and retail strategies, with online platforms gaining traction as vital sales channels for furniture items, including tables. Furthermore, collaborations between designers and manufacturers have emerged to create unique table designs that cater to diverse consumer tastes, enhancing market dynamism during this timeframe.
Vietnam Tables Market - Key Attractiveness of the Report
- 10 Years of Market Numbers
- Historical Data Starting from 2022 to 2025
- Base Year: 2025
- Forecast Data until 2032
- Key Performance Indicators Impacting the Market
- Major Upcoming Developments and Projects
Key Highlights of the Report:
- Vietnam Tables Market Outlook
- Market Size of Vietnam Tables Market, 2025
- Forecast of Vietnam Tables Market, 2032
- Historical Data and Forecast of Vietnam Tables Revenues & Volume for the Period 2022-2032F
- Vietnam Tables Market Trend Evolution
- Vietnam Tables Market Drivers and Challenges
- Vietnam Tables Price Trends
- Vietnam Tables Porter's Five Forces
- Vietnam Tables Industry Life Cycle
- Historical Data and Forecast of Vietnam Tables Market Revenues & Volume By Types for the Period 2022-2032F
- Historical Data and Forecast of Vietnam Tables Market Revenues & Volume By Fabric for the Period 2022-2032F
- Historical Data and Forecast of Vietnam Tables Market Revenues & Volume By Leather for the Period 2022-2032F
- Historical Data and Forecast of Vietnam Tables Market Revenues & Volume By Metal for the Period 2022-2032F
- Historical Data and Forecast of Vietnam Tables Market Revenues & Volume By Wooden for the Period 2022-2032F
- Historical Data and Forecast of Vietnam Tables Market Revenues & Volume By Others for the Period 2022-2032F
- Historical Data and Forecast of Vietnam Tables Market Revenues & Volume By Applications for the Period 2022-2032F
- Historical Data and Forecast of Vietnam Tables Market Revenues & Volume By Family for the Period 2022-2032F
- Historical Data and Forecast of Vietnam Tables Market Revenues & Volume By Office for the Period 2022-2032F
- Historical Data and Forecast of Vietnam Tables Market Revenues & Volume By Others for the Period 2022-2032F
- Vietnam Tables Import Export Trade Statistics
- Market Opportunity Assessment By Types
- Market Opportunity Assessment By Applications
- Vietnam Tables Top Companies Market Share
- Vietnam Tables Competitive Benchmarking By Technical and Operational Parameters
- Vietnam Tables Company Profiles
- Vietnam Tables Key Strategic Recommendations
Frequently Asked Questions About the Market Study (FAQs):
The primary drivers include increased urbanization, growth in the construction sector, rising disposable incomes, and the popularity of home improvement trends.
Initially, the demand declined due to economic restrictions, but a rebound occurred as home improvement activities surged and remote work transitioned to a permanent fixture for many.
Challenges include competition from alternative materials, supply chain disruptions, and the need for manufacturers to innovate to meet changing consumer preferences.
Government investment in infrastructure and policies to attract foreign investment greatly support the growth and innovation within the furniture market, including tables.
6Wresearch actively monitors the Vietnam Tables Market and publishes its comprehensive annual report, highlighting emerging trends, growth drivers, revenue analysis, and forecast outlook. Our insights help businesses to make data-backed strategic decisions with ongoing market dynamics. Our analysts track relevent industries related to the Vietnam Tables Market, allowing our clients with actionable intelligence and reliable forecasts tailored to emerging regional needs.
Yes, we provide customisation as per your requirements. To learn more, feel free to contact us on sales@6wresearch.com
1 Executive Summary |
2 Introduction |
2.1 Key Highlights of the Report |
2.2 Report Description |
2.3 Market Scope & Segmentation |
2.4 Research Methodology |
2.5 Assumptions |
3 Vietnam Tables Market Overview |
3.1 Vietnam Country Macro Economic Indicators |
3.2 Vietnam Tables Market Revenues & Volume, 2022 & 2032F |
3.3 Vietnam Tables Market - Industry Life Cycle |
3.4 Vietnam Tables Market - Porter's Five Forces |
3.5 Vietnam Tables Market Revenues & Volume Share, By Types, 2022 & 2032F |
3.6 Vietnam Tables Market Revenues & Volume Share, By Applications, 2022 & 2032F |
4 Vietnam Tables Market Dynamics |
4.1 Impact Analysis |
4.2 Market Drivers |
4.3 Market Restraints |
5 Vietnam Tables Market Trends |
6 Vietnam Tables Market, By Types |
6.1 Vietnam Tables Market, By Types |
6.1.1 Overview and Analysis |
6.1.2 Vietnam Tables Market Revenues & Volume, By Types, 2022-2032F |
6.1.3 Vietnam Tables Market Revenues & Volume, By Fabric, 2022-2032F |
6.1.4 Vietnam Tables Market Revenues & Volume, By Leather, 2022-2032F |
6.1.5 Vietnam Tables Market Revenues & Volume, By Metal, 2022-2032F |
6.1.6 Vietnam Tables Market Revenues & Volume, By Wooden, 2022-2032F |
6.1.7 Vietnam Tables Market Revenues & Volume, By Others, 2022-2032F |
6.2 Vietnam Tables Market, By Applications |
6.2.1 Overview and Analysis |
6.2.2 Vietnam Tables Market Revenues & Volume, By Family, 2022-2032F |
6.2.3 Vietnam Tables Market Revenues & Volume, By Office, 2022-2032F |
6.2.4 Vietnam Tables Market Revenues & Volume, By Others, 2022-2032F |
7 Vietnam Tables Market Import-Export Trade Statistics |
7.1 Vietnam Tables Market Export to Major Countries |
7.2 Vietnam Tables Market Imports from Major Countries |
8 Vietnam Tables Market Key Performance Indicators |
9 Vietnam Tables Market - Opportunity Assessment |
9.1 Vietnam Tables Market Opportunity Assessment, By Types, 2022 & 2032F |
9.2 Vietnam Tables Market Opportunity Assessment, By Applications, 2022 & 2032F |
10 Vietnam Tables Market - Competitive Landscape |
10.1 Vietnam Tables Market Revenue Share, By Companies, 2025 |
10.2 Vietnam Tables Market Competitive Benchmarking, By Operating and Technical Parameters |
11 Company Profiles |
12 Recommendations |
13 Disclaimer |
Global Go To Market Strategy - 2030
Export potential enables firms to identify high-growth global markets with greater confidence by combining advanced trade intelligence with a structured quantitative methodology. The framework analyzes emerging demand trends and country-level import patterns while integrating macroeconomic and trade datasets such as GDP and population forecasts, bilateral import–export flows, tariff structures, elasticity differentials between developed and developing economies, geographic distance, and import demand projections. Using weighted trade values from 2020–2024 as the base period to project country-to-country export potential for 2030, these inputs are operationalized through calculated drivers such as gravity model parameters, tariff impact factors, and projected GDP per-capita growth. Through an analysis of hidden potentials, demand hotspots, and market conditions that are most favorable to success, this method enables firms to focus on target countries, maximize returns, and global expansion with data, backed by accuracy.
By factoring in the projected importer demand gap that is currently unmet and could be potential opportunity, it identifies the potential for the Exporter (Country) among 190 countries, against the general trade analysis, which identifies the biggest importer or exporter.
To discover high-growth global markets and optimize your business strategy:
Click Here
Pricing
- Single User License$ 1,995
- Department License$ 2,400
- Site License$ 3,120
- Global License$ 3,795

Leadership Perspectives from Industry Events
Search
Thought Leadership and Analyst Meet


Our Clients
6WResearch In News
- India Air Conditioner Market Set for Strong Rebound in 2026 After Weather-Led Correction and GST-Driven Recovery: 6Wresearch
- ADAS in India: How Automatic Emergency Braking, Blind Spot Detection & Driver Monitoring are Transforming Road Safety
- Doha a strategic location for EV manufacturing hub: IPA Qatar
- Demand for luxury TVs surging in the GCC, says Samsung
- Empowering Growth: The Thriving Journey of Bangladesh’s Cable Industry
- Demand for luxury TVs surging in the GCC, says Samsung
Latest Reports
- Poland Fire Protection Systems Market (2026-2032)
- Cape Verde Portable Hand-Thrown Extinguisher Market (2026-2032)
- Canada Portable Hand-Thrown Extinguisher Market (2026-2032)
- Cameroon Portable Hand-Thrown Extinguisher Market (2026-2032)
- Burundi Portable Hand-Thrown Extinguisher Market (2026-2032)
- Burkina Faso Portable Hand-Thrown Extinguisher Market (2026-2032)
- Bulgaria Portable Hand-Thrown Extinguisher Market (2026-2032)
- Brunei Portable Hand-Thrown Extinguisher Market (2026-2032)
- Botswana Portable Hand-Thrown Extinguisher Market (2026-2032)
- Bosnia and Herzegovina Portable Hand-Thrown Extinguisher Market (2026-2032)
Industry Events and Analyst Meet

HIMTEX 2026

India Refining Summit 2026

India EV Show 2026

EV tech India Expo 2026

Auto Tech Asia 2026
Whitepaper
- Middle East & Africa Commercial Security Market Click here to view more.
- Middle East & Africa Fire Safety Systems & Equipment Market Click here to view more.
- GCC Drone Market Click here to view more.
- Middle East Lighting Fixture Market Click here to view more.
- GCC Physical & Perimeter Security Market Click here to view more.