Zambia Antiperspirants and Deodorants Market (2026-2032) | Analysis, Forecast, Growth, Size & Revenue, Companies, Share, Outlook, Competitive Landscape, Segmentation, Industry, Value, Trends
Market Forecast By Function (Aerosol Spray, Cream, Roll-On, Gel, Others), By Ingredient (Alcohol, Antimicrobials, Conditioner and Moisturizer, Fragrances, Paraben and Propellants, Others), By Distribution Channel (Store Based, Non-Store Based) And Competitive Landscape
| Product Code: ETC10110755 | Publication Date: Sep 2024 | Updated Date: Apr 2026 | Product Type: Market Research Report | |
| Publisher: 6Wresearch | Author: Sumit Sagar | No. of Pages: 75 | No. of Figures: 35 | No. of Tables: 20 |
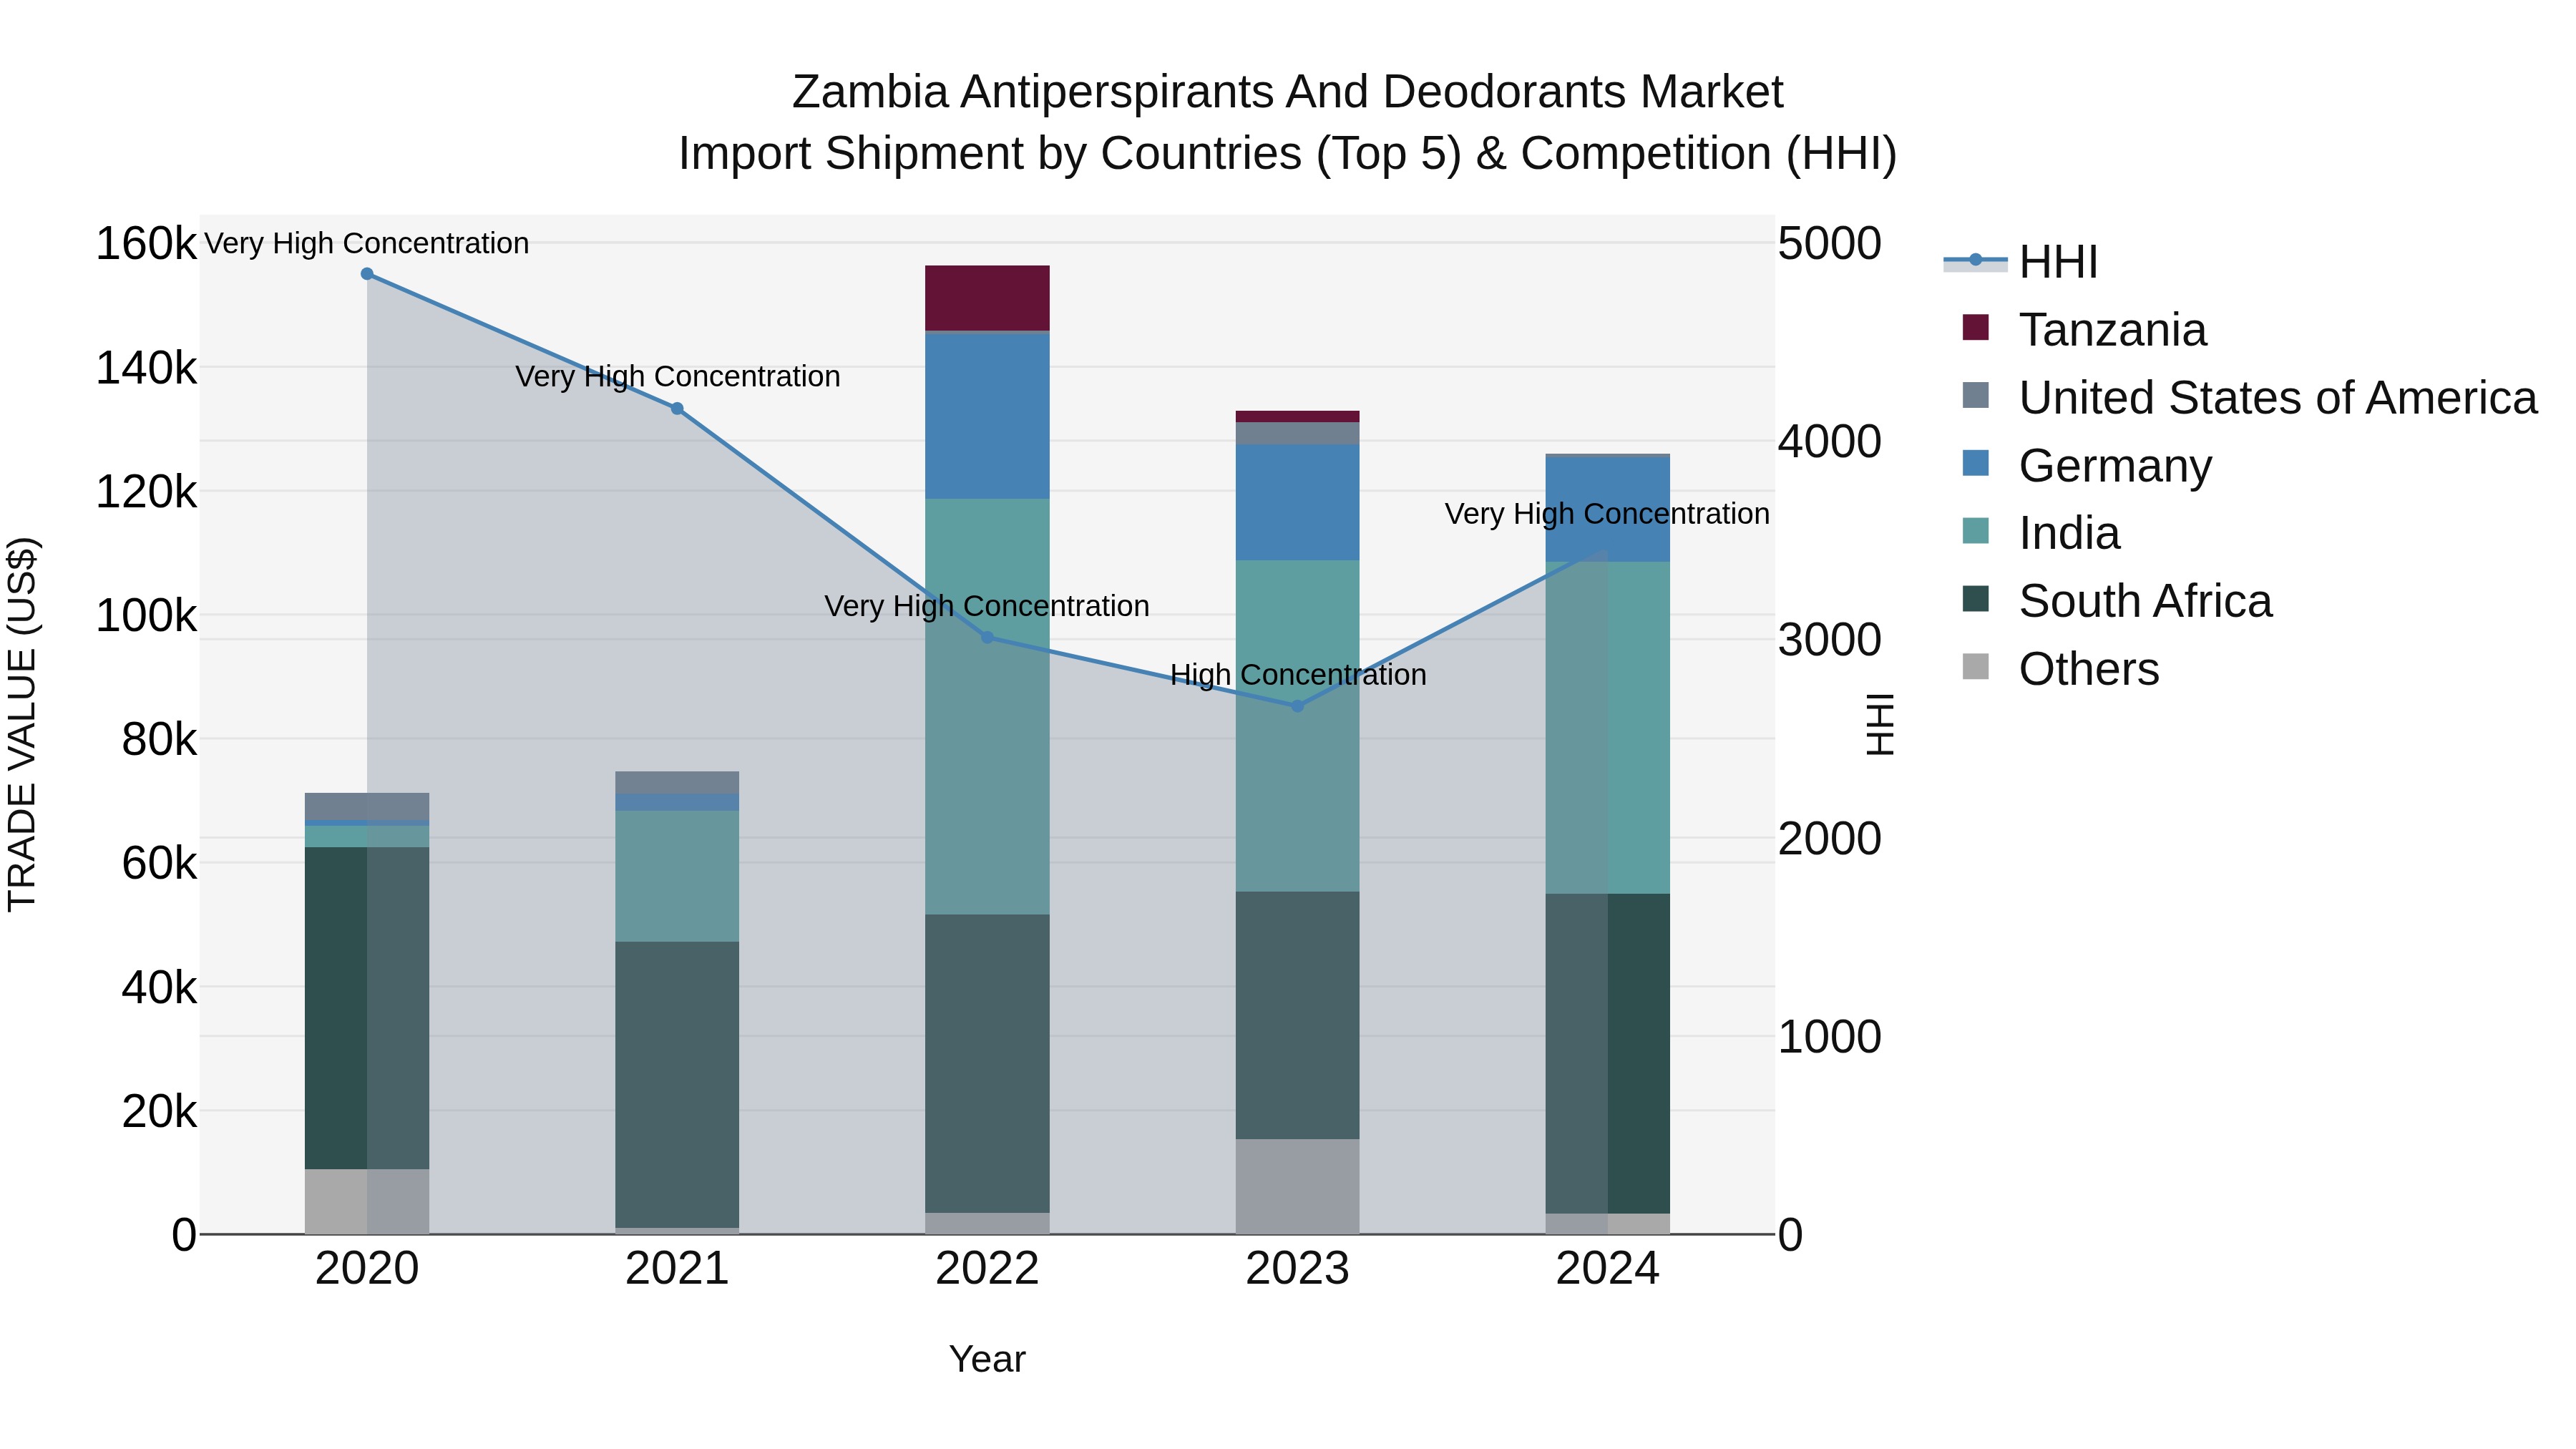
Zambia Antiperspirants and Deodorants Market: Top 5 Importing Countries and Market Competition (HHI) Analysis
The import shipments of antiperspirants and deodorants to Zambia in 2024 continued to be dominated by key exporting countries such as India, South Africa, Germany, United Arab Emirates, and Turkey. The high concentration of the Herfindahl-Hirschman Index (HHI) in 2023 intensified further in 2024, indicating a very high level of market concentration. Despite a notable compound annual growth rate (CAGR) of 15.31% from 2020 to 2024, there was a slight decline in the growth rate from 2023 to 2024 at -5.22%. This data suggests a competitive landscape with strong market presence from these top exporting countries in the Zambian antiperspir
Key Highlights of the Report:
- Zambia Antiperspirants and Deodorants Market Outlook
- Market Size of Zambia Antiperspirants and Deodorants Market, 2025
- Forecast of Zambia Antiperspirants and Deodorants Market, 2032
- Historical Data and Forecast of Zambia Antiperspirants and Deodorants Revenues & Volume for the Period 2022 - 2032
- Zambia Antiperspirants and Deodorants Market Trend Evolution
- Zambia Antiperspirants and Deodorants Market Drivers and Challenges
- Zambia Antiperspirants and Deodorants Price Trends
- Zambia Antiperspirants and Deodorants Porter's Five Forces
- Zambia Antiperspirants and Deodorants Industry Life Cycle
- Historical Data and Forecast of Zambia Antiperspirants and Deodorants Market Revenues & Volume By Function for the Period 2022 - 2032
- Historical Data and Forecast of Zambia Antiperspirants and Deodorants Market Revenues & Volume By Aerosol Spray for the Period 2022 - 2032
- Historical Data and Forecast of Zambia Antiperspirants and Deodorants Market Revenues & Volume By Cream for the Period 2022 - 2032
- Historical Data and Forecast of Zambia Antiperspirants and Deodorants Market Revenues & Volume By Roll-On for the Period 2022 - 2032
- Historical Data and Forecast of Zambia Antiperspirants and Deodorants Market Revenues & Volume By Gel for the Period 2022 - 2032
- Historical Data and Forecast of Zambia Antiperspirants and Deodorants Market Revenues & Volume By Others for the Period 2022 - 2032
- Historical Data and Forecast of Zambia Antiperspirants and Deodorants Market Revenues & Volume By Ingredient for the Period 2022 - 2032
- Historical Data and Forecast of Zambia Antiperspirants and Deodorants Market Revenues & Volume By Alcohol for the Period 2022 - 2032
- Historical Data and Forecast of Zambia Antiperspirants and Deodorants Market Revenues & Volume By Antimicrobials for the Period 2022 - 2032
- Historical Data and Forecast of Zambia Antiperspirants and Deodorants Market Revenues & Volume By Conditioner and Moisturizer for the Period 2022 - 2032
- Historical Data and Forecast of Zambia Antiperspirants and Deodorants Market Revenues & Volume By Fragrances for the Period 2022 - 2032
- Historical Data and Forecast of Zambia Antiperspirants and Deodorants Market Revenues & Volume By Paraben and Propellants for the Period 2022 - 2032
- Historical Data and Forecast of Zambia Antiperspirants and Deodorants Market Revenues & Volume By Others for the Period 2022 - 2032
- Historical Data and Forecast of Zambia Antiperspirants and Deodorants Market Revenues & Volume By Distribution Channel for the Period 2022 - 2032
- Historical Data and Forecast of Zambia Antiperspirants and Deodorants Market Revenues & Volume By Store Based for the Period 2022 - 2032
- Historical Data and Forecast of Zambia Antiperspirants and Deodorants Market Revenues & Volume By Non-Store Based for the Period 2022 - 2032
- Zambia Antiperspirants and Deodorants Import Export Trade Statistics
- Market Opportunity Assessment By Function
- Market Opportunity Assessment By Ingredient
- Market Opportunity Assessment By Distribution Channel
- Zambia Antiperspirants and Deodorants Top Companies Market Share
- Zambia Antiperspirants and Deodorants Competitive Benchmarking By Technical and Operational Parameters
- Zambia Antiperspirants and Deodorants Company Profiles
- Zambia Antiperspirants and Deodorants Key Strategic Recommendations
Frequently Asked Questions About the Market Study (FAQs):
6Wresearch actively monitors the Zambia Antiperspirants and Deodorants Market and publishes its comprehensive annual report, highlighting emerging trends, growth drivers, revenue analysis, and forecast outlook. Our insights help businesses to make data-backed strategic decisions with ongoing market dynamics. Our analysts track relevent industries related to the Zambia Antiperspirants and Deodorants Market, allowing our clients with actionable intelligence and reliable forecasts tailored to emerging regional needs.
Yes, we provide customisation as per your requirements. To learn more, feel free to contact us on sales@6wresearch.com
1 Executive Summary |
2 Introduction |
2.1 Key Highlights of the Report |
2.2 Report Description |
2.3 Market Scope & Segmentation |
2.4 Research Methodology |
2.5 Assumptions |
3 Zambia Antiperspirants and Deodorants Market Overview |
3.1 Zambia Country Macro Economic Indicators |
3.2 Zambia Antiperspirants and Deodorants Market Revenues & Volume, 2022 & 2032F |
3.3 Zambia Antiperspirants and Deodorants Market - Industry Life Cycle |
3.4 Zambia Antiperspirants and Deodorants Market - Porter's Five Forces |
3.5 Zambia Antiperspirants and Deodorants Market Revenues & Volume Share, By Function, 2022 & 2032F |
3.6 Zambia Antiperspirants and Deodorants Market Revenues & Volume Share, By Ingredient, 2022 & 2032F |
3.7 Zambia Antiperspirants and Deodorants Market Revenues & Volume Share, By Distribution Channel, 2022 & 2032F |
4 Zambia Antiperspirants and Deodorants Market Dynamics |
4.1 Impact Analysis |
4.2 Market Drivers |
4.2.1 Increasing awareness about personal hygiene and grooming among the population |
4.2.2 Rising disposable income leading to higher spending on personal care products |
4.2.3 Growing urbanization and changing lifestyle preferences favoring the use of antiperspirants and deodorants |
4.3 Market Restraints |
4.3.1 Price sensitivity among consumers due to economic factors |
4.3.2 Availability of alternative natural and homemade deodorant options |
4.3.3 Concerns regarding the potential health risks associated with certain chemical ingredients in antiperspirants |
5 Zambia Antiperspirants and Deodorants Market Trends |
6 Zambia Antiperspirants and Deodorants Market, By Types |
6.1 Zambia Antiperspirants and Deodorants Market, By Function |
6.1.1 Overview and Analysis |
6.1.2 Zambia Antiperspirants and Deodorants Market Revenues & Volume, By Function, 2022 - 2032F |
6.1.3 Zambia Antiperspirants and Deodorants Market Revenues & Volume, By Aerosol Spray, 2022 - 2032F |
6.1.4 Zambia Antiperspirants and Deodorants Market Revenues & Volume, By Cream, 2022 - 2032F |
6.1.5 Zambia Antiperspirants and Deodorants Market Revenues & Volume, By Roll-On, 2022 - 2032F |
6.1.6 Zambia Antiperspirants and Deodorants Market Revenues & Volume, By Gel, 2022 - 2032F |
6.1.7 Zambia Antiperspirants and Deodorants Market Revenues & Volume, By Others, 2022 - 2032F |
6.2 Zambia Antiperspirants and Deodorants Market, By Ingredient |
6.2.1 Overview and Analysis |
6.2.2 Zambia Antiperspirants and Deodorants Market Revenues & Volume, By Alcohol, 2022 - 2032F |
6.2.3 Zambia Antiperspirants and Deodorants Market Revenues & Volume, By Antimicrobials, 2022 - 2032F |
6.2.4 Zambia Antiperspirants and Deodorants Market Revenues & Volume, By Conditioner and Moisturizer, 2022 - 2032F |
6.2.5 Zambia Antiperspirants and Deodorants Market Revenues & Volume, By Fragrances, 2022 - 2032F |
6.2.6 Zambia Antiperspirants and Deodorants Market Revenues & Volume, By Paraben and Propellants, 2022 - 2032F |
6.2.7 Zambia Antiperspirants and Deodorants Market Revenues & Volume, By Others, 2022 - 2032F |
6.3 Zambia Antiperspirants and Deodorants Market, By Distribution Channel |
6.3.1 Overview and Analysis |
6.3.2 Zambia Antiperspirants and Deodorants Market Revenues & Volume, By Store Based, 2022 - 2032F |
6.3.3 Zambia Antiperspirants and Deodorants Market Revenues & Volume, By Non-Store Based, 2022 - 2032F |
7 Zambia Antiperspirants and Deodorants Market Import-Export Trade Statistics |
7.1 Zambia Antiperspirants and Deodorants Market Export to Major Countries |
7.2 Zambia Antiperspirants and Deodorants Market Imports from Major Countries |
8 Zambia Antiperspirants and Deodorants Market Key Performance Indicators |
8.1 Percentage of repeat customers indicating brand loyalty |
8.2 Average spending per customer on antiperspirants and deodorants |
8.3 Frequency of new product launches and innovations in the market |
8.4 Number of social media engagements and online reviews reflecting consumer satisfaction |
8.5 Market penetration in rural areas and smaller towns in Zambia |
9 Zambia Antiperspirants and Deodorants Market - Opportunity Assessment |
9.1 Zambia Antiperspirants and Deodorants Market Opportunity Assessment, By Function, 2022 & 2032F |
9.2 Zambia Antiperspirants and Deodorants Market Opportunity Assessment, By Ingredient, 2022 & 2032F |
9.3 Zambia Antiperspirants and Deodorants Market Opportunity Assessment, By Distribution Channel, 2022 & 2032F |
10 Zambia Antiperspirants and Deodorants Market - Competitive Landscape |
10.1 Zambia Antiperspirants and Deodorants Market Revenue Share, By Companies, 2025 |
10.2 Zambia Antiperspirants and Deodorants Market Competitive Benchmarking, By Operating and Technical Parameters |
11 Company Profiles |
12 Recommendations |
13 Disclaimer |
Export potential assessment - trade Analytics for 2030
Export potential enables firms to identify high-growth global markets with greater confidence by combining advanced trade intelligence with a structured quantitative methodology. The framework analyzes emerging demand trends and country-level import patterns while integrating macroeconomic and trade datasets such as GDP and population forecasts, bilateral import–export flows, tariff structures, elasticity differentials between developed and developing economies, geographic distance, and import demand projections. Using weighted trade values from 2020–2024 as the base period to project country-to-country export potential for 2030, these inputs are operationalized through calculated drivers such as gravity model parameters, tariff impact factors, and projected GDP per-capita growth. Through an analysis of hidden potentials, demand hotspots, and market conditions that are most favorable to success, this method enables firms to focus on target countries, maximize returns, and global expansion with data, backed by accuracy.
By factoring in the projected importer demand gap that is currently unmet and could be potential opportunity, it identifies the potential for the Exporter (Country) among 190 countries, against the general trade analysis, which identifies the biggest importer or exporter.
To discover high-growth global markets and optimize your business strategy:
Click Here
Pricing
- Single User License$ 1,995
- Department License$ 2,400
- Site License$ 3,120
- Global License$ 3,795

Search
Thought Leadership and Analyst Meet


Our Clients
Latest Reports
- Syria Air Conditioner Market (2026-2032) | Outlook, Competition, Drivers, Trends, Demand, Competitive, Strategic Insights, Companies, Challenges, Strategy, Consumer Insights, Analysis, Opportunities, Growth, Size, Share, Industry, Revenue, Segments, Value, Segmentation, Supply, Forecast, Restraints,
- Philippines Polyhydroxybutyrate-co-Hydroxyvalerate Market (2026-2032) | Trends, Insights, Challenges, Restraints, Competition, Size, Value, Forecast, Pricing, Share, Outlook, Revenue, Investment Opportunities, Strategy, Drivers, Demand, Growth, segmentation, Analysis, Companies
- Peru Polyhydroxybutyrate-co-Hydroxyvalerate Market (2026-2032) | Growth, Demand, Challenges, Share, Trends, Analysis, Pricing, Investment Opportunities, Drivers, Value, Forecast, Competition, Size, Companies, Insights, Outlook, Restraints, segmentation, Revenue, Strategy
- Pakistan Polyhydroxybutyrate-co-Hydroxyvalerate Market (2026-2032) | Restraints, segmentation, Pricing, Forecast, Share, Strategy, Competition, Trends, Insights, Drivers, Challenges, Growth, Revenue, Outlook, Value, Investment Opportunities, Companies, Size, Analysis, Demand
- Oman Polyhydroxybutyrate-co-Hydroxyvalerate Market (2026-2032) | Drivers, segmentation, Insights, Competition, Pricing, Outlook, Size, Revenue, Challenges, Forecast, Analysis, Growth, Value, Share, Trends, Investment Opportunities, Strategy, Restraints, Companies, Demand
- Nigeria Polyhydroxybutyrate-co-Hydroxyvalerate Market (2026-2032) | Value, Investment Opportunities, Analysis, Revenue, Restraints, Pricing, Outlook, Competition, Demand, Growth, Forecast, Companies, Trends, Challenges, segmentation, Drivers, Insights, Share, Size, Strategy
- Nepal Polyhydroxybutyrate-co-Hydroxyvalerate Market (2026-2032) | Insights, Analysis, Drivers, Share, Revenue, Demand, segmentation, Investment Opportunities, Competition, Forecast, Growth, Pricing, Companies, Strategy, Trends, Restraints, Challenges, Outlook, Size, Value
- Myanmar Polyhydroxybutyrate-co-Hydroxyvalerate Market (2026-2032) | Outlook, Revenue, Strategy, Restraints, Drivers, segmentation, Share, Forecast, Competition, Insights, Growth, Pricing, Size, Demand, Value, Companies, Trends, Challenges, Investment Opportunities, Analysis
- Morocco Polyhydroxybutyrate-co-Hydroxyvalerate Market (2026-2032) | Outlook, Investment Opportunities, Restraints, Strategy, Forecast, Challenges, Drivers, Growth, Companies, segmentation, Trends, Size, Competition, Revenue, Demand, Insights, Share, Analysis, Value, Pricing
- Mexico Polyhydroxybutyrate-co-Hydroxyvalerate Market (2026-2032) | Size, Drivers, Outlook, Share, Strategy, Growth, Pricing, Challenges, Companies, Demand, Value, Investment Opportunities, Restraints, Trends, Forecast, segmentation, Analysis, Insights, Competition, Revenue
Industry Events and Analyst Meet

HIMTEX 2026

India Refining Summit 2026

India EV Show 2026

EV tech India Expo 2026

Auto Tech Asia 2026
Whitepaper
- Middle East & Africa Commercial Security Market Click here to view more.
- Middle East & Africa Fire Safety Systems & Equipment Market Click here to view more.
- GCC Drone Market Click here to view more.
- Middle East Lighting Fixture Market Click here to view more.
- GCC Physical & Perimeter Security Market Click here to view more.
6WResearch In News
- Doha a strategic location for EV manufacturing hub: IPA Qatar
- Demand for luxury TVs surging in the GCC, says Samsung
- Empowering Growth: The Thriving Journey of Bangladesh’s Cable Industry
- Demand for luxury TVs surging in the GCC, says Samsung
- Video call with a traditional healer? Once unthinkable, it’s now common in South Africa
- Intelligent Buildings To Smooth GCC’s Path To Net Zero