Zambia Calculators Market (2026-2032) | Outlook, Revenue, Companies, Analysis, Value, Size, Forecast, Trends, Growth, Share, Segmentation & Industry
Market Forecast By Product Type (Basic, Financial, Graphing, Printing, Scientific, Others), By Application (Individual, Schools, Colleges, Business, Corporate, Others), By Distribution Channel (Hypermarkets, Stationery, Specialty Stores, Online Retail, Others) And Competitive Landscape
| Product Code: ETC5170233 | Publication Date: Nov 2023 | Updated Date: Apr 2026 | Product Type: Market Research Report | |
| Publisher: 6Wresearch | Author: Shubham Padhi | No. of Pages: 60 | No. of Figures: 30 | No. of Tables: 5 |
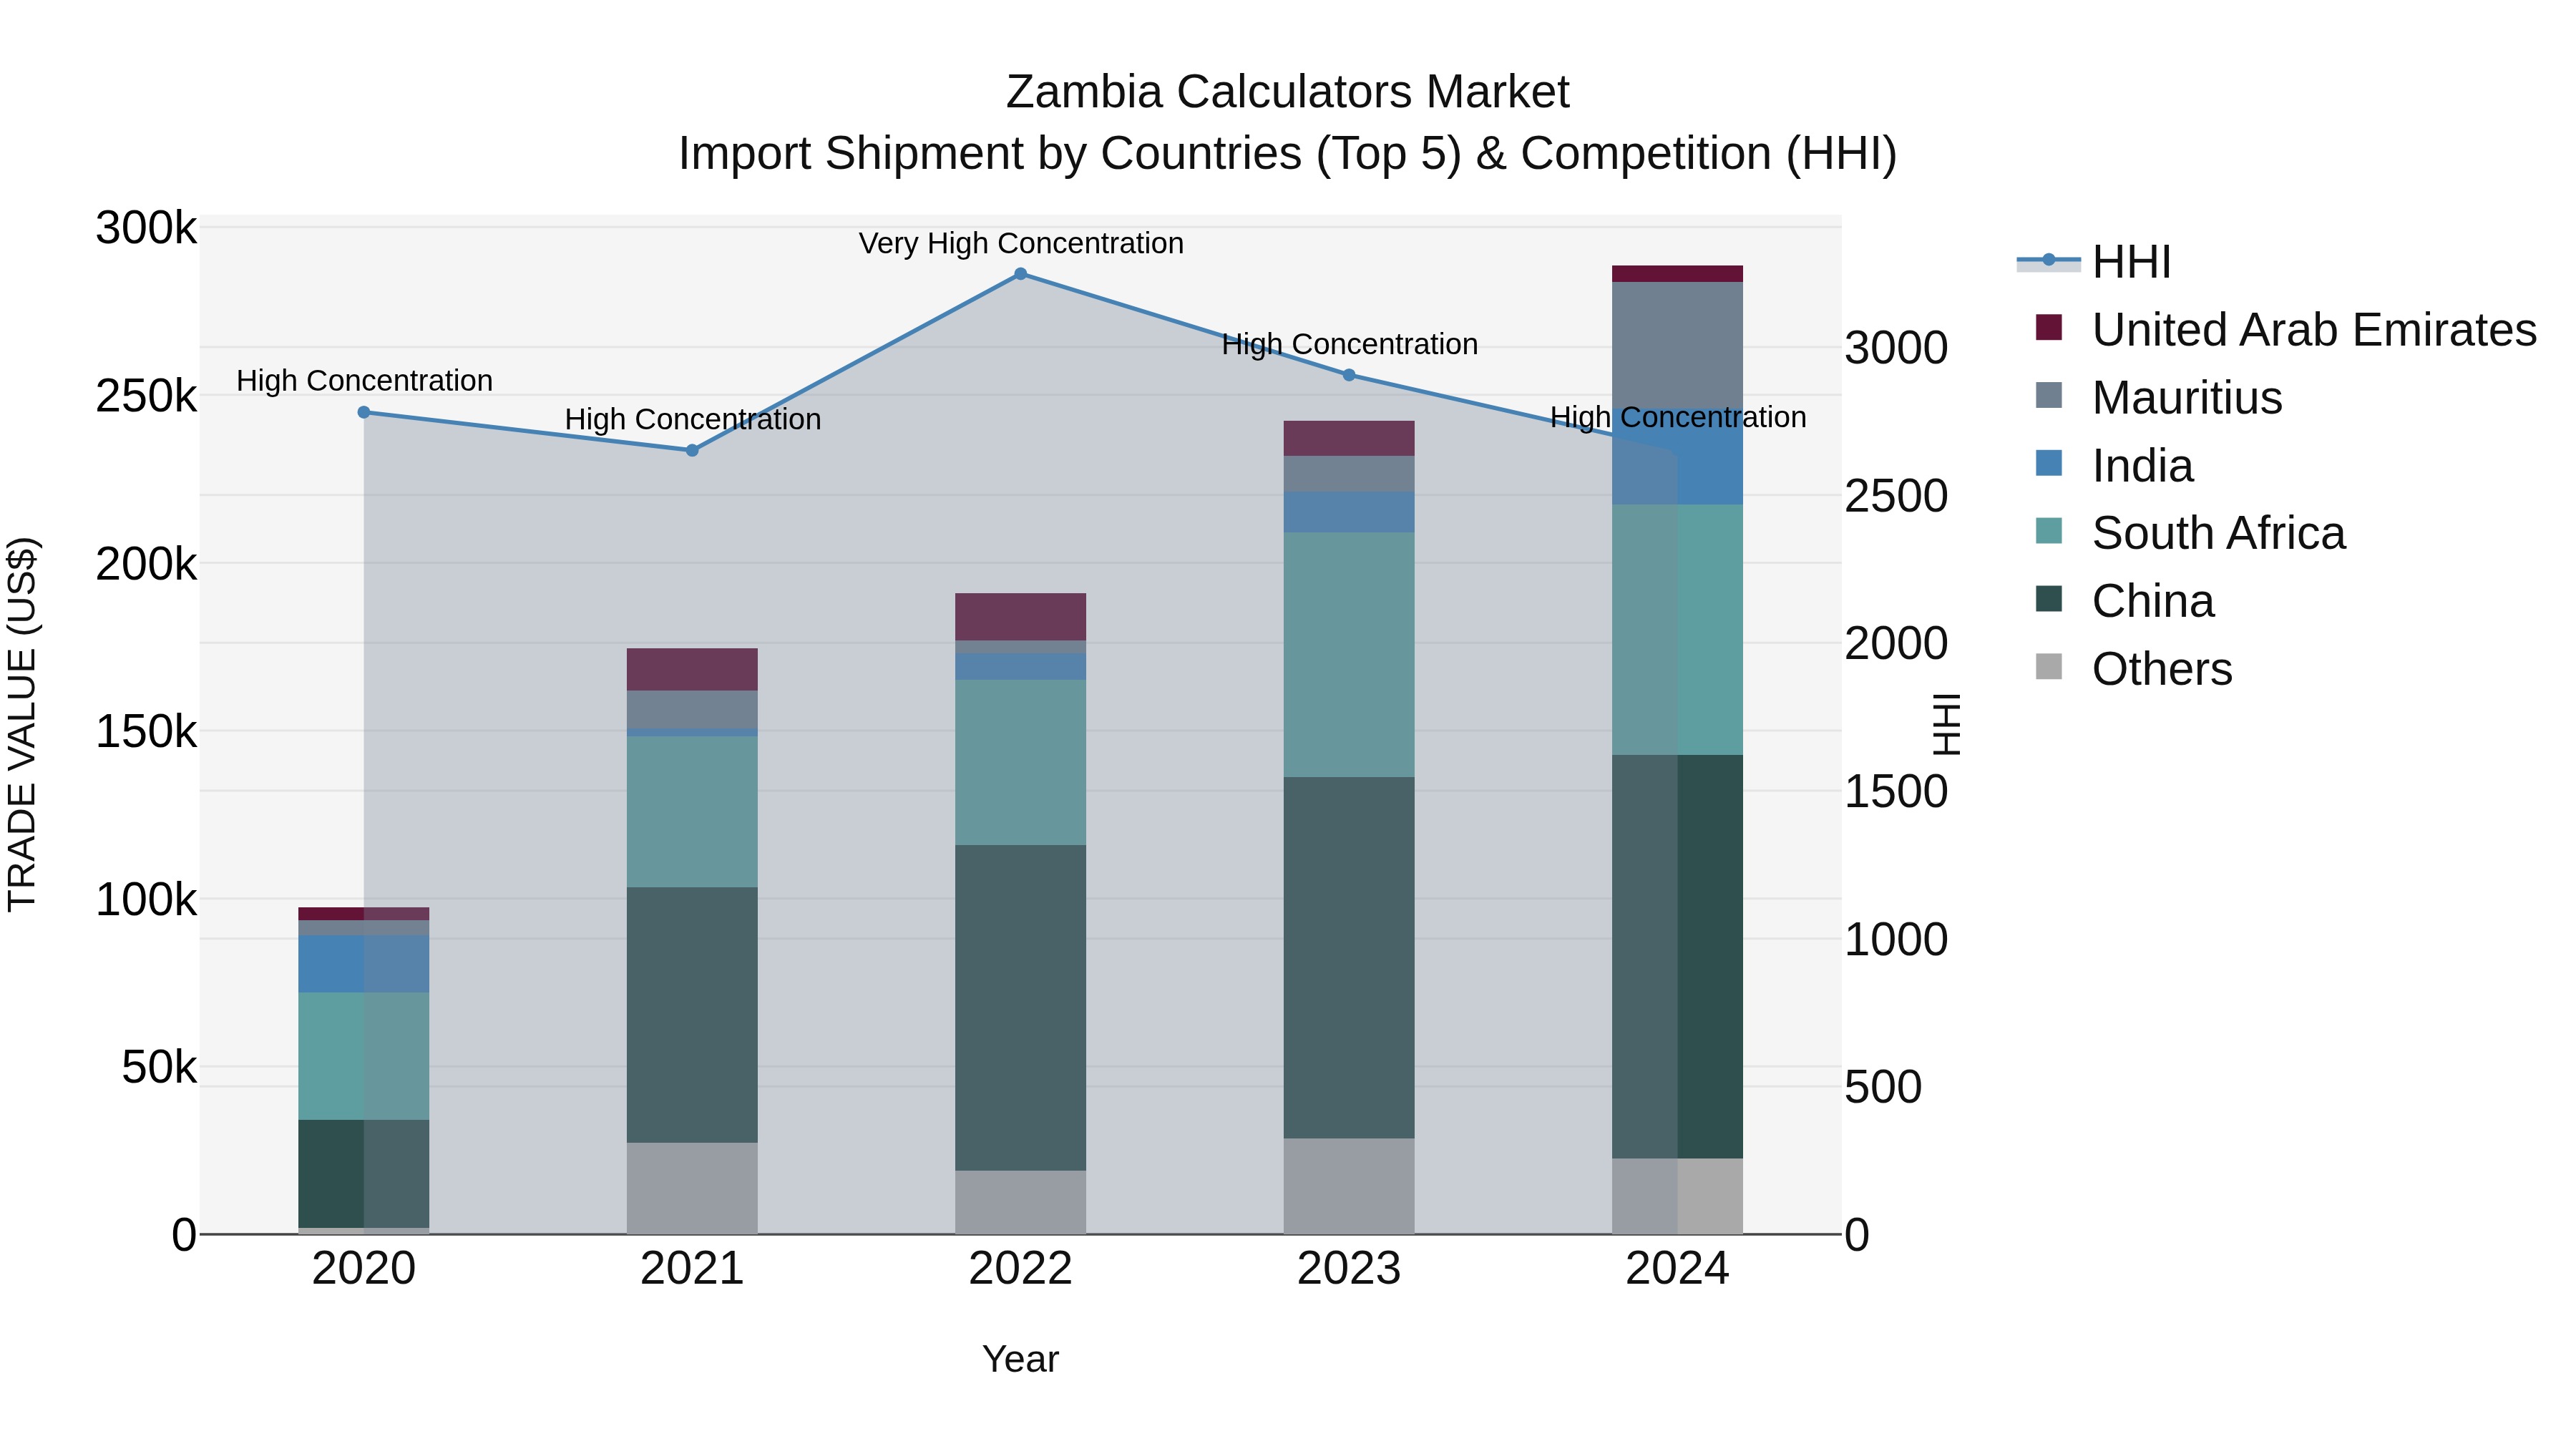
Zambia Calculators Market: Top 5 Importing Countries and Market Competition (HHI) Analysis
Zambia`s calculator import market continued to see notable growth in 2024, with top exporting countries including China, South Africa, Mauritius, India, and Hong Kong. The high Herfindahl-Hirschman Index (HHI) indicates a concentrated market, suggesting strong competition among these exporters. The impressive compound annual growth rate (CAGR) of 31.18% from 2020 to 2024 reflects increasing demand for calculators in Zambia. Furthermore, the growth rate of 19.1% in 2024 highlights the resilience and potential for further expansion in the market.
Key Highlights of the Report:
- Zambia Calculators Market Outlook
- Market Size of Zambia Calculators Market, 2025
- Forecast of Zambia Calculators Market, 2032
- Historical Data and Forecast of Zambia Calculators Revenues & Volume for the Period 2022 - 2032F
- Zambia Calculators Market Trend Evolution
- Zambia Calculators Market Drivers and Challenges
- Zambia Calculators Price Trends
- Zambia Calculators Porter`s Five Forces
- Zambia Calculators Industry Life Cycle
- Historical Data and Forecast of Zambia Calculators Market Revenues & Volume By Product Type for the Period 2022 - 2032F
- Historical Data and Forecast of Zambia Calculators Market Revenues & Volume By Basic for the Period 2022 - 2032F
- Historical Data and Forecast of Zambia Calculators Market Revenues & Volume By Financial for the Period 2022 - 2032F
- Historical Data and Forecast of Zambia Calculators Market Revenues & Volume By Graphing for the Period 2022 - 2032F
- Historical Data and Forecast of Zambia Calculators Market Revenues & Volume By Printing for the Period 2022 - 2032F
- Historical Data and Forecast of Zambia Calculators Market Revenues & Volume By Scientific for the Period 2022 - 2032F
- Historical Data and Forecast of Zambia Calculators Market Revenues & Volume By Others for the Period 2022 - 2032F
- Historical Data and Forecast of Zambia Calculators Market Revenues & Volume By Application for the Period 2022 - 2032F
- Historical Data and Forecast of Zambia Calculators Market Revenues & Volume By Individual for the Period 2022 - 2032F
- Historical Data and Forecast of Zambia Calculators Market Revenues & Volume By Schools for the Period 2022 - 2032F
- Historical Data and Forecast of Zambia Calculators Market Revenues & Volume By Colleges for the Period 2022 - 2032F
- Historical Data and Forecast of Zambia Calculators Market Revenues & Volume By Business for the Period 2022 - 2032F
- Historical Data and Forecast of Zambia Calculators Market Revenues & Volume By Corporate for the Period 2022 - 2032F
- Historical Data and Forecast of Zambia Calculators Market Revenues & Volume By Others for the Period 2022 - 2032F
- Historical Data and Forecast of Zambia Calculators Market Revenues & Volume By Distribution Channel for the Period 2022 - 2032F
- Historical Data and Forecast of Zambia Calculators Market Revenues & Volume By Hypermarkets for the Period 2022 - 2032F
- Historical Data and Forecast of Zambia Calculators Market Revenues & Volume By Stationery for the Period 2022 - 2032F
- Historical Data and Forecast of Zambia Calculators Market Revenues & Volume By Specialty Stores for the Period 2022 - 2032F
- Historical Data and Forecast of Zambia Calculators Market Revenues & Volume By Online Retail for the Period 2022 - 2032F
- Historical Data and Forecast of Zambia Calculators Market Revenues & Volume By Others for the Period 2022 - 2032F
- Zambia Calculators Import Export Trade Statistics
- Market Opportunity Assessment By Product Type
- Market Opportunity Assessment By Application
- Market Opportunity Assessment By Distribution Channel
- Zambia Calculators Top Companies Market Share
- Zambia Calculators Competitive Benchmarking By Technical and Operational Parameters
- Zambia Calculators Company Profiles
- Zambia Calculators Key Strategic Recommendations
Frequently Asked Questions About the Market Study (FAQs):
6Wresearch actively monitors the Zambia Calculators Market and publishes its comprehensive annual report, highlighting emerging trends, growth drivers, revenue analysis, and forecast outlook. Our insights help businesses to make data-backed strategic decisions with ongoing market dynamics. Our analysts track relevent industries related to the Zambia Calculators Market, allowing our clients with actionable intelligence and reliable forecasts tailored to emerging regional needs.
Yes, we provide customisation as per your requirements. To learn more, feel free to contact us on sales@6wresearch.com
1 Executive Summary |
2 Introduction |
2.1 Key Highlights of the Report |
2.2 Report Description |
2.3 Market Scope & Segmentation |
2.4 Research Methodology |
2.5 Assumptions |
3 Zambia Calculators Market Overview |
3.1 Zambia Country Macro Economic Indicators |
3.2 Zambia Calculators Market Revenues & Volume, 2022 & 2032F |
3.3 Zambia Calculators Market - Industry Life Cycle |
3.4 Zambia Calculators Market - Porter's Five Forces |
3.5 Zambia Calculators Market Revenues & Volume Share, By Product Type, 2022 & 2032F |
3.6 Zambia Calculators Market Revenues & Volume Share, By Application, 2022 & 2032F |
3.7 Zambia Calculators Market Revenues & Volume Share, By Distribution Channel, 2022 & 2032F |
4 Zambia Calculators Market Dynamics |
4.1 Impact Analysis |
4.2 Market Drivers |
4.2.1 Increasing demand for calculators in educational institutions and businesses in Zambia. |
4.2.2 Technological advancements leading to the development of more sophisticated and efficient calculators. |
4.2.3 Growing emphasis on digitalization and automation in various sectors, driving the need for calculators. |
4.2.4 Government initiatives to promote education and digital literacy, boosting the calculator market. |
4.2.5 Rise in disposable income and improving standard of living in Zambia, increasing purchasing power for calculators. |
4.3 Market Restraints |
4.3.1 Competition from smartphones and tablets that offer built-in calculator applications. |
4.3.2 High import tariffs and taxes on electronic devices, affecting the affordability of calculators. |
4.3.3 Limited awareness about the benefits of using calculators in certain segments of the population. |
4.3.4 Economic fluctuations and currency devaluation impacting the pricing and demand for calculators in Zambia. |
4.3.5 Limited distribution channels and infrastructure challenges hindering market penetration. |
5 Zambia Calculators Market Trends |
6 Zambia Calculators Market Segmentations |
6.1 Zambia Calculators Market, By Product Type |
6.1.1 Overview and Analysis |
6.1.2 Zambia Calculators Market Revenues & Volume, By Basic, 2022 - 2032F |
6.1.3 Zambia Calculators Market Revenues & Volume, By Financial, 2022 - 2032F |
6.1.4 Zambia Calculators Market Revenues & Volume, By Graphing, 2022 - 2032F |
6.1.5 Zambia Calculators Market Revenues & Volume, By Printing, 2022 - 2032F |
6.1.6 Zambia Calculators Market Revenues & Volume, By Scientific, 2022 - 2032F |
6.1.7 Zambia Calculators Market Revenues & Volume, By Others, 2022 - 2032F |
6.2 Zambia Calculators Market, By Application |
6.2.1 Overview and Analysis |
6.2.2 Zambia Calculators Market Revenues & Volume, By Individual, 2022 - 2032F |
6.2.3 Zambia Calculators Market Revenues & Volume, By Schools, 2022 - 2032F |
6.2.4 Zambia Calculators Market Revenues & Volume, By Colleges, 2022 - 2032F |
6.2.5 Zambia Calculators Market Revenues & Volume, By Business, 2022 - 2032F |
6.2.6 Zambia Calculators Market Revenues & Volume, By Corporate, 2022 - 2032F |
6.2.7 Zambia Calculators Market Revenues & Volume, By Others, 2022 - 2032F |
6.3 Zambia Calculators Market, By Distribution Channel |
6.3.1 Overview and Analysis |
6.3.2 Zambia Calculators Market Revenues & Volume, By Hypermarkets, 2022 - 2032F |
6.3.3 Zambia Calculators Market Revenues & Volume, By Stationery, 2022 - 2032F |
6.3.4 Zambia Calculators Market Revenues & Volume, By Specialty Stores, 2022 - 2032F |
6.3.5 Zambia Calculators Market Revenues & Volume, By Online Retail, 2022 - 2032F |
6.3.6 Zambia Calculators Market Revenues & Volume, By Others, 2022 - 2032F |
7 Zambia Calculators Market Import-Export Trade Statistics |
7.1 Zambia Calculators Market Export to Major Countries |
7.2 Zambia Calculators Market Imports from Major Countries |
8 Zambia Calculators Market Key Performance Indicators |
8.1 Adoption rate of advanced calculator models in educational institutions and businesses. |
8.2 Number of partnerships and collaborations with technology companies for calculator innovation. |
8.3 Percentage of population with access to calculators for educational and professional use. |
8.4 Average selling price (ASP) trends of calculators in Zambia. |
8.5 Rate of growth in the usage of calculators for specialized applications (e.g., scientific, financial). |
9 Zambia Calculators Market - Opportunity Assessment |
9.1 Zambia Calculators Market Opportunity Assessment, By Product Type, 2022 & 2032F |
9.2 Zambia Calculators Market Opportunity Assessment, By Application, 2022 & 2032F |
9.3 Zambia Calculators Market Opportunity Assessment, By Distribution Channel, 2022 & 2032F |
10 Zambia Calculators Market - Competitive Landscape |
10.1 Zambia Calculators Market Revenue Share, By Companies, 2025 |
10.2 Zambia Calculators Market Competitive Benchmarking, By Operating and Technical Parameters |
11 Company Profiles |
12 Recommendations | 13 Disclaimer |
Global Go To Market Strategy - 2030
Export potential enables firms to identify high-growth global markets with greater confidence by combining advanced trade intelligence with a structured quantitative methodology. The framework analyzes emerging demand trends and country-level import patterns while integrating macroeconomic and trade datasets such as GDP and population forecasts, bilateral import–export flows, tariff structures, elasticity differentials between developed and developing economies, geographic distance, and import demand projections. Using weighted trade values from 2020–2024 as the base period to project country-to-country export potential for 2030, these inputs are operationalized through calculated drivers such as gravity model parameters, tariff impact factors, and projected GDP per-capita growth. Through an analysis of hidden potentials, demand hotspots, and market conditions that are most favorable to success, this method enables firms to focus on target countries, maximize returns, and global expansion with data, backed by accuracy.
By factoring in the projected importer demand gap that is currently unmet and could be potential opportunity, it identifies the potential for the Exporter (Country) among 190 countries, against the general trade analysis, which identifies the biggest importer or exporter.
To discover high-growth global markets and optimize your business strategy:
Click Here
Pricing
- Single User License$ 1,995
- Department License$ 2,400
- Site License$ 3,120
- Global License$ 3,795

Leadership Perspectives from Industry Events
Search
Thought Leadership and Analyst Meet


Our Clients
6WResearch In News
- Doha a strategic location for EV manufacturing hub: IPA Qatar
- Demand for luxury TVs surging in the GCC, says Samsung
- Empowering Growth: The Thriving Journey of Bangladesh’s Cable Industry
- Demand for luxury TVs surging in the GCC, says Samsung
- Video call with a traditional healer? Once unthinkable, it’s now common in South Africa
- Intelligent Buildings To Smooth GCC’s Path To Net Zero
Latest Reports
- New Zealand Aseptic Manufacturing Market (2026-2032)
- Netherlands Aseptic Manufacturing Market (2026-2032)
- Nauru Aseptic Manufacturing Market (2026-2032)
- Namibia Aseptic Manufacturing Market (2026-2032)
- Mozambique Aseptic Manufacturing Market (2026-2032)
- Montenegro Aseptic Manufacturing Market (2026-2032)
- Mongolia Aseptic Manufacturing Market (2026-2032)
- Monaco Aseptic Manufacturing Market (2026-2032)
- Micronesia Aseptic Manufacturing Market (2026-2032)
- Mauritius Aseptic Manufacturing Market (2026-2032)
Industry Events and Analyst Meet

HIMTEX 2026

India Refining Summit 2026

India EV Show 2026

EV tech India Expo 2026

Auto Tech Asia 2026
Whitepaper
- Middle East & Africa Commercial Security Market Click here to view more.
- Middle East & Africa Fire Safety Systems & Equipment Market Click here to view more.
- GCC Drone Market Click here to view more.
- Middle East Lighting Fixture Market Click here to view more.
- GCC Physical & Perimeter Security Market Click here to view more.