Zambia Packaged Vegan Foods Market (2026-2032) | Companies, Revenue, Growth, Pricing Analysis, Challenges, Drivers, Trends, Opportunities, Competitive, Restraints, Analysis, Investment Trends, Value, Strategic Insights, Segments, Size, Strategy, Consumer Insights, Segmentation, Outlook, Industry, Demand, Supply, Forecast, Share, Competition
Market Forecast By Type (Vegan Meat, Dairy-Free Cheese, Plant-Based Snacks, Vegan Ready Meals), By Ingredients Used (Soy Protein, Almond Milk, Coconut Oil, Tofu), By Packaging Type (Boxes, Pouches, Plastic Bags, Cans), By Distribution Channel (Supermarkets, Online Retail, Convenience Stores, Specialty Stores) And Competitive Landscape
| Product Code: ETC13053562 | Publication Date: Apr 2025 | Updated Date: Apr 2026 | Product Type: Market Research Report | |
| Publisher: 6Wresearch | Author: Sachin Kumar Rai | No. of Pages: 65 | No. of Figures: 34 | No. of Tables: 19 |
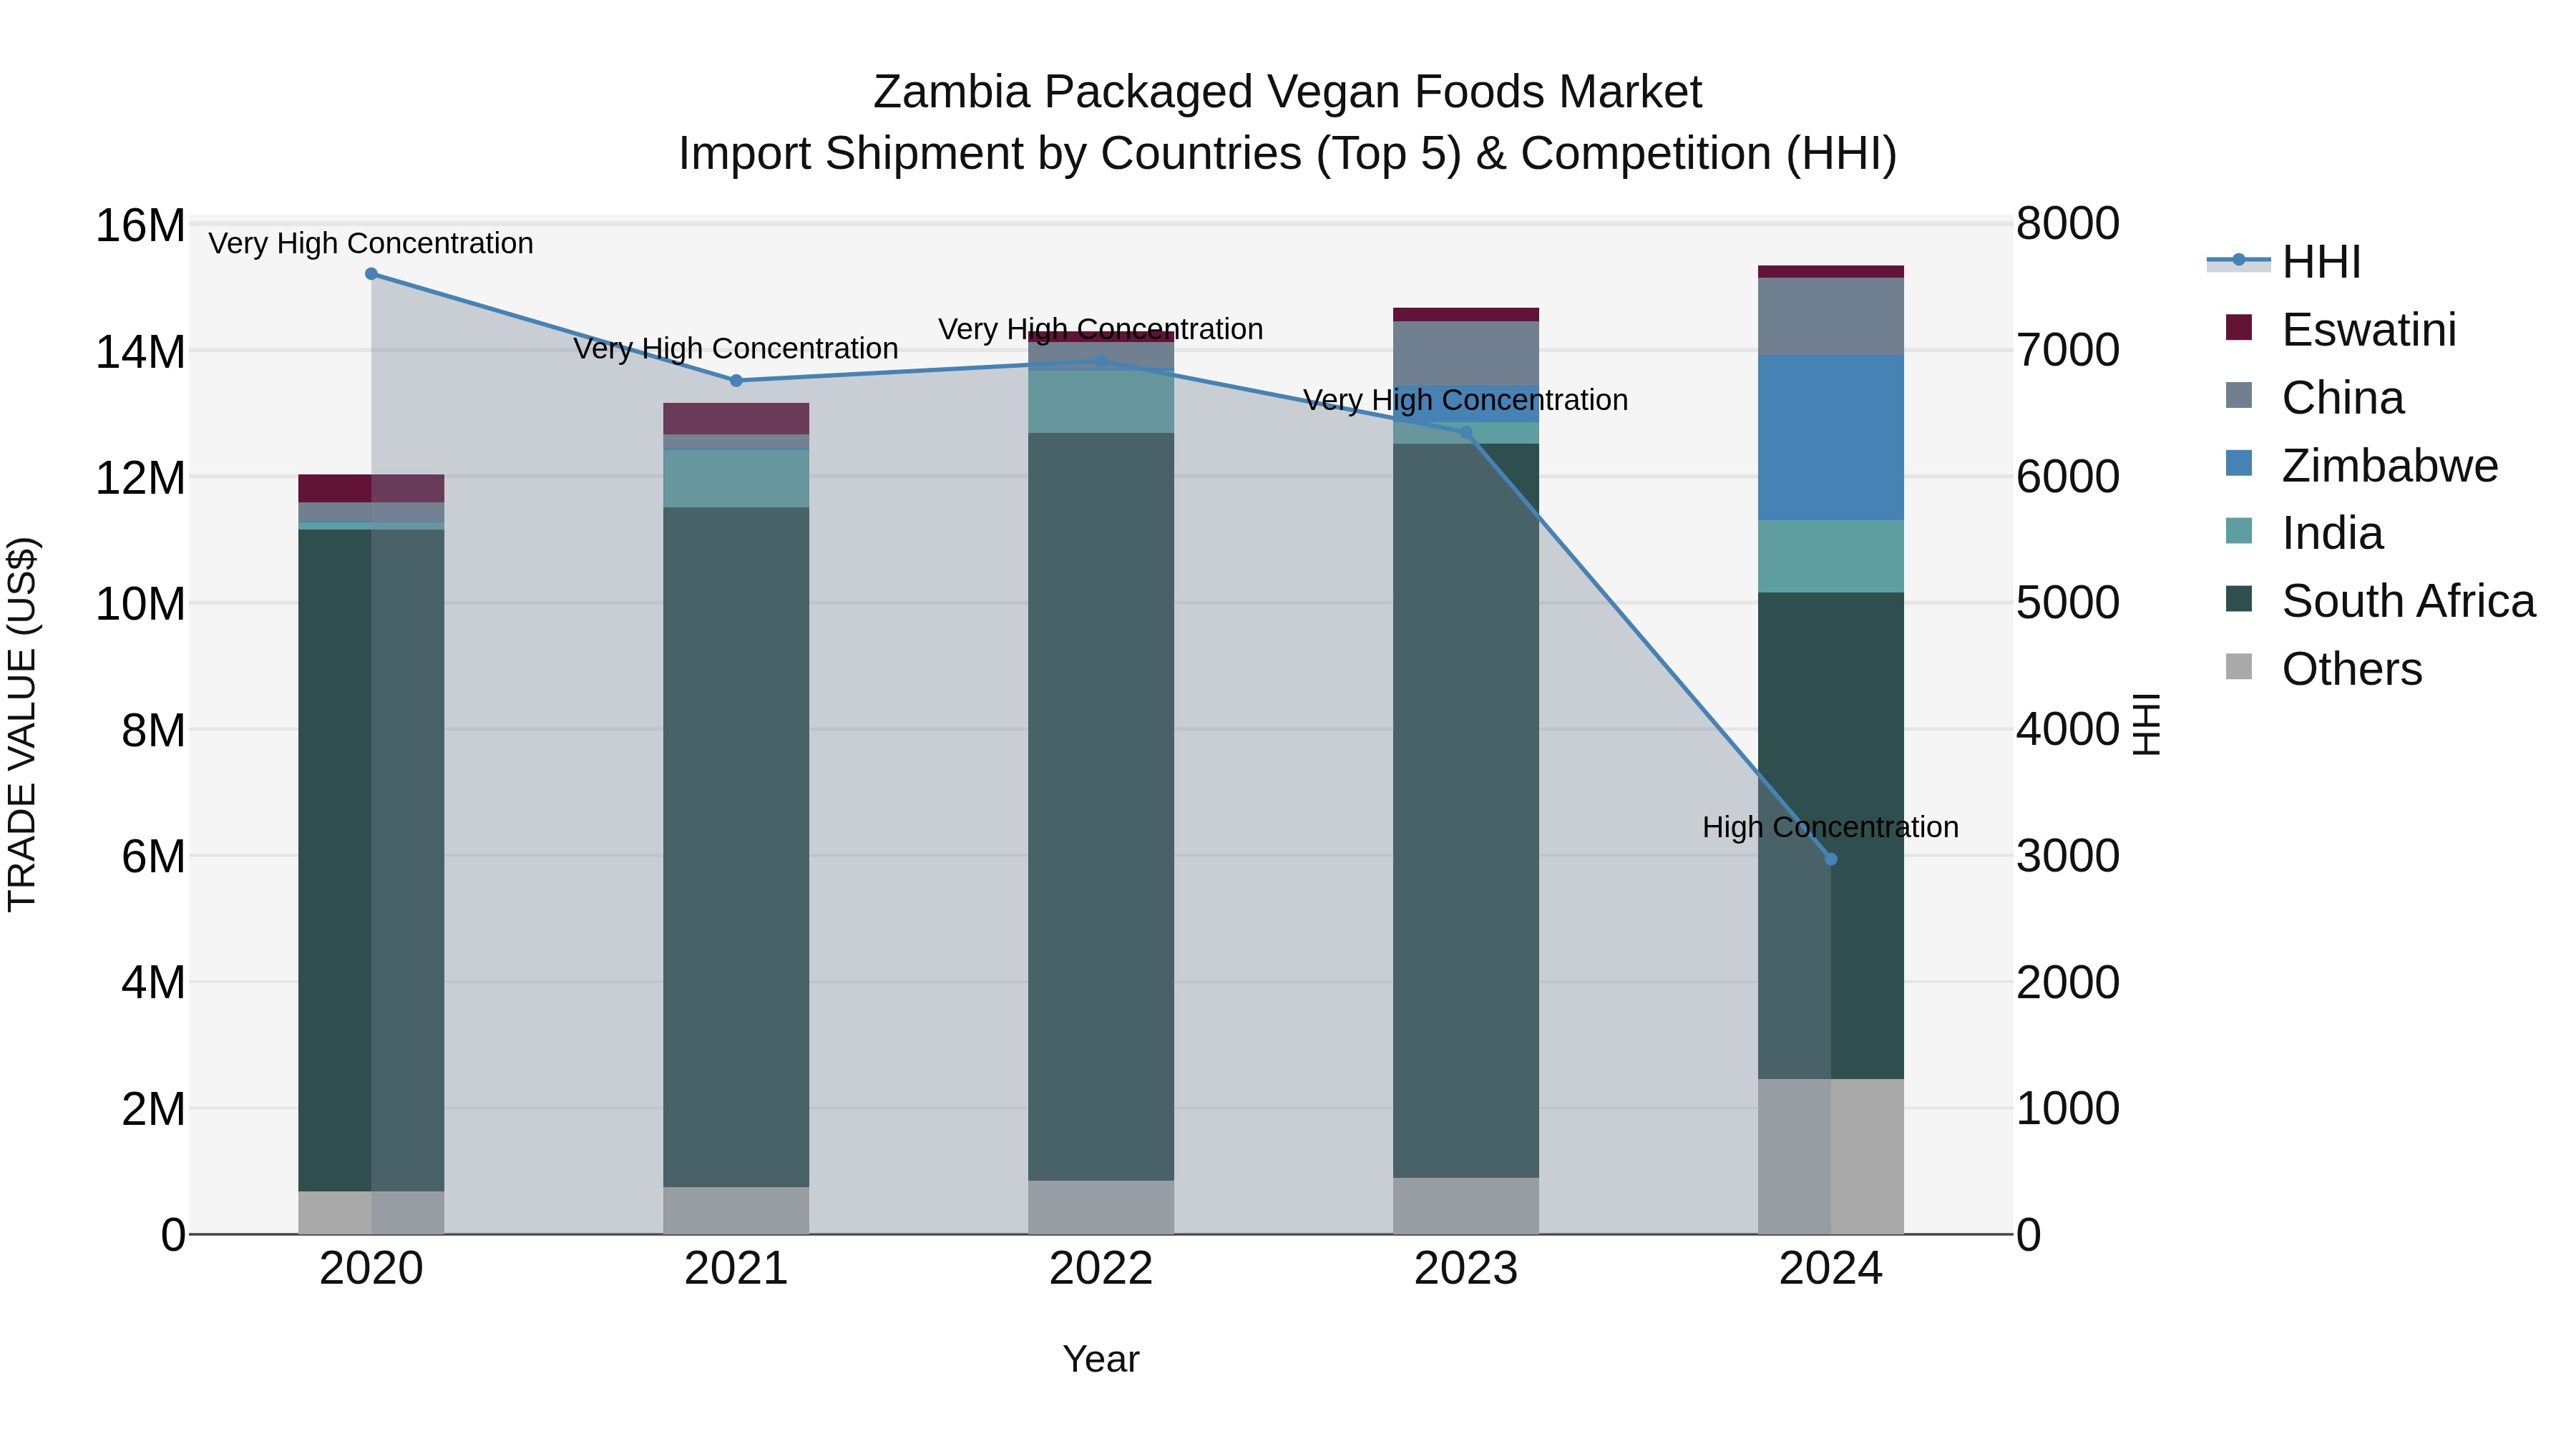
Zambia Packaged Vegan Foods Market: Top 5 Importing Countries and Market Competition (HHI) Analysis
The packaged vegan foods import market in Zambia continues to see strong growth, with top exporting countries including South Africa, Zimbabwe, China, India, and Denmark. Despite a high concentration level in 2023, the market remained competitive in 2024, indicating opportunities for new players to enter. The impressive Compound Annual Growth Rate (CAGR) of 6.25% from 2020 to 2024 demonstrates sustained demand for vegan products in Zambia. The growth rate of 4.53% from 2023 to 2024 highlights a steady expansion of the market, making it an attractive sector for investors and businesses looking to tap into the rising popularity of vegan foods.
Key Highlights of the Report:
- Zambia Packaged Vegan Foods Market Outlook
- Market Size of Zambia Packaged Vegan Foods Market, 2025
- Forecast of Zambia Packaged Vegan Foods Market, 2032
- Historical Data and Forecast of Zambia Packaged Vegan Foods Revenues & Volume for the Period 2022 - 2032F
- Zambia Packaged Vegan Foods Market Trend Evolution
- Zambia Packaged Vegan Foods Market Drivers and Challenges
- Zambia Packaged Vegan Foods Price Trends
- Zambia Packaged Vegan Foods Porter's Five Forces
- Zambia Packaged Vegan Foods Industry Life Cycle
- Historical Data and Forecast of Zambia Packaged Vegan Foods Market Revenues & Volume By Type for the Period 2022 - 2032F
- Historical Data and Forecast of Zambia Packaged Vegan Foods Market Revenues & Volume By Vegan Meat for the Period 2022 - 2032F
- Historical Data and Forecast of Zambia Packaged Vegan Foods Market Revenues & Volume By Dairy-Free Cheese for the Period 2022 - 2032F
- Historical Data and Forecast of Zambia Packaged Vegan Foods Market Revenues & Volume By Plant-Based Snacks for the Period 2022 - 2032F
- Historical Data and Forecast of Zambia Packaged Vegan Foods Market Revenues & Volume By Vegan Ready Meals for the Period 2022 - 2032F
- Historical Data and Forecast of Zambia Packaged Vegan Foods Market Revenues & Volume By Ingredients Used for the Period 2022 - 2032F
- Historical Data and Forecast of Zambia Packaged Vegan Foods Market Revenues & Volume By Soy Protein for the Period 2022 - 2032F
- Historical Data and Forecast of Zambia Packaged Vegan Foods Market Revenues & Volume By Almond Milk for the Period 2022 - 2032F
- Historical Data and Forecast of Zambia Packaged Vegan Foods Market Revenues & Volume By Coconut Oil for the Period 2022 - 2032F
- Historical Data and Forecast of Zambia Packaged Vegan Foods Market Revenues & Volume By Tofu for the Period 2022 - 2032F
- Historical Data and Forecast of Zambia Packaged Vegan Foods Market Revenues & Volume By Packaging Type for the Period 2022 - 2032F
- Historical Data and Forecast of Zambia Packaged Vegan Foods Market Revenues & Volume By Boxes for the Period 2022 - 2032F
- Historical Data and Forecast of Zambia Packaged Vegan Foods Market Revenues & Volume By Pouches for the Period 2022 - 2032F
- Historical Data and Forecast of Zambia Packaged Vegan Foods Market Revenues & Volume By Plastic Bags for the Period 2022 - 2032F
- Historical Data and Forecast of Zambia Packaged Vegan Foods Market Revenues & Volume By Cans for the Period 2022 - 2032F
- Historical Data and Forecast of Zambia Packaged Vegan Foods Market Revenues & Volume By Distribution Channel for the Period 2022 - 2032F
- Historical Data and Forecast of Zambia Packaged Vegan Foods Market Revenues & Volume By Supermarkets for the Period 2022 - 2032F
- Historical Data and Forecast of Zambia Packaged Vegan Foods Market Revenues & Volume By Online Retail for the Period 2022 - 2032F
- Historical Data and Forecast of Zambia Packaged Vegan Foods Market Revenues & Volume By Convenience Stores for the Period 2022 - 2032F
- Historical Data and Forecast of Zambia Packaged Vegan Foods Market Revenues & Volume By Specialty Stores for the Period 2022 - 2032F
- Zambia Packaged Vegan Foods Import Export Trade Statistics
- Market Opportunity Assessment By Type
- Market Opportunity Assessment By Ingredients Used
- Market Opportunity Assessment By Packaging Type
- Market Opportunity Assessment By Distribution Channel
- Zambia Packaged Vegan Foods Top Companies Market Share
- Zambia Packaged Vegan Foods Competitive Benchmarking By Technical and Operational Parameters
- Zambia Packaged Vegan Foods Company Profiles
- Zambia Packaged Vegan Foods Key Strategic Recommendations
Frequently Asked Questions About the Market Study (FAQs):
6Wresearch actively monitors the Zambia Packaged Vegan Foods Market and publishes its comprehensive annual report, highlighting emerging trends, growth drivers, revenue analysis, and forecast outlook. Our insights help businesses to make data-backed strategic decisions with ongoing market dynamics. Our analysts track relevent industries related to the Zambia Packaged Vegan Foods Market, allowing our clients with actionable intelligence and reliable forecasts tailored to emerging regional needs.
Yes, we provide customisation as per your requirements. To learn more, feel free to contact us on sales@6wresearch.com
1 Executive Summary |
2 Introduction |
2.1 Key Highlights of the Report |
2.2 Report Description |
2.3 Market Scope & Segmentation |
2.4 Research Methodology |
2.5 Assumptions |
3 Zambia Packaged Vegan Foods Market Overview |
3.1 Zambia Country Macro Economic Indicators |
3.2 Zambia Packaged Vegan Foods Market Revenues & Volume, 2022 & 2032F |
3.3 Zambia Packaged Vegan Foods Market - Industry Life Cycle |
3.4 Zambia Packaged Vegan Foods Market - Porter's Five Forces |
3.5 Zambia Packaged Vegan Foods Market Revenues & Volume Share, By Type, 2022 & 2032F |
3.6 Zambia Packaged Vegan Foods Market Revenues & Volume Share, By Ingredients Used, 2022 & 2032F |
3.7 Zambia Packaged Vegan Foods Market Revenues & Volume Share, By Packaging Type, 2022 & 2032F |
3.8 Zambia Packaged Vegan Foods Market Revenues & Volume Share, By Distribution Channel, 2022 & 2032F |
4 Zambia Packaged Vegan Foods Market Dynamics |
4.1 Impact Analysis |
4.2 Market Drivers |
4.2.1 Increasing awareness about health and wellness leading to a growing demand for vegan foods. |
4.2.2 Rise in the number of health-conscious consumers opting for plant-based diets. |
4.2.3 Government initiatives promoting sustainable agriculture and plant-based nutrition. |
4.3 Market Restraints |
4.3.1 Limited availability and variety of packaged vegan food products in the market. |
4.3.2 High production costs leading to higher prices for packaged vegan foods. |
4.3.3 Lack of infrastructure for distribution and marketing of packaged vegan foods. |
5 Zambia Packaged Vegan Foods Market Trends |
6 Zambia Packaged Vegan Foods Market, By Types |
6.1 Zambia Packaged Vegan Foods Market, By Type |
6.1.1 Overview and Analysis |
6.1.2 Zambia Packaged Vegan Foods Market Revenues & Volume, By Type, 2022 - 2032F |
6.1.3 Zambia Packaged Vegan Foods Market Revenues & Volume, By Vegan Meat, 2022 - 2032F |
6.1.4 Zambia Packaged Vegan Foods Market Revenues & Volume, By Dairy-Free Cheese, 2022 - 2032F |
6.1.5 Zambia Packaged Vegan Foods Market Revenues & Volume, By Plant-Based Snacks, 2022 - 2032F |
6.1.6 Zambia Packaged Vegan Foods Market Revenues & Volume, By Vegan Ready Meals, 2022 - 2032F |
6.2 Zambia Packaged Vegan Foods Market, By Ingredients Used |
6.2.1 Overview and Analysis |
6.2.2 Zambia Packaged Vegan Foods Market Revenues & Volume, By Soy Protein, 2022 - 2032F |
6.2.3 Zambia Packaged Vegan Foods Market Revenues & Volume, By Almond Milk, 2022 - 2032F |
6.2.4 Zambia Packaged Vegan Foods Market Revenues & Volume, By Coconut Oil, 2022 - 2032F |
6.2.5 Zambia Packaged Vegan Foods Market Revenues & Volume, By Tofu, 2022 - 2032F |
6.3 Zambia Packaged Vegan Foods Market, By Packaging Type |
6.3.1 Overview and Analysis |
6.3.2 Zambia Packaged Vegan Foods Market Revenues & Volume, By Boxes, 2022 - 2032F |
6.3.3 Zambia Packaged Vegan Foods Market Revenues & Volume, By Pouches, 2022 - 2032F |
6.3.4 Zambia Packaged Vegan Foods Market Revenues & Volume, By Plastic Bags, 2022 - 2032F |
6.3.5 Zambia Packaged Vegan Foods Market Revenues & Volume, By Cans, 2022 - 2032F |
6.4 Zambia Packaged Vegan Foods Market, By Distribution Channel |
6.4.1 Overview and Analysis |
6.4.2 Zambia Packaged Vegan Foods Market Revenues & Volume, By Supermarkets, 2022 - 2032F |
6.4.3 Zambia Packaged Vegan Foods Market Revenues & Volume, By Online Retail, 2022 - 2032F |
6.4.4 Zambia Packaged Vegan Foods Market Revenues & Volume, By Convenience Stores, 2022 - 2032F |
6.4.5 Zambia Packaged Vegan Foods Market Revenues & Volume, By Specialty Stores, 2022 - 2032F |
7 Zambia Packaged Vegan Foods Market Import-Export Trade Statistics |
7.1 Zambia Packaged Vegan Foods Market Export to Major Countries |
7.2 Zambia Packaged Vegan Foods Market Imports from Major Countries |
8 Zambia Packaged Vegan Foods Market Key Performance Indicators |
8.1 Number of new vegan food product launches in the market. |
8.2 Growth in the number of vegan food retailers and distribution channels. |
8.3 Consumer engagement and feedback on social media platforms regarding packaged vegan foods. |
9 Zambia Packaged Vegan Foods Market - Opportunity Assessment |
9.1 Zambia Packaged Vegan Foods Market Opportunity Assessment, By Type, 2022 & 2032F |
9.2 Zambia Packaged Vegan Foods Market Opportunity Assessment, By Ingredients Used, 2022 & 2032F |
9.3 Zambia Packaged Vegan Foods Market Opportunity Assessment, By Packaging Type, 2022 & 2032F |
9.4 Zambia Packaged Vegan Foods Market Opportunity Assessment, By Distribution Channel, 2022 & 2032F |
10 Zambia Packaged Vegan Foods Market - Competitive Landscape |
10.1 Zambia Packaged Vegan Foods Market Revenue Share, By Companies, 2025 |
10.2 Zambia Packaged Vegan Foods Market Competitive Benchmarking, By Operating and Technical Parameters |
11 Company Profiles |
12 Recommendations |
13 Disclaimer |
Export potential assessment - trade Analytics for 2030
Export potential enables firms to identify high-growth global markets with greater confidence by combining advanced trade intelligence with a structured quantitative methodology. The framework analyzes emerging demand trends and country-level import patterns while integrating macroeconomic and trade datasets such as GDP and population forecasts, bilateral import–export flows, tariff structures, elasticity differentials between developed and developing economies, geographic distance, and import demand projections. Using weighted trade values from 2020–2024 as the base period to project country-to-country export potential for 2030, these inputs are operationalized through calculated drivers such as gravity model parameters, tariff impact factors, and projected GDP per-capita growth. Through an analysis of hidden potentials, demand hotspots, and market conditions that are most favorable to success, this method enables firms to focus on target countries, maximize returns, and global expansion with data, backed by accuracy.
By factoring in the projected importer demand gap that is currently unmet and could be potential opportunity, it identifies the potential for the Exporter (Country) among 190 countries, against the general trade analysis, which identifies the biggest importer or exporter.
To discover high-growth global markets and optimize your business strategy:
Click Here
Pricing
- Single User License$ 1,995
- Department License$ 2,400
- Site License$ 3,120
- Global License$ 3,795

Search
Thought Leadership and Analyst Meet


Our Clients
Latest Reports
- France Thermally Conductive Filler Dispersants Market (2026-2032) | Challenges, Restraints, Value, Share, Size, segmentation, Analysis, Trends, Investment Opportunities, Outlook, Pricing, Demand, Forecast, Revenue, Companies, Growth, Drivers, Strategy, Insights, Competition
- Egypt Thermally Conductive Filler Dispersants Market (2026-2032) | Competition, Forecast, Strategy, Value, Insights, Outlook, Investment Opportunities, Pricing, Demand, Share, segmentation, Drivers, Size, Companies, Restraints, Growth, Trends, Revenue, Challenges, Analysis
- Czech Republic Thermally Conductive Filler Dispersants Market (2026-2032) | Forecast, Pricing, Analysis, Drivers, Insights, Size, Demand, Growth, Challenges, segmentation, Competition, Outlook, Trends, Investment Opportunities, Companies, Strategy, Revenue, Share, Value, Restraints
- Colombia Thermally Conductive Filler Dispersants Market (2026-2032) | segmentation, Trends, Share, Drivers, Strategy, Companies, Demand, Insights, Size, Challenges, Value, Competition, Analysis, Growth, Revenue, Restraints, Forecast, Pricing, Outlook, Investment Opportunities
- China Thermally Conductive Filler Dispersants Market (2026-2032) | Restraints, Investment Opportunities, Pricing, Companies, Share, Size, Challenges, Trends, Outlook, Value, Analysis, Competition, Revenue, Drivers, Forecast, Demand, Insights, Growth, Strategy, segmentation
- Chile Thermally Conductive Filler Dispersants Market (2026-2032) | Investment Opportunities, Trends, Value, Restraints, Share, Companies, Forecast, segmentation, Pricing, Challenges, Demand, Size, Analysis, Drivers, Outlook, Growth, Competition, Strategy, Revenue, Insights
- Cambodia Thermally Conductive Filler Dispersants Market (2026-2032) | Analysis, Share, Outlook, Strategy, Pricing, Demand, Size, Growth, segmentation, Insights, Revenue, Forecast, Challenges, Competition, Companies, Investment Opportunities, Trends, Restraints, Value, Drivers
- Brazil Thermally Conductive Filler Dispersants Market (2026-2032) | Restraints, Forecast, Competition, Size, Revenue, Value, Investment Opportunities, Trends, Insights, Outlook, Growth, Analysis, Drivers, segmentation, Pricing, Challenges, Strategy, Share, Companies, Demand
- Bangladesh Thermally Conductive Filler Dispersants Market (2026-2032) | Restraints, Trends, Analysis, Competition, Insights, Forecast, Value, Investment Opportunities, Pricing, Share, Demand, Outlook, Revenue, segmentation, Companies, Drivers, Growth, Size, Challenges, Strategy
- Bahrain Thermally Conductive Filler Dispersants Market (2026-2032) | Trends, Outlook, Pricing, Demand, Value, Competition, Forecast, Growth, segmentation, Revenue, Companies, Analysis, Insights, Size, Drivers, Challenges, Strategy, Investment Opportunities, Share, Restraints
Industry Events and Analyst Meet

HIMTEX 2026

India Refining Summit 2026

India EV Show 2026

EV tech India Expo 2026

Auto Tech Asia 2026
Whitepaper
- Middle East & Africa Commercial Security Market Click here to view more.
- Middle East & Africa Fire Safety Systems & Equipment Market Click here to view more.
- GCC Drone Market Click here to view more.
- Middle East Lighting Fixture Market Click here to view more.
- GCC Physical & Perimeter Security Market Click here to view more.
6WResearch In News
- Doha a strategic location for EV manufacturing hub: IPA Qatar
- Demand for luxury TVs surging in the GCC, says Samsung
- Empowering Growth: The Thriving Journey of Bangladesh’s Cable Industry
- Demand for luxury TVs surging in the GCC, says Samsung
- Video call with a traditional healer? Once unthinkable, it’s now common in South Africa
- Intelligent Buildings To Smooth GCC’s Path To Net Zero