Zambia Plastic Wrap Market (2026-2032) | Growth, Outlook, Companies, Share, Competitive Landscape, Industry, Forecast, Size & Revenue, Analysis, Value, Segmentation, Trends
Market Forecast By Type (Stretch Films, Shrink Films, Metallized Films, Twist Film, Release Film, Twist Rope, Others), By Material (Polypropylene (PP), Polyethylene (PE), Polyvinyl Chloride (PVC), Polyethylene Terephthalate (PET), Ethylene Vinyl Alcohol Copolymer (EVOH), Ethylene-Vinyl Acetate (EVA), Nylon, Others), By Feature (Moisture Proof, Water Soluble), By Processing Type (Casting, Multiple Extrusion, Blow Molding, Injection Molding), By Transparency (Transparent, Translucent, Opaque), By End-User (Food and Beverages, Pharmaceuticals, Personal Care and Cosmetics, Chemical, Others), By Distribution Channel (E-commerce, Convenience Store, Retail Stores, Supermarket/Hypermarket, Others) And Competitive Landscape
| Product Code: ETC10125174 | Publication Date: Sep 2024 | Updated Date: Apr 2026 | Product Type: Market Research Report | |
| Publisher: 6Wresearch | Author: Summon Dutta | No. of Pages: 75 | No. of Figures: 35 | No. of Tables: 20 |
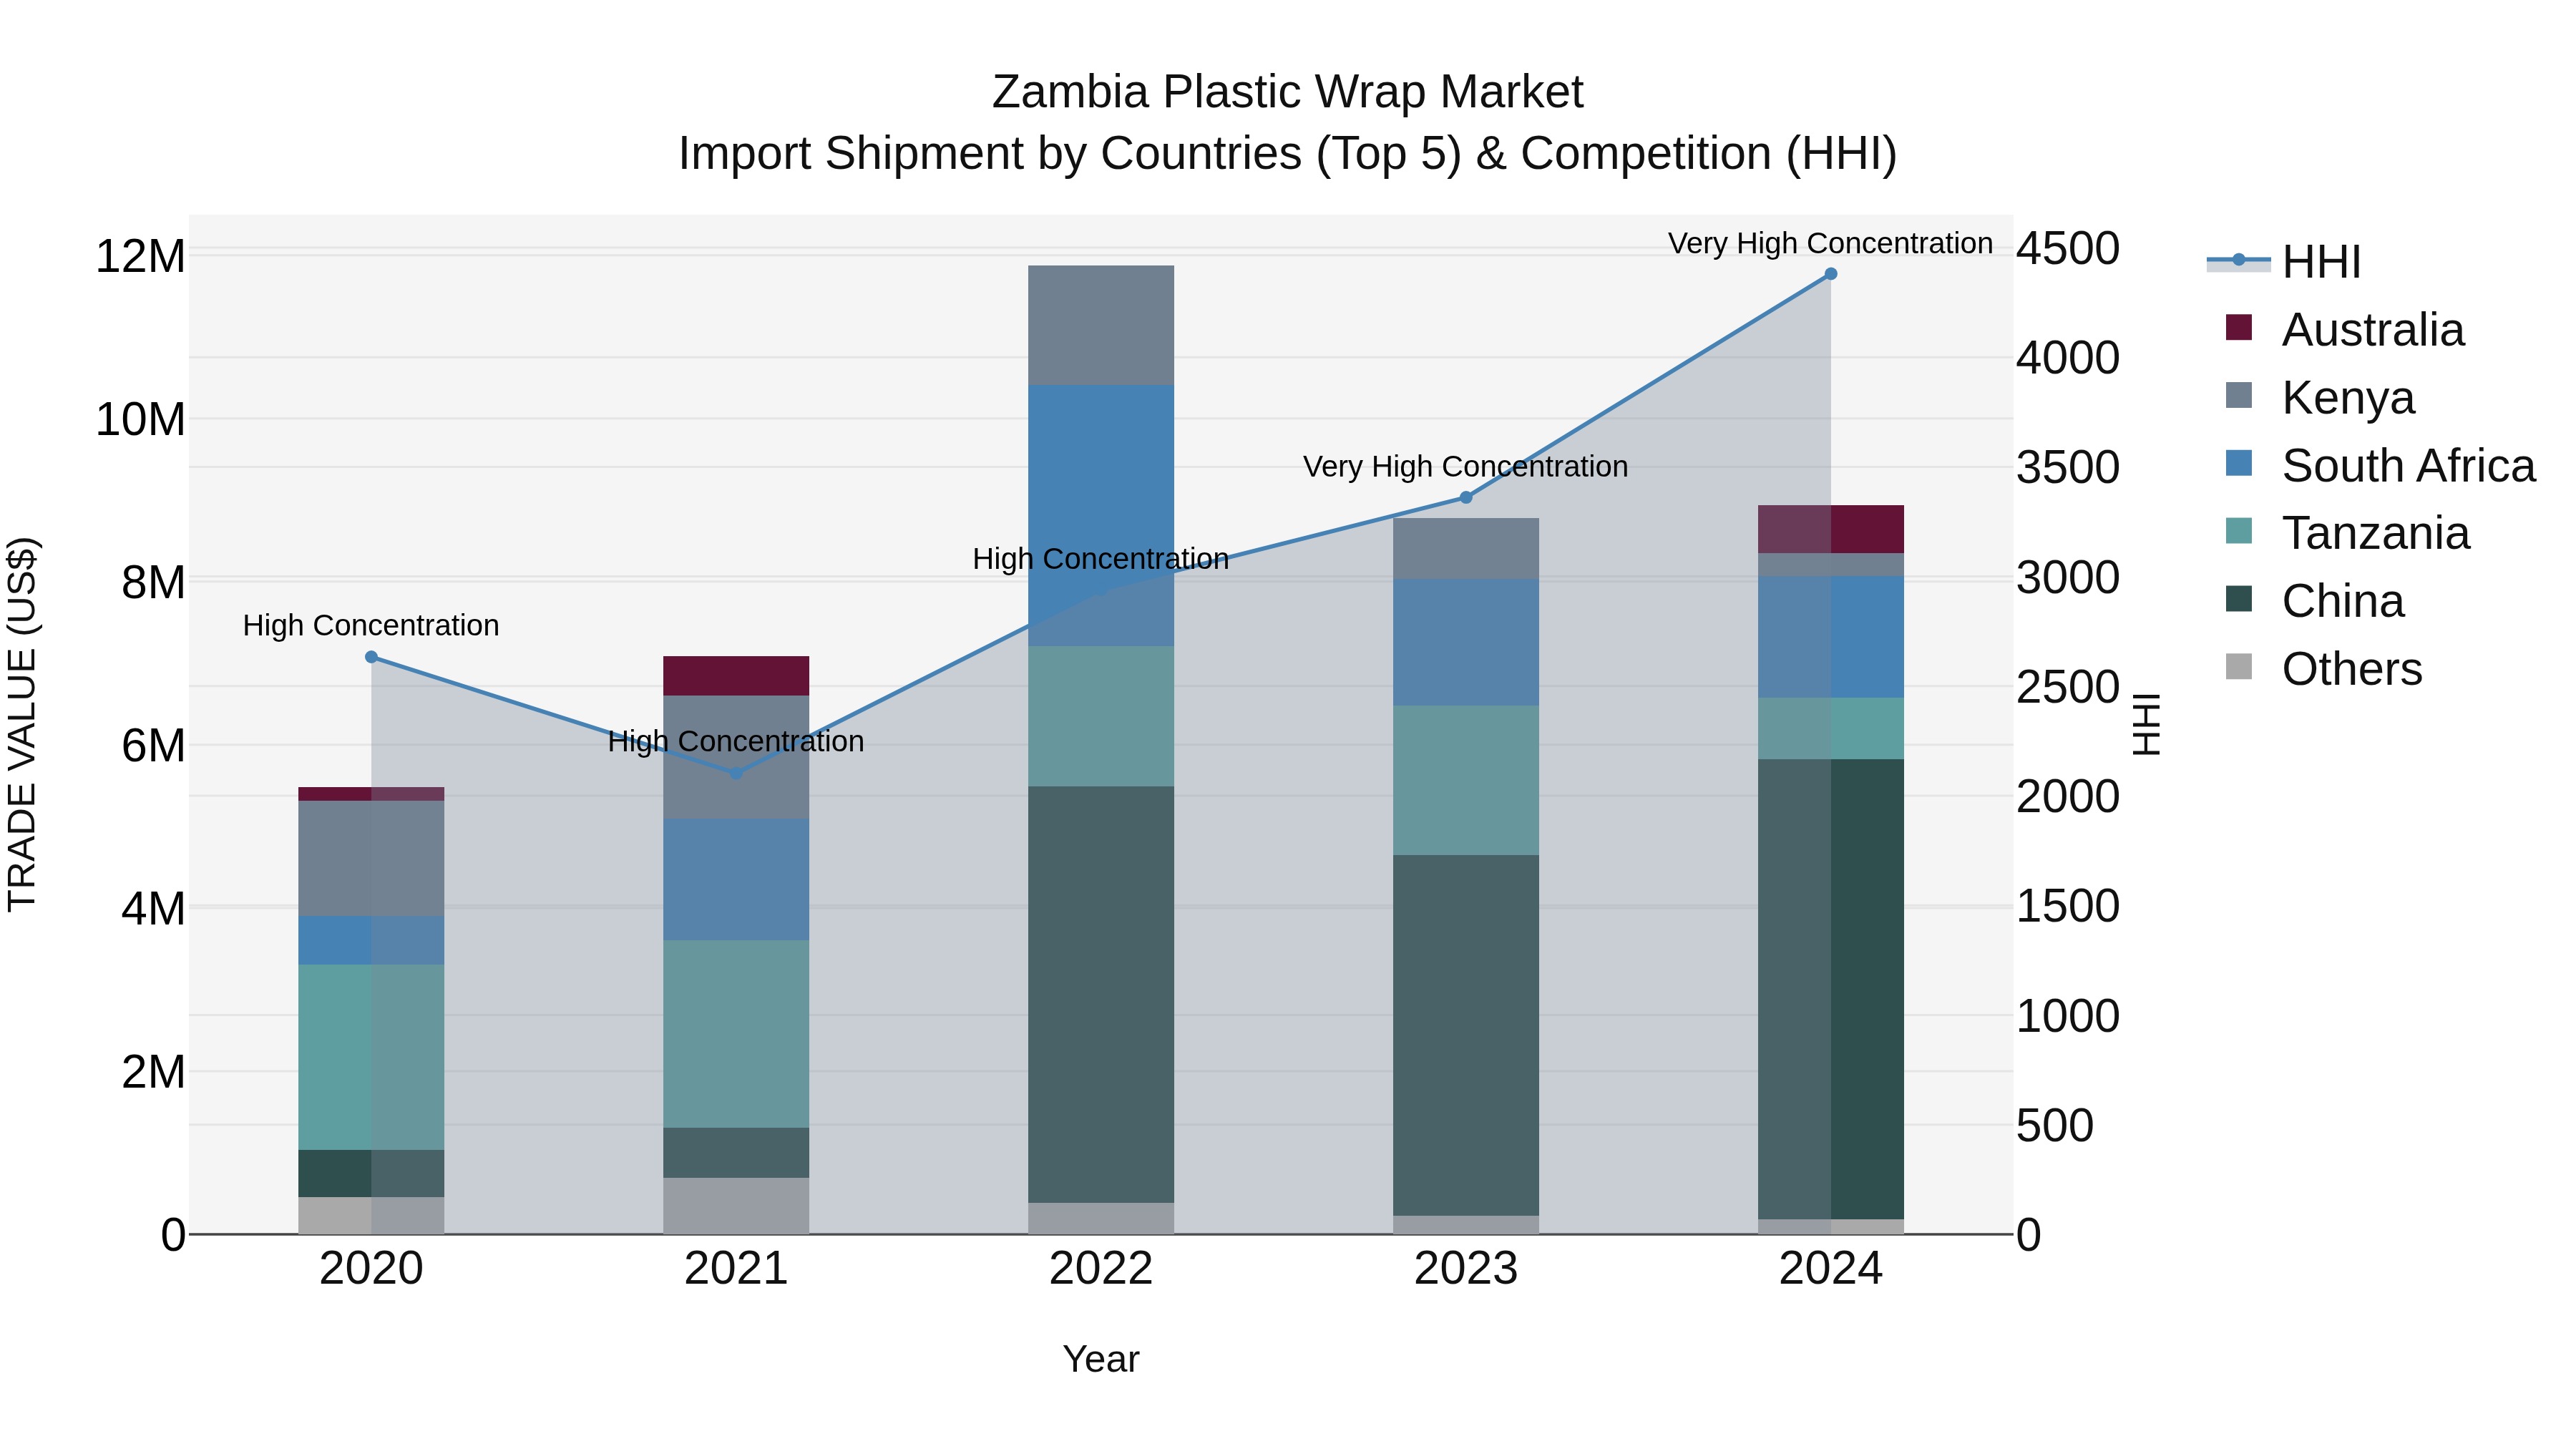
Zambia Plastic Wrap Market: Top 5 Importing Countries and Market Competition (HHI) Analysis
In 2024, Zambia continued to rely heavily on plastic wrap imports, with top exporters including China, South Africa, Tanzania, Australia, and Kenya. The market concentration, as measured by the Herfindahl-Hirschman Index (HHI), remained very high, indicating limited competition among suppliers. The compound annual growth rate (CAGR) from 2020 to 2024 stood at a robust 13.03%, reflecting sustained demand. Although the growth rate slightly dipped to 1.78% in 2024 compared to the previous year, the overall trend points towards a resilient market for plastic wrap imports in Zambia.
Key Highlights of the Report:
- Zambia Plastic Wrap Market Outlook
- Market Size of Zambia Plastic Wrap Market, 2025
- Forecast of Zambia Plastic Wrap Market, 2032
- Historical Data and Forecast of Zambia Plastic Wrap Revenues & Volume for the Period 2022 - 2032
- Zambia Plastic Wrap Market Trend Evolution
- Zambia Plastic Wrap Market Drivers and Challenges
- Zambia Plastic Wrap Price Trends
- Zambia Plastic Wrap Porter's Five Forces
- Zambia Plastic Wrap Industry Life Cycle
- Historical Data and Forecast of Zambia Plastic Wrap Market Revenues & Volume By Type for the Period 2022 - 2032
- Historical Data and Forecast of Zambia Plastic Wrap Market Revenues & Volume By Stretch Films for the Period 2022 - 2032
- Historical Data and Forecast of Zambia Plastic Wrap Market Revenues & Volume By Shrink Films for the Period 2022 - 2032
- Historical Data and Forecast of Zambia Plastic Wrap Market Revenues & Volume By Metallized Films for the Period 2022 - 2032
- Historical Data and Forecast of Zambia Plastic Wrap Market Revenues & Volume By Twist Film for the Period 2022 - 2032
- Historical Data and Forecast of Zambia Plastic Wrap Market Revenues & Volume By Release Film for the Period 2022 - 2032
- Historical Data and Forecast of Zambia Plastic Wrap Market Revenues & Volume By Twist Rope for the Period 2022 - 2032
- Historical Data and Forecast of Zambia Plastic Wrap Market Revenues & Volume By Others for the Period 2022 - 2032
- Historical Data and Forecast of Zambia Plastic Wrap Market Revenues & Volume By Material for the Period 2022 - 2032
- Historical Data and Forecast of Zambia Plastic Wrap Market Revenues & Volume By Polypropylene (PP) for the Period 2022 - 2032
- Historical Data and Forecast of Zambia Plastic Wrap Market Revenues & Volume By Polyethylene (PE) for the Period 2022 - 2032
- Historical Data and Forecast of Zambia Plastic Wrap Market Revenues & Volume By Polyvinyl Chloride (PVC) for the Period 2022 - 2032
- Historical Data and Forecast of Zambia Plastic Wrap Market Revenues & Volume By Polyethylene Terephthalate (PET) for the Period 2022 - 2032
- Historical Data and Forecast of Zambia Plastic Wrap Market Revenues & Volume By Ethylene Vinyl Alcohol Copolymer (EVOH) for the Period 2022 - 2032
- Historical Data and Forecast of Zambia Plastic Wrap Market Revenues & Volume By Ethylene-Vinyl Acetate (EVA) for the Period 2022 - 2032
- Historical Data and Forecast of Zambia Plastic Wrap Market Revenues & Volume By Nylon for the Period 2022 - 2032
- Historical Data and Forecast of Zambia Plastic Wrap Market Revenues & Volume By Others for the Period 2022 - 2032
- Historical Data and Forecast of Zambia Plastic Wrap Market Revenues & Volume By Feature for the Period 2022 - 2032
- Historical Data and Forecast of Zambia Plastic Wrap Market Revenues & Volume By Moisture Proof for the Period 2022 - 2032
- Historical Data and Forecast of Zambia Plastic Wrap Market Revenues & Volume By Water Soluble for the Period 2022 - 2032
- Historical Data and Forecast of Zambia Plastic Wrap Market Revenues & Volume By Processing Type for the Period 2022 - 2032
- Historical Data and Forecast of Zambia Plastic Wrap Market Revenues & Volume By Casting for the Period 2022 - 2032
- Historical Data and Forecast of Zambia Plastic Wrap Market Revenues & Volume By Multiple Extrusion for the Period 2022 - 2032
- Historical Data and Forecast of Zambia Plastic Wrap Market Revenues & Volume By Blow Molding for the Period 2022 - 2032
- Historical Data and Forecast of Zambia Plastic Wrap Market Revenues & Volume By Injection Molding for the Period 2022 - 2032
- Historical Data and Forecast of Zambia Plastic Wrap Market Revenues & Volume By Transparency for the Period 2022 - 2032
- Historical Data and Forecast of Zambia Plastic Wrap Market Revenues & Volume By Transparent for the Period 2022 - 2032
- Historical Data and Forecast of Zambia Plastic Wrap Market Revenues & Volume By Translucent for the Period 2022 - 2032
- Historical Data and Forecast of Zambia Plastic Wrap Market Revenues & Volume By Opaque for the Period 2022 - 2032
- Historical Data and Forecast of Zambia Plastic Wrap Market Revenues & Volume By End-User for the Period 2022 - 2032
- Historical Data and Forecast of Zambia Plastic Wrap Market Revenues & Volume By Food and Beverages for the Period 2022 - 2032
- Historical Data and Forecast of Zambia Plastic Wrap Market Revenues & Volume By Pharmaceuticals for the Period 2022 - 2032
- Historical Data and Forecast of Zambia Plastic Wrap Market Revenues & Volume By Personal Care and Cosmetics for the Period 2022 - 2032
- Historical Data and Forecast of Zambia Plastic Wrap Market Revenues & Volume By Chemical for the Period 2022 - 2032
- Historical Data and Forecast of Zambia Plastic Wrap Market Revenues & Volume By Others for the Period 2022 - 2032
- Historical Data and Forecast of Zambia Plastic Wrap Market Revenues & Volume By Distribution Channel for the Period 2022 - 2032
- Historical Data and Forecast of Zambia Plastic Wrap Market Revenues & Volume By E-commerce for the Period 2022 - 2032
- Historical Data and Forecast of Zambia Plastic Wrap Market Revenues & Volume By Convenience Store for the Period 2022 - 2032
- Historical Data and Forecast of Zambia Plastic Wrap Market Revenues & Volume By Retail Stores for the Period 2022 - 2032
- Historical Data and Forecast of Zambia Plastic Wrap Market Revenues & Volume By Supermarket/Hypermarket for the Period 2022 - 2032
- Historical Data and Forecast of Zambia Plastic Wrap Market Revenues & Volume By Others for the Period 2022 - 2032
- Zambia Plastic Wrap Import Export Trade Statistics
- Market Opportunity Assessment By Type
- Market Opportunity Assessment By Material
- Market Opportunity Assessment By Feature
- Market Opportunity Assessment By Processing Type
- Market Opportunity Assessment By Transparency
- Market Opportunity Assessment By End-User
- Market Opportunity Assessment By Distribution Channel
- Zambia Plastic Wrap Top Companies Market Share
- Zambia Plastic Wrap Competitive Benchmarking By Technical and Operational Parameters
- Zambia Plastic Wrap Company Profiles
- Zambia Plastic Wrap Key Strategic Recommendations
Frequently Asked Questions About the Market Study (FAQs):
6Wresearch actively monitors the Zambia Plastic Wrap Market and publishes its comprehensive annual report, highlighting emerging trends, growth drivers, revenue analysis, and forecast outlook. Our insights help businesses to make data-backed strategic decisions with ongoing market dynamics. Our analysts track relevent industries related to the Zambia Plastic Wrap Market, allowing our clients with actionable intelligence and reliable forecasts tailored to emerging regional needs.
Yes, we provide customisation as per your requirements. To learn more, feel free to contact us on sales@6wresearch.com
1 Executive Summary |
2 Introduction |
2.1 Key Highlights of the Report |
2.2 Report Description |
2.3 Market Scope & Segmentation |
2.4 Research Methodology |
2.5 Assumptions |
3 Zambia Plastic Wrap Market Overview |
3.1 Zambia Country Macro Economic Indicators |
3.2 Zambia Plastic Wrap Market Revenues & Volume, 2022 & 2032F |
3.3 Zambia Plastic Wrap Market - Industry Life Cycle |
3.4 Zambia Plastic Wrap Market - Porter's Five Forces |
3.5 Zambia Plastic Wrap Market Revenues & Volume Share, By Type, 2022 & 2032F |
3.6 Zambia Plastic Wrap Market Revenues & Volume Share, By Material, 2022 & 2032F |
3.7 Zambia Plastic Wrap Market Revenues & Volume Share, By Feature, 2022 & 2032F |
3.8 Zambia Plastic Wrap Market Revenues & Volume Share, By Processing Type, 2022 & 2032F |
3.9 Zambia Plastic Wrap Market Revenues & Volume Share, By Transparency, 2022 & 2032F |
3.10 Zambia Plastic Wrap Market Revenues & Volume Share, By End-User, 2022 & 2032F |
3.11 Zambia Plastic Wrap Market Revenues & Volume Share, By Distribution Channel, 2022 & 2032F |
4 Zambia Plastic Wrap Market Dynamics |
4.1 Impact Analysis |
4.2 Market Drivers |
4.2.1 Increasing demand for convenient and hygienic packaging solutions |
4.2.2 Growth in the food and beverage industry leading to higher consumption of plastic wrap |
4.2.3 Rise in e-commerce and retail sectors driving the need for packaging materials |
4.3 Market Restraints |
4.3.1 Environmental concerns and regulations regarding plastic usage |
4.3.2 Volatile raw material prices affecting production costs |
4.3.3 Competition from alternative eco-friendly packaging solutions |
5 Zambia Plastic Wrap Market Trends |
6 Zambia Plastic Wrap Market, By Types |
6.1 Zambia Plastic Wrap Market, By Type |
6.1.1 Overview and Analysis |
6.1.2 Zambia Plastic Wrap Market Revenues & Volume, By Type, 2022 - 2032F |
6.1.3 Zambia Plastic Wrap Market Revenues & Volume, By Stretch Films, 2022 - 2032F |
6.1.4 Zambia Plastic Wrap Market Revenues & Volume, By Shrink Films, 2022 - 2032F |
6.1.5 Zambia Plastic Wrap Market Revenues & Volume, By Metallized Films, 2022 - 2032F |
6.1.6 Zambia Plastic Wrap Market Revenues & Volume, By Twist Film, 2022 - 2032F |
6.1.7 Zambia Plastic Wrap Market Revenues & Volume, By Release Film, 2022 - 2032F |
6.1.8 Zambia Plastic Wrap Market Revenues & Volume, By Twist Rope, 2022 - 2032F |
6.2 Zambia Plastic Wrap Market, By Material |
6.2.1 Overview and Analysis |
6.2.2 Zambia Plastic Wrap Market Revenues & Volume, By Polypropylene (PP), 2022 - 2032F |
6.2.3 Zambia Plastic Wrap Market Revenues & Volume, By Polyethylene (PE), 2022 - 2032F |
6.2.4 Zambia Plastic Wrap Market Revenues & Volume, By Polyvinyl Chloride (PVC), 2022 - 2032F |
6.2.5 Zambia Plastic Wrap Market Revenues & Volume, By Polyethylene Terephthalate (PET), 2022 - 2032F |
6.2.6 Zambia Plastic Wrap Market Revenues & Volume, By Ethylene Vinyl Alcohol Copolymer (EVOH), 2022 - 2032F |
6.2.7 Zambia Plastic Wrap Market Revenues & Volume, By Ethylene-Vinyl Acetate (EVA), 2022 - 2032F |
6.2.8 Zambia Plastic Wrap Market Revenues & Volume, By Others, 2022 - 2032F |
6.2.9 Zambia Plastic Wrap Market Revenues & Volume, By Others, 2022 - 2032F |
6.3 Zambia Plastic Wrap Market, By Feature |
6.3.1 Overview and Analysis |
6.3.2 Zambia Plastic Wrap Market Revenues & Volume, By Moisture Proof, 2022 - 2032F |
6.3.3 Zambia Plastic Wrap Market Revenues & Volume, By Water Soluble, 2022 - 2032F |
6.4 Zambia Plastic Wrap Market, By Processing Type |
6.4.1 Overview and Analysis |
6.4.2 Zambia Plastic Wrap Market Revenues & Volume, By Casting, 2022 - 2032F |
6.4.3 Zambia Plastic Wrap Market Revenues & Volume, By Multiple Extrusion, 2022 - 2032F |
6.4.4 Zambia Plastic Wrap Market Revenues & Volume, By Blow Molding, 2022 - 2032F |
6.4.5 Zambia Plastic Wrap Market Revenues & Volume, By Injection Molding, 2022 - 2032F |
6.5 Zambia Plastic Wrap Market, By Transparency |
6.5.1 Overview and Analysis |
6.5.2 Zambia Plastic Wrap Market Revenues & Volume, By Transparent, 2022 - 2032F |
6.5.3 Zambia Plastic Wrap Market Revenues & Volume, By Translucent, 2022 - 2032F |
6.5.4 Zambia Plastic Wrap Market Revenues & Volume, By Opaque, 2022 - 2032F |
6.6 Zambia Plastic Wrap Market, By End-User |
6.6.1 Overview and Analysis |
6.6.2 Zambia Plastic Wrap Market Revenues & Volume, By Food and Beverages, 2022 - 2032F |
6.6.3 Zambia Plastic Wrap Market Revenues & Volume, By Pharmaceuticals, 2022 - 2032F |
6.6.4 Zambia Plastic Wrap Market Revenues & Volume, By Personal Care and Cosmetics, 2022 - 2032F |
6.6.5 Zambia Plastic Wrap Market Revenues & Volume, By Chemical, 2022 - 2032F |
6.6.6 Zambia Plastic Wrap Market Revenues & Volume, By Others, 2022 - 2032F |
6.7 Zambia Plastic Wrap Market, By Distribution Channel |
6.7.1 Overview and Analysis |
6.7.2 Zambia Plastic Wrap Market Revenues & Volume, By E-commerce, 2022 - 2032F |
6.7.3 Zambia Plastic Wrap Market Revenues & Volume, By Convenience Store, 2022 - 2032F |
6.7.4 Zambia Plastic Wrap Market Revenues & Volume, By Supermarket/Hypermarket, 2022 - 2032F |
6.7.5 Zambia Plastic Wrap Market Revenues & Volume, By Supermarket/Hypermarket, 2022 - 2032F |
6.7.6 Zambia Plastic Wrap Market Revenues & Volume, By Others, 2022 - 2032F |
7 Zambia Plastic Wrap Market Import-Export Trade Statistics |
7.1 Zambia Plastic Wrap Market Export to Major Countries |
7.2 Zambia Plastic Wrap Market Imports from Major Countries |
8 Zambia Plastic Wrap Market Key Performance Indicators |
8.1 Percentage increase in the adoption of plastic wrap in the food and beverage industry |
8.2 Efficiency of plastic wrap production processes |
8.3 Consumer satisfaction levels with the quality and durability of plastic wrap |
8.4 Innovation rate in developing sustainable and recyclable plastic wrap materials |
8.5 Market penetration of plastic wrap in the e-commerce and retail sectors |
9 Zambia Plastic Wrap Market - Opportunity Assessment |
9.1 Zambia Plastic Wrap Market Opportunity Assessment, By Type, 2022 & 2032F |
9.2 Zambia Plastic Wrap Market Opportunity Assessment, By Material, 2022 & 2032F |
9.3 Zambia Plastic Wrap Market Opportunity Assessment, By Feature, 2022 & 2032F |
9.4 Zambia Plastic Wrap Market Opportunity Assessment, By Processing Type, 2022 & 2032F |
9.5 Zambia Plastic Wrap Market Opportunity Assessment, By Transparency, 2022 & 2032F |
9.6 Zambia Plastic Wrap Market Opportunity Assessment, By End-User, 2022 & 2032F |
9.7 Zambia Plastic Wrap Market Opportunity Assessment, By Distribution Channel, 2022 & 2032F |
10 Zambia Plastic Wrap Market - Competitive Landscape |
10.1 Zambia Plastic Wrap Market Revenue Share, By Companies, 2025 |
10.2 Zambia Plastic Wrap Market Competitive Benchmarking, By Operating and Technical Parameters |
11 Company Profiles |
12 Recommendations |
13 Disclaimer |
Export potential assessment - trade Analytics for 2030
Export potential enables firms to identify high-growth global markets with greater confidence by combining advanced trade intelligence with a structured quantitative methodology. The framework analyzes emerging demand trends and country-level import patterns while integrating macroeconomic and trade datasets such as GDP and population forecasts, bilateral import–export flows, tariff structures, elasticity differentials between developed and developing economies, geographic distance, and import demand projections. Using weighted trade values from 2020–2024 as the base period to project country-to-country export potential for 2030, these inputs are operationalized through calculated drivers such as gravity model parameters, tariff impact factors, and projected GDP per-capita growth. Through an analysis of hidden potentials, demand hotspots, and market conditions that are most favorable to success, this method enables firms to focus on target countries, maximize returns, and global expansion with data, backed by accuracy.
By factoring in the projected importer demand gap that is currently unmet and could be potential opportunity, it identifies the potential for the Exporter (Country) among 190 countries, against the general trade analysis, which identifies the biggest importer or exporter.
To discover high-growth global markets and optimize your business strategy:
Click Here
Pricing
- Single User License$ 1,995
- Department License$ 2,400
- Site License$ 3,120
- Global License$ 3,795

Search
Thought Leadership and Analyst Meet


Our Clients
Latest Reports
- Philippines Polyhydroxybutyrate-co-Hydroxyvalerate Market (2026-2032) | Trends, Insights, Challenges, Restraints, Competition, Size, Value, Forecast, Pricing, Share, Outlook, Revenue, Investment Opportunities, Strategy, Drivers, Demand, Growth, segmentation, Analysis, Companies
- Peru Polyhydroxybutyrate-co-Hydroxyvalerate Market (2026-2032) | Growth, Demand, Challenges, Share, Trends, Analysis, Pricing, Investment Opportunities, Drivers, Value, Forecast, Competition, Size, Companies, Insights, Outlook, Restraints, segmentation, Revenue, Strategy
- Pakistan Polyhydroxybutyrate-co-Hydroxyvalerate Market (2026-2032) | Restraints, segmentation, Pricing, Forecast, Share, Strategy, Competition, Trends, Insights, Drivers, Challenges, Growth, Revenue, Outlook, Value, Investment Opportunities, Companies, Size, Analysis, Demand
- Oman Polyhydroxybutyrate-co-Hydroxyvalerate Market (2026-2032) | Drivers, segmentation, Insights, Competition, Pricing, Outlook, Size, Revenue, Challenges, Forecast, Analysis, Growth, Value, Share, Trends, Investment Opportunities, Strategy, Restraints, Companies, Demand
- Nigeria Polyhydroxybutyrate-co-Hydroxyvalerate Market (2026-2032) | Value, Investment Opportunities, Analysis, Revenue, Restraints, Pricing, Outlook, Competition, Demand, Growth, Forecast, Companies, Trends, Challenges, segmentation, Drivers, Insights, Share, Size, Strategy
- Nepal Polyhydroxybutyrate-co-Hydroxyvalerate Market (2026-2032) | Insights, Analysis, Drivers, Share, Revenue, Demand, segmentation, Investment Opportunities, Competition, Forecast, Growth, Pricing, Companies, Strategy, Trends, Restraints, Challenges, Outlook, Size, Value
- Myanmar Polyhydroxybutyrate-co-Hydroxyvalerate Market (2026-2032) | Outlook, Revenue, Strategy, Restraints, Drivers, segmentation, Share, Forecast, Competition, Insights, Growth, Pricing, Size, Demand, Value, Companies, Trends, Challenges, Investment Opportunities, Analysis
- Morocco Polyhydroxybutyrate-co-Hydroxyvalerate Market (2026-2032) | Outlook, Investment Opportunities, Restraints, Strategy, Forecast, Challenges, Drivers, Growth, Companies, segmentation, Trends, Size, Competition, Revenue, Demand, Insights, Share, Analysis, Value, Pricing
- Mexico Polyhydroxybutyrate-co-Hydroxyvalerate Market (2026-2032) | Size, Drivers, Outlook, Share, Strategy, Growth, Pricing, Challenges, Companies, Demand, Value, Investment Opportunities, Restraints, Trends, Forecast, segmentation, Analysis, Insights, Competition, Revenue
- Malaysia Polyhydroxybutyrate-co-Hydroxyvalerate Market (2026-2032) | Share, segmentation, Size, Companies, Analysis, Insights, Forecast, Value, Revenue, Drivers, Restraints, Challenges, Investment Opportunities, Trends, Competition, Strategy, Demand, Growth, Outlook, Pricing
Industry Events and Analyst Meet

HIMTEX 2026

India Refining Summit 2026

India EV Show 2026

EV tech India Expo 2026

Auto Tech Asia 2026
Whitepaper
- Middle East & Africa Commercial Security Market Click here to view more.
- Middle East & Africa Fire Safety Systems & Equipment Market Click here to view more.
- GCC Drone Market Click here to view more.
- Middle East Lighting Fixture Market Click here to view more.
- GCC Physical & Perimeter Security Market Click here to view more.
6WResearch In News
- Doha a strategic location for EV manufacturing hub: IPA Qatar
- Demand for luxury TVs surging in the GCC, says Samsung
- Empowering Growth: The Thriving Journey of Bangladesh’s Cable Industry
- Demand for luxury TVs surging in the GCC, says Samsung
- Video call with a traditional healer? Once unthinkable, it’s now common in South Africa
- Intelligent Buildings To Smooth GCC’s Path To Net Zero