Zambia Single Cell Battery Market (2026-2032) | Forecast, Value, Outlook, Share, Segmentation, Trends, Size & Revenue, Analysis, Growth, Companies, Competitive Landscape, Industry
Market Forecast By Rechargeability (Primary Battery, Secondary Battery), By Component (Cathode, Anode, Solid Electrolyte, Others), By Capacity (Below 20 Mah, Between 20 Mah, 500 Mah, Above 500 Mah), By Application (Consumer Electronics, Electric Vehicles, Medical Devices, Energy Harvesting, Wireless Sensors, Packaging, Others) And Competitive Landscape
| Product Code: ETC10127650 | Publication Date: Sep 2024 | Updated Date: Apr 2026 | Product Type: Market Research Report | |
| Publisher: 6Wresearch | Author: Dhaval Chaurasia | No. of Pages: 75 | No. of Figures: 35 | No. of Tables: 20 |
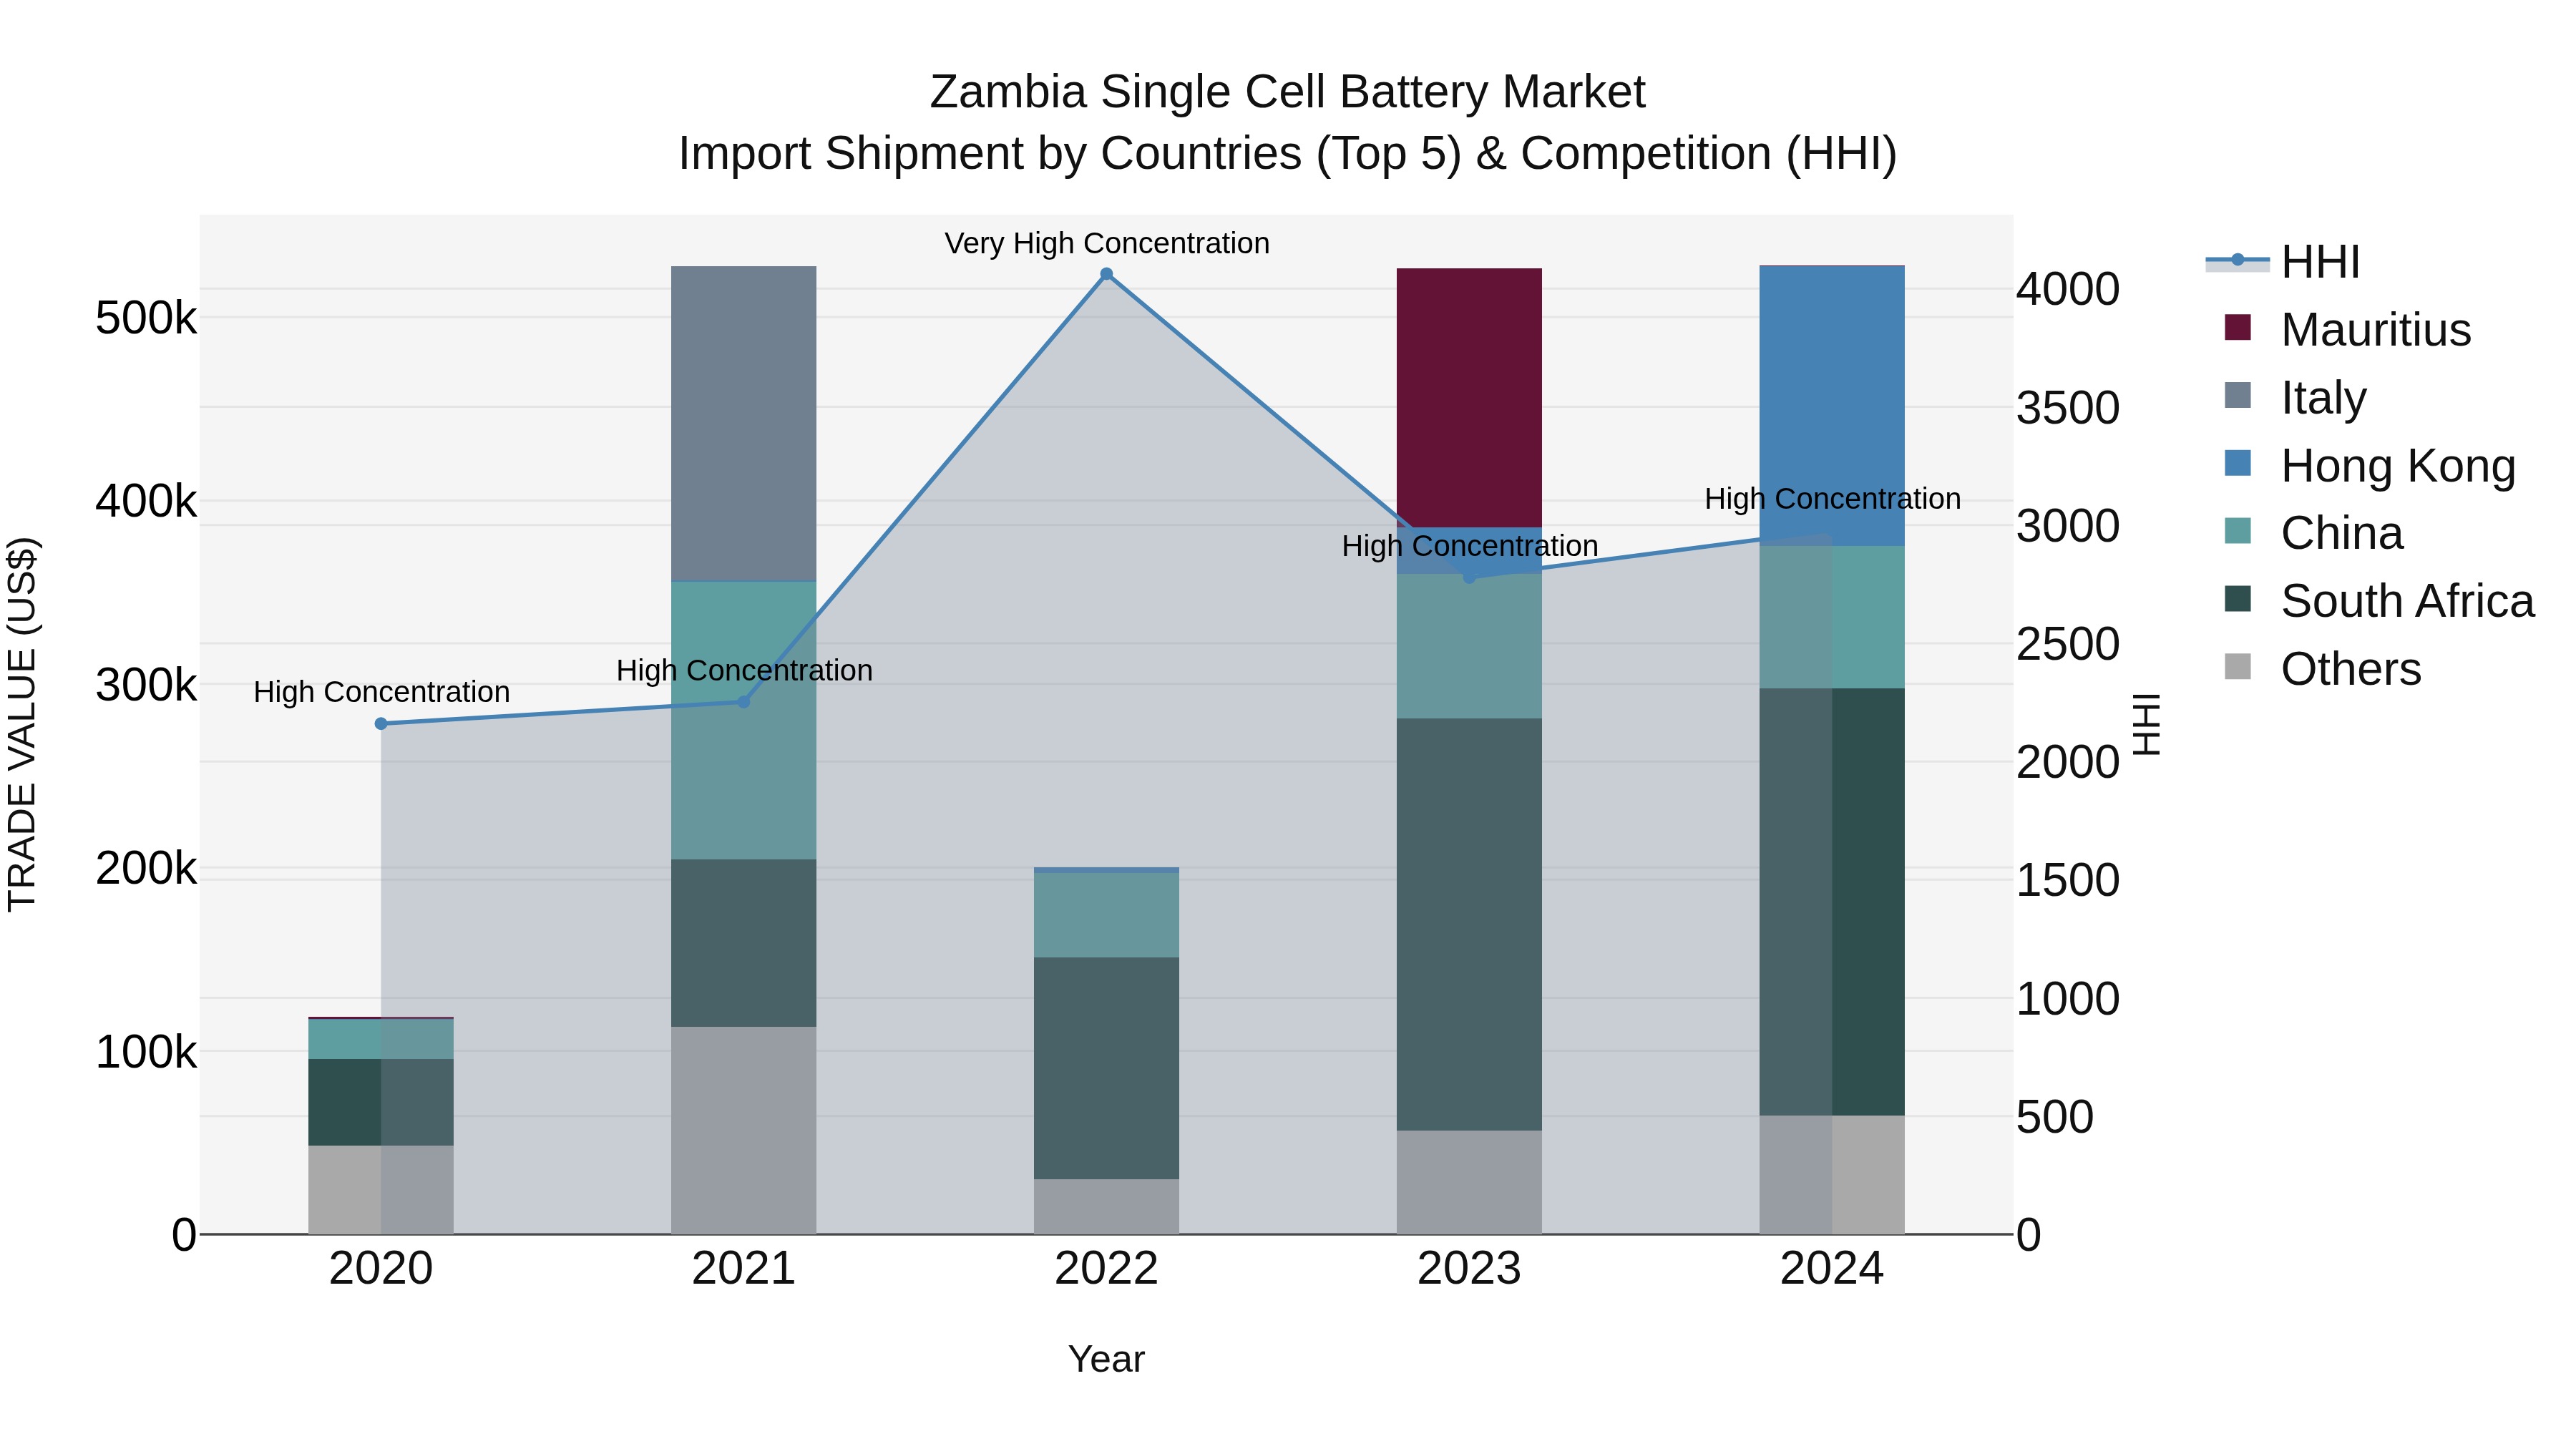
Zambia Single Cell Battery Market: Top 5 Importing Countries and Market Competition (HHI) Analysis
Zambia`s import shipments of single cell batteries in 2024 continued to be dominated by key exporting countries such as South Africa, Hong Kong, China, United States of America, and Singapore. The market concentration, as measured by the HHI index, significantly increased from 2023 to 2024, indicating a very high level of concentration among the top exporting countries. The impressive compound annual growth rate (CAGR) of 45.26% from 2020 to 2024 highlights the growing demand for single cell batteries in Zambia. Although the growth rate slightly slowed from 2023 to 2024, the overall trend remains positive for this market segment.
Key Highlights of the Report:
- Zambia Single Cell Battery Market Outlook
- Market Size of Zambia Single Cell Battery Market, 2025
- Forecast of Zambia Single Cell Battery Market, 2032
- Historical Data and Forecast of Zambia Single Cell Battery Revenues & Volume for the Period 2022 - 2032
- Zambia Single Cell Battery Market Trend Evolution
- Zambia Single Cell Battery Market Drivers and Challenges
- Zambia Single Cell Battery Price Trends
- Zambia Single Cell Battery Porter's Five Forces
- Zambia Single Cell Battery Industry Life Cycle
- Historical Data and Forecast of Zambia Single Cell Battery Market Revenues & Volume By Rechargeability for the Period 2022 - 2032
- Historical Data and Forecast of Zambia Single Cell Battery Market Revenues & Volume By Primary Battery for the Period 2022 - 2032
- Historical Data and Forecast of Zambia Single Cell Battery Market Revenues & Volume By Secondary Battery for the Period 2022 - 2032
- Historical Data and Forecast of Zambia Single Cell Battery Market Revenues & Volume By Component for the Period 2022 - 2032
- Historical Data and Forecast of Zambia Single Cell Battery Market Revenues & Volume By Cathode for the Period 2022 - 2032
- Historical Data and Forecast of Zambia Single Cell Battery Market Revenues & Volume By Anode for the Period 2022 - 2032
- Historical Data and Forecast of Zambia Single Cell Battery Market Revenues & Volume By Solid Electrolyte for the Period 2022 - 2032
- Historical Data and Forecast of Zambia Single Cell Battery Market Revenues & Volume By Others for the Period 2022 - 2032
- Historical Data and Forecast of Zambia Single Cell Battery Market Revenues & Volume By Capacity for the Period 2022 - 2032
- Historical Data and Forecast of Zambia Single Cell Battery Market Revenues & Volume By Below 20 Mah for the Period 2022 - 2032
- Historical Data and Forecast of Zambia Single Cell Battery Market Revenues & Volume By Between 20 Mah for the Period 2022 - 2032
- Historical Data and Forecast of Zambia Single Cell Battery Market Revenues & Volume By 500 Mah for the Period 2022 - 2032
- Historical Data and Forecast of Zambia Single Cell Battery Market Revenues & Volume By Above 500 Mah for the Period 2022 - 2032
- Historical Data and Forecast of Zambia Single Cell Battery Market Revenues & Volume By Application for the Period 2022 - 2032
- Historical Data and Forecast of Zambia Single Cell Battery Market Revenues & Volume By Consumer Electronics for the Period 2022 - 2032
- Historical Data and Forecast of Zambia Single Cell Battery Market Revenues & Volume By Electric Vehicles for the Period 2022 - 2032
- Historical Data and Forecast of Zambia Single Cell Battery Market Revenues & Volume By Medical Devices for the Period 2022 - 2032
- Historical Data and Forecast of Zambia Single Cell Battery Market Revenues & Volume By Energy Harvesting for the Period 2022 - 2032
- Historical Data and Forecast of Zambia Single Cell Battery Market Revenues & Volume By Wireless Sensors for the Period 2022 - 2032
- Historical Data and Forecast of Zambia Single Cell Battery Market Revenues & Volume By Packaging for the Period 2022 - 2032
- Historical Data and Forecast of Zambia Single Cell Battery Market Revenues & Volume By Others for the Period 2022 - 2032
- Zambia Single Cell Battery Import Export Trade Statistics
- Market Opportunity Assessment By Rechargeability
- Market Opportunity Assessment By Component
- Market Opportunity Assessment By Capacity
- Market Opportunity Assessment By Application
- Zambia Single Cell Battery Top Companies Market Share
- Zambia Single Cell Battery Competitive Benchmarking By Technical and Operational Parameters
- Zambia Single Cell Battery Company Profiles
- Zambia Single Cell Battery Key Strategic Recommendations
Frequently Asked Questions About the Market Study (FAQs):
6Wresearch actively monitors the Zambia Single Cell Battery Market and publishes its comprehensive annual report, highlighting emerging trends, growth drivers, revenue analysis, and forecast outlook. Our insights help businesses to make data-backed strategic decisions with ongoing market dynamics. Our analysts track relevent industries related to the Zambia Single Cell Battery Market, allowing our clients with actionable intelligence and reliable forecasts tailored to emerging regional needs.
Yes, we provide customisation as per your requirements. To learn more, feel free to contact us on sales@6wresearch.com
1 Executive Summary |
2 Introduction |
2.1 Key Highlights of the Report |
2.2 Report Description |
2.3 Market Scope & Segmentation |
2.4 Research Methodology |
2.5 Assumptions |
3 Zambia Single Cell Battery Market Overview |
3.1 Zambia Country Macro Economic Indicators |
3.2 Zambia Single Cell Battery Market Revenues & Volume, 2022 & 2032F |
3.3 Zambia Single Cell Battery Market - Industry Life Cycle |
3.4 Zambia Single Cell Battery Market - Porter's Five Forces |
3.5 Zambia Single Cell Battery Market Revenues & Volume Share, By Rechargeability, 2022 & 2032F |
3.6 Zambia Single Cell Battery Market Revenues & Volume Share, By Component, 2022 & 2032F |
3.7 Zambia Single Cell Battery Market Revenues & Volume Share, By Capacity, 2022 & 2032F |
3.8 Zambia Single Cell Battery Market Revenues & Volume Share, By Application, 2022 & 2032F |
4 Zambia Single Cell Battery Market Dynamics |
4.1 Impact Analysis |
4.2 Market Drivers |
4.2.1 Increasing demand for portable electronic devices requiring single cell batteries |
4.2.2 Growth in the automotive industry leading to higher use of single cell batteries in vehicles |
4.2.3 Rising adoption of renewable energy sources like solar power, which utilize single cell batteries |
4.3 Market Restraints |
4.3.1 Fluctuating raw material prices impacting production costs |
4.3.2 Competition from rechargeable batteries impacting demand for single cell batteries |
4.3.3 Environmental concerns leading to stricter regulations on battery disposal |
5 Zambia Single Cell Battery Market Trends |
6 Zambia Single Cell Battery Market, By Types |
6.1 Zambia Single Cell Battery Market, By Rechargeability |
6.1.1 Overview and Analysis |
6.1.2 Zambia Single Cell Battery Market Revenues & Volume, By Rechargeability, 2022 - 2032F |
6.1.3 Zambia Single Cell Battery Market Revenues & Volume, By Primary Battery, 2022 - 2032F |
6.1.4 Zambia Single Cell Battery Market Revenues & Volume, By Secondary Battery, 2022 - 2032F |
6.2 Zambia Single Cell Battery Market, By Component |
6.2.1 Overview and Analysis |
6.2.2 Zambia Single Cell Battery Market Revenues & Volume, By Cathode, 2022 - 2032F |
6.2.3 Zambia Single Cell Battery Market Revenues & Volume, By Anode, 2022 - 2032F |
6.2.4 Zambia Single Cell Battery Market Revenues & Volume, By Solid Electrolyte, 2022 - 2032F |
6.2.5 Zambia Single Cell Battery Market Revenues & Volume, By Others, 2022 - 2032F |
6.3 Zambia Single Cell Battery Market, By Capacity |
6.3.1 Overview and Analysis |
6.3.2 Zambia Single Cell Battery Market Revenues & Volume, By Below 20 Mah, 2022 - 2032F |
6.3.3 Zambia Single Cell Battery Market Revenues & Volume, By Between 20 Mah, 2022 - 2032F |
6.3.4 Zambia Single Cell Battery Market Revenues & Volume, By 500 Mah, 2022 - 2032F |
6.3.5 Zambia Single Cell Battery Market Revenues & Volume, By Above 500 Mah, 2022 - 2032F |
6.4 Zambia Single Cell Battery Market, By Application |
6.4.1 Overview and Analysis |
6.4.2 Zambia Single Cell Battery Market Revenues & Volume, By Consumer Electronics, 2022 - 2032F |
6.4.3 Zambia Single Cell Battery Market Revenues & Volume, By Electric Vehicles, 2022 - 2032F |
6.4.4 Zambia Single Cell Battery Market Revenues & Volume, By Medical Devices, 2022 - 2032F |
6.4.5 Zambia Single Cell Battery Market Revenues & Volume, By Energy Harvesting, 2022 - 2032F |
6.4.6 Zambia Single Cell Battery Market Revenues & Volume, By Wireless Sensors, 2022 - 2032F |
6.4.7 Zambia Single Cell Battery Market Revenues & Volume, By Packaging, 2022 - 2032F |
7 Zambia Single Cell Battery Market Import-Export Trade Statistics |
7.1 Zambia Single Cell Battery Market Export to Major Countries |
7.2 Zambia Single Cell Battery Market Imports from Major Countries |
8 Zambia Single Cell Battery Market Key Performance Indicators |
8.1 Average selling price of single cell batteries in Zambia |
8.2 Number of new product launches in the single cell battery market |
8.3 Adoption rate of single cell batteries in different industries |
9 Zambia Single Cell Battery Market - Opportunity Assessment |
9.1 Zambia Single Cell Battery Market Opportunity Assessment, By Rechargeability, 2022 & 2032F |
9.2 Zambia Single Cell Battery Market Opportunity Assessment, By Component, 2022 & 2032F |
9.3 Zambia Single Cell Battery Market Opportunity Assessment, By Capacity, 2022 & 2032F |
9.4 Zambia Single Cell Battery Market Opportunity Assessment, By Application, 2022 & 2032F |
10 Zambia Single Cell Battery Market - Competitive Landscape |
10.1 Zambia Single Cell Battery Market Revenue Share, By Companies, 2025 |
10.2 Zambia Single Cell Battery Market Competitive Benchmarking, By Operating and Technical Parameters |
11 Company Profiles |
12 Recommendations |
13 Disclaimer |
Export potential assessment - trade Analytics for 2030
Export potential enables firms to identify high-growth global markets with greater confidence by combining advanced trade intelligence with a structured quantitative methodology. The framework analyzes emerging demand trends and country-level import patterns while integrating macroeconomic and trade datasets such as GDP and population forecasts, bilateral import–export flows, tariff structures, elasticity differentials between developed and developing economies, geographic distance, and import demand projections. Using weighted trade values from 2020–2024 as the base period to project country-to-country export potential for 2030, these inputs are operationalized through calculated drivers such as gravity model parameters, tariff impact factors, and projected GDP per-capita growth. Through an analysis of hidden potentials, demand hotspots, and market conditions that are most favorable to success, this method enables firms to focus on target countries, maximize returns, and global expansion with data, backed by accuracy.
By factoring in the projected importer demand gap that is currently unmet and could be potential opportunity, it identifies the potential for the Exporter (Country) among 190 countries, against the general trade analysis, which identifies the biggest importer or exporter.
To discover high-growth global markets and optimize your business strategy:
Click Here
Pricing
- Single User License$ 1,995
- Department License$ 2,400
- Site License$ 3,120
- Global License$ 3,795

Search
Thought Leadership and Analyst Meet


Our Clients
Latest Reports
- Philippines Polyhydroxybutyrate-co-Hydroxyvalerate Market (2026-2032) | Trends, Insights, Challenges, Restraints, Competition, Size, Value, Forecast, Pricing, Share, Outlook, Revenue, Investment Opportunities, Strategy, Drivers, Demand, Growth, segmentation, Analysis, Companies
- Peru Polyhydroxybutyrate-co-Hydroxyvalerate Market (2026-2032) | Growth, Demand, Challenges, Share, Trends, Analysis, Pricing, Investment Opportunities, Drivers, Value, Forecast, Competition, Size, Companies, Insights, Outlook, Restraints, segmentation, Revenue, Strategy
- Pakistan Polyhydroxybutyrate-co-Hydroxyvalerate Market (2026-2032) | Restraints, segmentation, Pricing, Forecast, Share, Strategy, Competition, Trends, Insights, Drivers, Challenges, Growth, Revenue, Outlook, Value, Investment Opportunities, Companies, Size, Analysis, Demand
- Oman Polyhydroxybutyrate-co-Hydroxyvalerate Market (2026-2032) | Drivers, segmentation, Insights, Competition, Pricing, Outlook, Size, Revenue, Challenges, Forecast, Analysis, Growth, Value, Share, Trends, Investment Opportunities, Strategy, Restraints, Companies, Demand
- Nigeria Polyhydroxybutyrate-co-Hydroxyvalerate Market (2026-2032) | Value, Investment Opportunities, Analysis, Revenue, Restraints, Pricing, Outlook, Competition, Demand, Growth, Forecast, Companies, Trends, Challenges, segmentation, Drivers, Insights, Share, Size, Strategy
- Nepal Polyhydroxybutyrate-co-Hydroxyvalerate Market (2026-2032) | Insights, Analysis, Drivers, Share, Revenue, Demand, segmentation, Investment Opportunities, Competition, Forecast, Growth, Pricing, Companies, Strategy, Trends, Restraints, Challenges, Outlook, Size, Value
- Myanmar Polyhydroxybutyrate-co-Hydroxyvalerate Market (2026-2032) | Outlook, Revenue, Strategy, Restraints, Drivers, segmentation, Share, Forecast, Competition, Insights, Growth, Pricing, Size, Demand, Value, Companies, Trends, Challenges, Investment Opportunities, Analysis
- Morocco Polyhydroxybutyrate-co-Hydroxyvalerate Market (2026-2032) | Outlook, Investment Opportunities, Restraints, Strategy, Forecast, Challenges, Drivers, Growth, Companies, segmentation, Trends, Size, Competition, Revenue, Demand, Insights, Share, Analysis, Value, Pricing
- Mexico Polyhydroxybutyrate-co-Hydroxyvalerate Market (2026-2032) | Size, Drivers, Outlook, Share, Strategy, Growth, Pricing, Challenges, Companies, Demand, Value, Investment Opportunities, Restraints, Trends, Forecast, segmentation, Analysis, Insights, Competition, Revenue
- Malaysia Polyhydroxybutyrate-co-Hydroxyvalerate Market (2026-2032) | Share, segmentation, Size, Companies, Analysis, Insights, Forecast, Value, Revenue, Drivers, Restraints, Challenges, Investment Opportunities, Trends, Competition, Strategy, Demand, Growth, Outlook, Pricing
Industry Events and Analyst Meet

HIMTEX 2026

India Refining Summit 2026

India EV Show 2026

EV tech India Expo 2026

Auto Tech Asia 2026
Whitepaper
- Middle East & Africa Commercial Security Market Click here to view more.
- Middle East & Africa Fire Safety Systems & Equipment Market Click here to view more.
- GCC Drone Market Click here to view more.
- Middle East Lighting Fixture Market Click here to view more.
- GCC Physical & Perimeter Security Market Click here to view more.
6WResearch In News
- Doha a strategic location for EV manufacturing hub: IPA Qatar
- Demand for luxury TVs surging in the GCC, says Samsung
- Empowering Growth: The Thriving Journey of Bangladesh’s Cable Industry
- Demand for luxury TVs surging in the GCC, says Samsung
- Video call with a traditional healer? Once unthinkable, it’s now common in South Africa
- Intelligent Buildings To Smooth GCC’s Path To Net Zero