Zambia Surimi Market (2026-2032) | Trends, Forecast, Segmentation, Share, Industry, Outlook, Companies, Value, Growth, Size, Revenue & Analysis
Market Forecast By Source (Alaska Pollock, Itoyori, Pacific Whiting, Silver Carp, Others), By Packaging (Chilled or Fresh, Frozen), By End Use (Households, Hotels, Restaurants and Catering (HoReCa), Food Processing, Others), By Distribution Channel (Direct Sales, Retail Sales, Supermarkets and Hypermarkets, Online Retail, Wet Markets and others) And Competitive Landscape
| Product Code: ETC4748889 | Publication Date: Nov 2023 | Updated Date: Apr 2026 | Product Type: Market Research Report | |
| Publisher: 6Wresearch | Author: Shubham Padhi | No. of Pages: 60 | No. of Figures: 30 | No. of Tables: 5 |
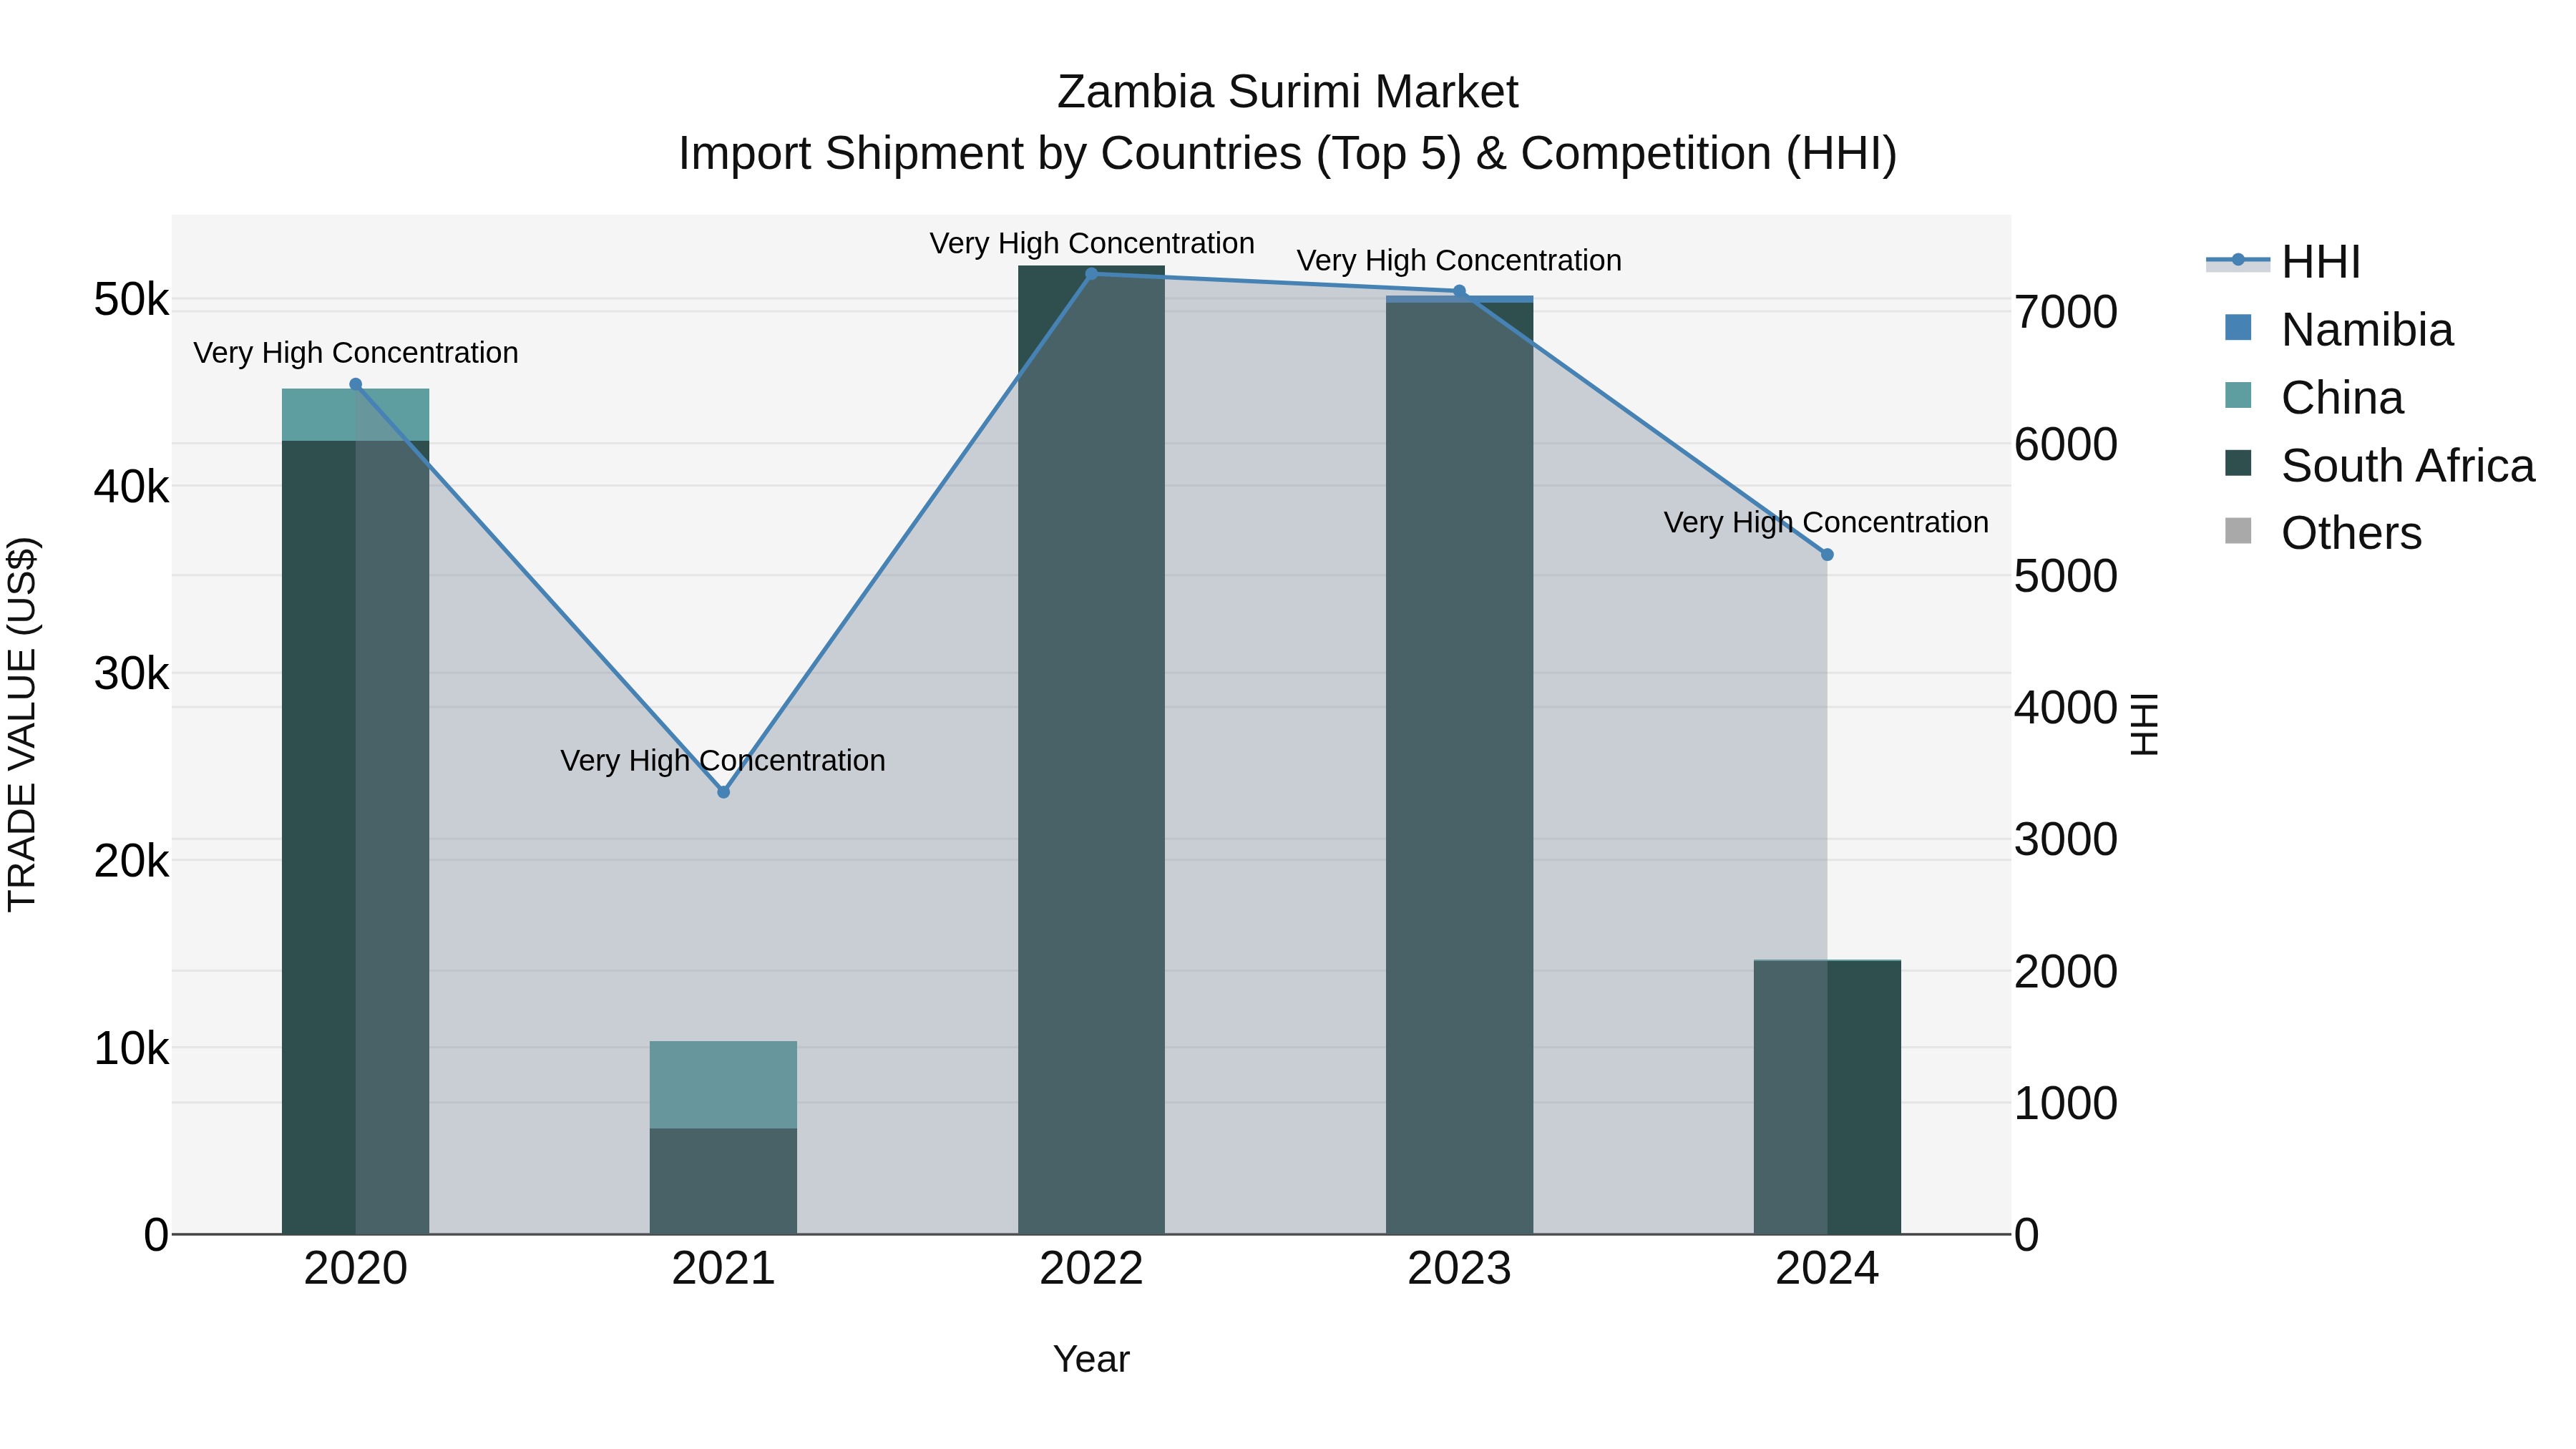
Zambia Surimi Market: Top 5 Importing Countries and Market Competition (HHI) Analysis
In 2024, Zambia continued to rely on surimi imports primarily from South Africa, China, and Namibia. The high Herfindahl-Hirschman Index (HHI) indicates a concentrated market with these top exporting countries dominating the surimi trade. The Compound Annual Growth Rate (CAGR) from 2020 to 2024 decreased significantly by -24.51%, while the growth rate in 2024 plummeted by -70.74%. These figures suggest a challenging market environment for surimi imports in Zambia, potentially impacted by various factors such as economic conditions or trade dynamics.
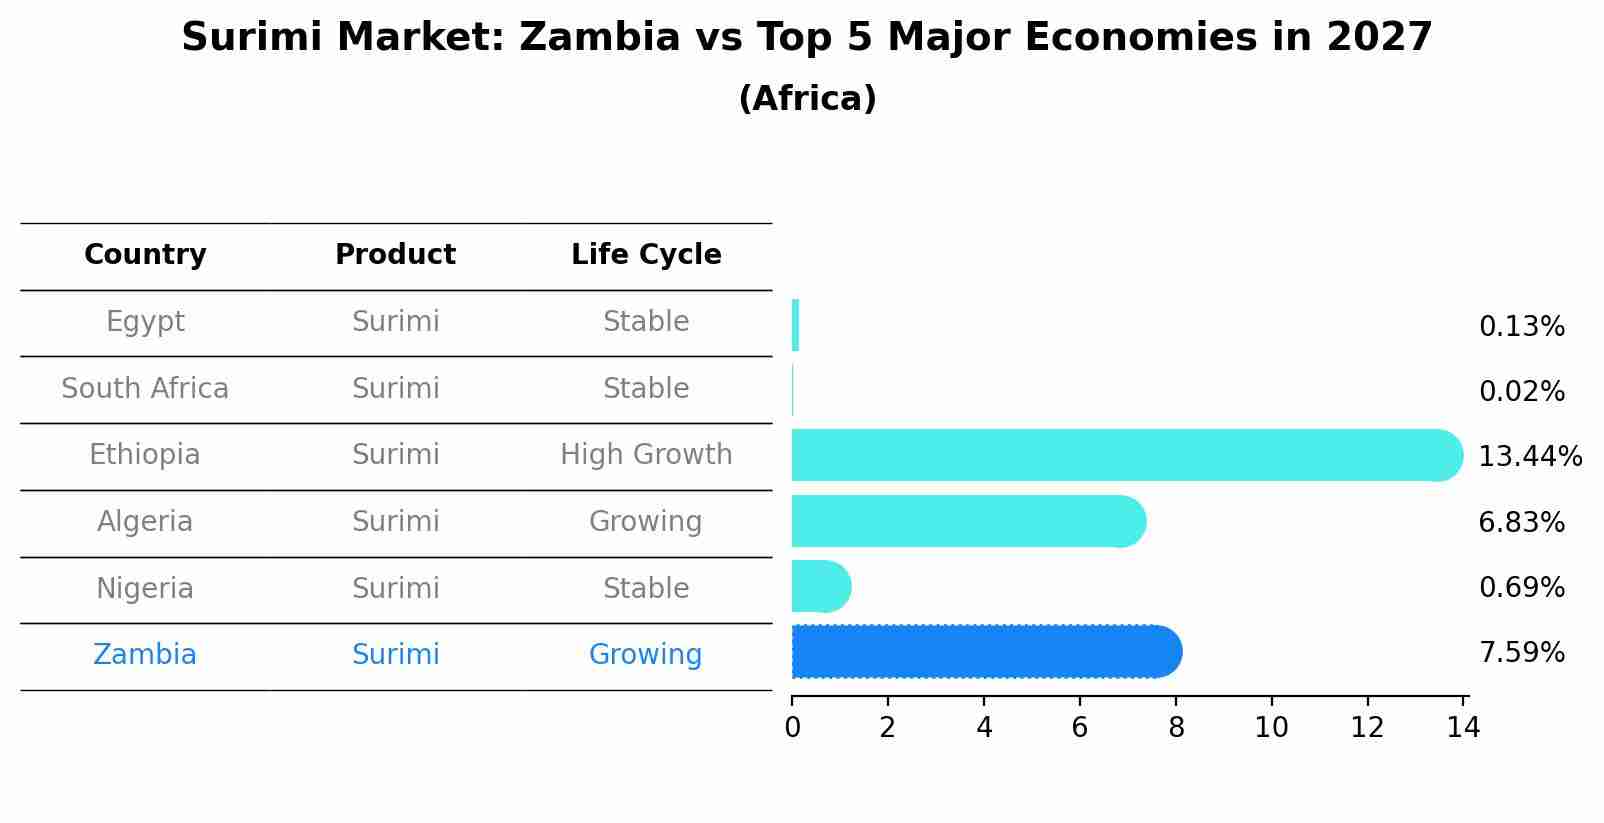
Surimi Market: Zambia vs Top 5 Major Economies in 2027 (Africa)
By 2027, Zambia's Surimi market is forecasted to achieve a growing growth rate of 7.59%, with Egypt leading the Africa region, followed by South Africa, Ethiopia, Algeria and Nigeria.
Key Highlights of the Report:
- Zambia Surimi Market Outlook
- Market Size of Zambia Surimi Market, 2025
- Forecast of Zambia Surimi Market, 2032
- Historical Data and Forecast of Zambia Surimi Revenues & Volume for the Period 2022 - 2032F
- Zambia Surimi Market Trend Evolution
- Zambia Surimi Market Drivers and Challenges
- Zambia Surimi Price Trends
- Zambia Surimi Porter`s Five Forces
- Zambia Surimi Industry Life Cycle
- Historical Data and Forecast of Zambia Surimi Market Revenues & Volume By Source for the Period 2022 - 2032F
- Historical Data and Forecast of Zambia Surimi Market Revenues & Volume By Alaska Pollock for the Period 2022 - 2032F
- Historical Data and Forecast of Zambia Surimi Market Revenues & Volume By Itoyori for the Period 2022 - 2032F
- Historical Data and Forecast of Zambia Surimi Market Revenues & Volume By Pacific Whiting for the Period 2022 - 2032F
- Historical Data and Forecast of Zambia Surimi Market Revenues & Volume By Silver Carp for the Period 2022 - 2032F
- Historical Data and Forecast of Zambia Surimi Market Revenues & Volume By Others for the Period 2022 - 2032F
- Historical Data and Forecast of Zambia Surimi Market Revenues & Volume By Packaging for the Period 2022 - 2032F
- Historical Data and Forecast of Zambia Surimi Market Revenues & Volume By Chilled or Fresh for the Period 2022 - 2032F
- Historical Data and Forecast of Zambia Surimi Market Revenues & Volume By Frozen for the Period 2022 - 2032F
- Historical Data and Forecast of Zambia Surimi Market Revenues & Volume By End Use for the Period 2022 - 2032F
- Historical Data and Forecast of Zambia Surimi Market Revenues & Volume By Households for the Period 2022 - 2032F
- Historical Data and Forecast of Zambia Surimi Market Revenues & Volume By Hotels, Restaurants and Catering (HoReCa) for the Period 2022 - 2032F
- Historical Data and Forecast of Zambia Surimi Market Revenues & Volume By Food Processing for the Period 2022 - 2032F
- Historical Data and Forecast of Zambia Surimi Market Revenues & Volume By Others for the Period 2022 - 2032F
- Historical Data and Forecast of Zambia Surimi Market Revenues & Volume By Distribution Channel for the Period 2022 - 2032F
- Historical Data and Forecast of Zambia Surimi Market Revenues & Volume By Direct Sales for the Period 2022 - 2032F
- Historical Data and Forecast of Zambia Surimi Market Revenues & Volume By Retail Sales for the Period 2022 - 2032F
- Historical Data and Forecast of Zambia Surimi Market Revenues & Volume By Supermarkets and Hypermarkets for the Period 2022 - 2032F
- Historical Data and Forecast of Zambia Surimi Market Revenues & Volume By Online Retail for the Period 2022 - 2032F
- Historical Data and Forecast of Zambia Surimi Market Revenues & Volume By Wet Markets and others for the Period 2022 - 2032F
- Zambia Surimi Import Export Trade Statistics
- Market Opportunity Assessment By Source
- Market Opportunity Assessment By Packaging
- Market Opportunity Assessment By End Use
- Market Opportunity Assessment By Distribution Channel
- Zambia Surimi Top Companies Market Share
- Zambia Surimi Competitive Benchmarking By Technical and Operational Parameters
- Zambia Surimi Company Profiles
- Zambia Surimi Key Strategic Recommendations
Frequently Asked Questions About the Market Study (FAQs):
6Wresearch actively monitors the Zambia Surimi Market and publishes its comprehensive annual report, highlighting emerging trends, growth drivers, revenue analysis, and forecast outlook. Our insights help businesses to make data-backed strategic decisions with ongoing market dynamics. Our analysts track relevent industries related to the Zambia Surimi Market, allowing our clients with actionable intelligence and reliable forecasts tailored to emerging regional needs.
Yes, we provide customisation as per your requirements. To learn more, feel free to contact us on sales@6wresearch.com
1 Executive Summary |
2 Introduction |
2.1 Key Highlights of the Report |
2.2 Report Description |
2.3 Market Scope & Segmentation |
2.4 Research Methodology |
2.5 Assumptions |
3 Zambia Surimi Market Overview |
3.1 Zambia Country Macro Economic Indicators |
3.2 Zambia Surimi Market Revenues & Volume, 2022 & 2032F |
3.3 Zambia Surimi Market - Industry Life Cycle |
3.4 Zambia Surimi Market - Porter's Five Forces |
3.5 Zambia Surimi Market Revenues & Volume Share, By Source, 2022 & 2032F |
3.6 Zambia Surimi Market Revenues & Volume Share, By Packaging, 2022 & 2032F |
3.7 Zambia Surimi Market Revenues & Volume Share, By End Use, 2022 & 2032F |
3.8 Zambia Surimi Market Revenues & Volume Share, By Distribution Channel, 2022 & 2032F |
4 Zambia Surimi Market Dynamics |
4.1 Impact Analysis |
4.2 Market Drivers |
4.2.1 Increasing consumer awareness about the health benefits of surimi as a low-fat and high-protein seafood alternative. |
4.2.2 Growth in demand for convenient and easy-to-prepare food products due to busy lifestyles. |
4.2.3 Expansion of the retail sector and availability of surimi products in supermarkets and hypermarkets. |
4.3 Market Restraints |
4.3.1 Fluctuations in raw material prices such as fish and seafood, impacting production costs. |
4.3.2 Lack of awareness and acceptance of surimi products among traditional consumers. |
4.3.3 Competition from other seafood products and substitutes in the market. |
5 Zambia Surimi Market Trends |
6 Zambia Surimi Market Segmentations |
6.1 Zambia Surimi Market, By Source |
6.1.1 Overview and Analysis |
6.1.2 Zambia Surimi Market Revenues & Volume, By Alaska Pollock, 2022 - 2032F |
6.1.3 Zambia Surimi Market Revenues & Volume, By Itoyori, 2022 - 2032F |
6.1.4 Zambia Surimi Market Revenues & Volume, By Pacific Whiting, 2022 - 2032F |
6.1.5 Zambia Surimi Market Revenues & Volume, By Silver Carp, 2022 - 2032F |
6.1.6 Zambia Surimi Market Revenues & Volume, By Others, 2022 - 2032F |
6.2 Zambia Surimi Market, By Packaging |
6.2.1 Overview and Analysis |
6.2.2 Zambia Surimi Market Revenues & Volume, By Chilled or Fresh, 2022 - 2032F |
6.2.3 Zambia Surimi Market Revenues & Volume, By Frozen, 2022 - 2032F |
6.3 Zambia Surimi Market, By End Use |
6.3.1 Overview and Analysis |
6.3.2 Zambia Surimi Market Revenues & Volume, By Households, 2022 - 2032F |
6.3.3 Zambia Surimi Market Revenues & Volume, By Hotels, Restaurants and Catering (HoReCa), 2022 - 2032F |
6.3.4 Zambia Surimi Market Revenues & Volume, By Food Processing, 2022 - 2032F |
6.3.5 Zambia Surimi Market Revenues & Volume, By Others, 2022 - 2032F |
6.4 Zambia Surimi Market, By Distribution Channel |
6.4.1 Overview and Analysis |
6.4.2 Zambia Surimi Market Revenues & Volume, By Direct Sales, 2022 - 2032F |
6.4.3 Zambia Surimi Market Revenues & Volume, By Retail Sales, 2022 - 2032F |
6.4.4 Zambia Surimi Market Revenues & Volume, By Supermarkets and Hypermarkets, 2022 - 2032F |
6.4.5 Zambia Surimi Market Revenues & Volume, By Online Retail, 2022 - 2032F |
6.4.6 Zambia Surimi Market Revenues & Volume, By Wet Markets and others, 2022 - 2032F |
7 Zambia Surimi Market Import-Export Trade Statistics |
7.1 Zambia Surimi Market Export to Major Countries |
7.2 Zambia Surimi Market Imports from Major Countries |
8 Zambia Surimi Market Key Performance Indicators |
8.1 Consumer engagement metrics on social media platforms, indicating increasing awareness and interest in surimi products. |
8.2 Number of new product launches and innovations in the surimi market, reflecting market growth and development. |
8.3 Retail distribution expansion metrics, showcasing the penetration of surimi products in different regions and outlets. |
9 Zambia Surimi Market - Opportunity Assessment |
9.1 Zambia Surimi Market Opportunity Assessment, By Source, 2022 & 2032F |
9.2 Zambia Surimi Market Opportunity Assessment, By Packaging, 2022 & 2032F |
9.3 Zambia Surimi Market Opportunity Assessment, By End Use, 2022 & 2032F |
9.4 Zambia Surimi Market Opportunity Assessment, By Distribution Channel, 2022 & 2032F |
10 Zambia Surimi Market - Competitive Landscape |
10.1 Zambia Surimi Market Revenue Share, By Companies, 2025 |
10.2 Zambia Surimi Market Competitive Benchmarking, By Operating and Technical Parameters |
11 Company Profiles |
12 Recommendations | 13 Disclaimer |
Global Go To Market Strategy - 2030
Export potential enables firms to identify high-growth global markets with greater confidence by combining advanced trade intelligence with a structured quantitative methodology. The framework analyzes emerging demand trends and country-level import patterns while integrating macroeconomic and trade datasets such as GDP and population forecasts, bilateral import–export flows, tariff structures, elasticity differentials between developed and developing economies, geographic distance, and import demand projections. Using weighted trade values from 2020–2024 as the base period to project country-to-country export potential for 2030, these inputs are operationalized through calculated drivers such as gravity model parameters, tariff impact factors, and projected GDP per-capita growth. Through an analysis of hidden potentials, demand hotspots, and market conditions that are most favorable to success, this method enables firms to focus on target countries, maximize returns, and global expansion with data, backed by accuracy.
By factoring in the projected importer demand gap that is currently unmet and could be potential opportunity, it identifies the potential for the Exporter (Country) among 190 countries, against the general trade analysis, which identifies the biggest importer or exporter.
To discover high-growth global markets and optimize your business strategy:
Click Here
Pricing
- Single User License$ 1,995
- Department License$ 2,400
- Site License$ 3,120
- Global License$ 3,795

Leadership Perspectives from Industry Events
Search
Thought Leadership and Analyst Meet


Our Clients
6WResearch In News
- India Air Conditioner Market Set for Strong Rebound in 2026 After Weather-Led Correction and GST-Driven Recovery: 6Wresearch
- ADAS in India: How Automatic Emergency Braking, Blind Spot Detection & Driver Monitoring are Transforming Road Safety
- Doha a strategic location for EV manufacturing hub: IPA Qatar
- Demand for luxury TVs surging in the GCC, says Samsung
- Empowering Growth: The Thriving Journey of Bangladesh’s Cable Industry
- Demand for luxury TVs surging in the GCC, says Samsung
Latest Reports
- Poland Fire Protection Systems Market (2026-2032)
- Cape Verde Portable Hand-Thrown Extinguisher Market (2026-2032)
- Canada Portable Hand-Thrown Extinguisher Market (2026-2032)
- Cameroon Portable Hand-Thrown Extinguisher Market (2026-2032)
- Burundi Portable Hand-Thrown Extinguisher Market (2026-2032)
- Burkina Faso Portable Hand-Thrown Extinguisher Market (2026-2032)
- Bulgaria Portable Hand-Thrown Extinguisher Market (2026-2032)
- Brunei Portable Hand-Thrown Extinguisher Market (2026-2032)
- Botswana Portable Hand-Thrown Extinguisher Market (2026-2032)
- Bosnia and Herzegovina Portable Hand-Thrown Extinguisher Market (2026-2032)
Industry Events and Analyst Meet

HIMTEX 2026

India Refining Summit 2026

India EV Show 2026

EV tech India Expo 2026

Auto Tech Asia 2026
Whitepaper
- Middle East & Africa Commercial Security Market Click here to view more.
- Middle East & Africa Fire Safety Systems & Equipment Market Click here to view more.
- GCC Drone Market Click here to view more.
- Middle East Lighting Fixture Market Click here to view more.
- GCC Physical & Perimeter Security Market Click here to view more.