Zimbabwe Artificial Flowers Market (2026-2032) | Value, Revenue, Forecast, Companies, Share, Analysis, Growth, Trends, Industry, Segmentation, Size & Outlook
Market Forecast By Material Type (Clay & Porcelain, Cotton & Silk, Leather & Nylon, Paper & Wax, Plastic & Polyester), By Application (Commercial, Residential) And Competitive Landscape
| Product Code: ETC4982704 | Publication Date: Nov 2023 | Updated Date: Feb 2026 | Product Type: Market Research Report | |
| Publisher: 6Wresearch | Author: Shubham Padhi | No. of Pages: 60 | No. of Figures: 30 | No. of Tables: 5 |
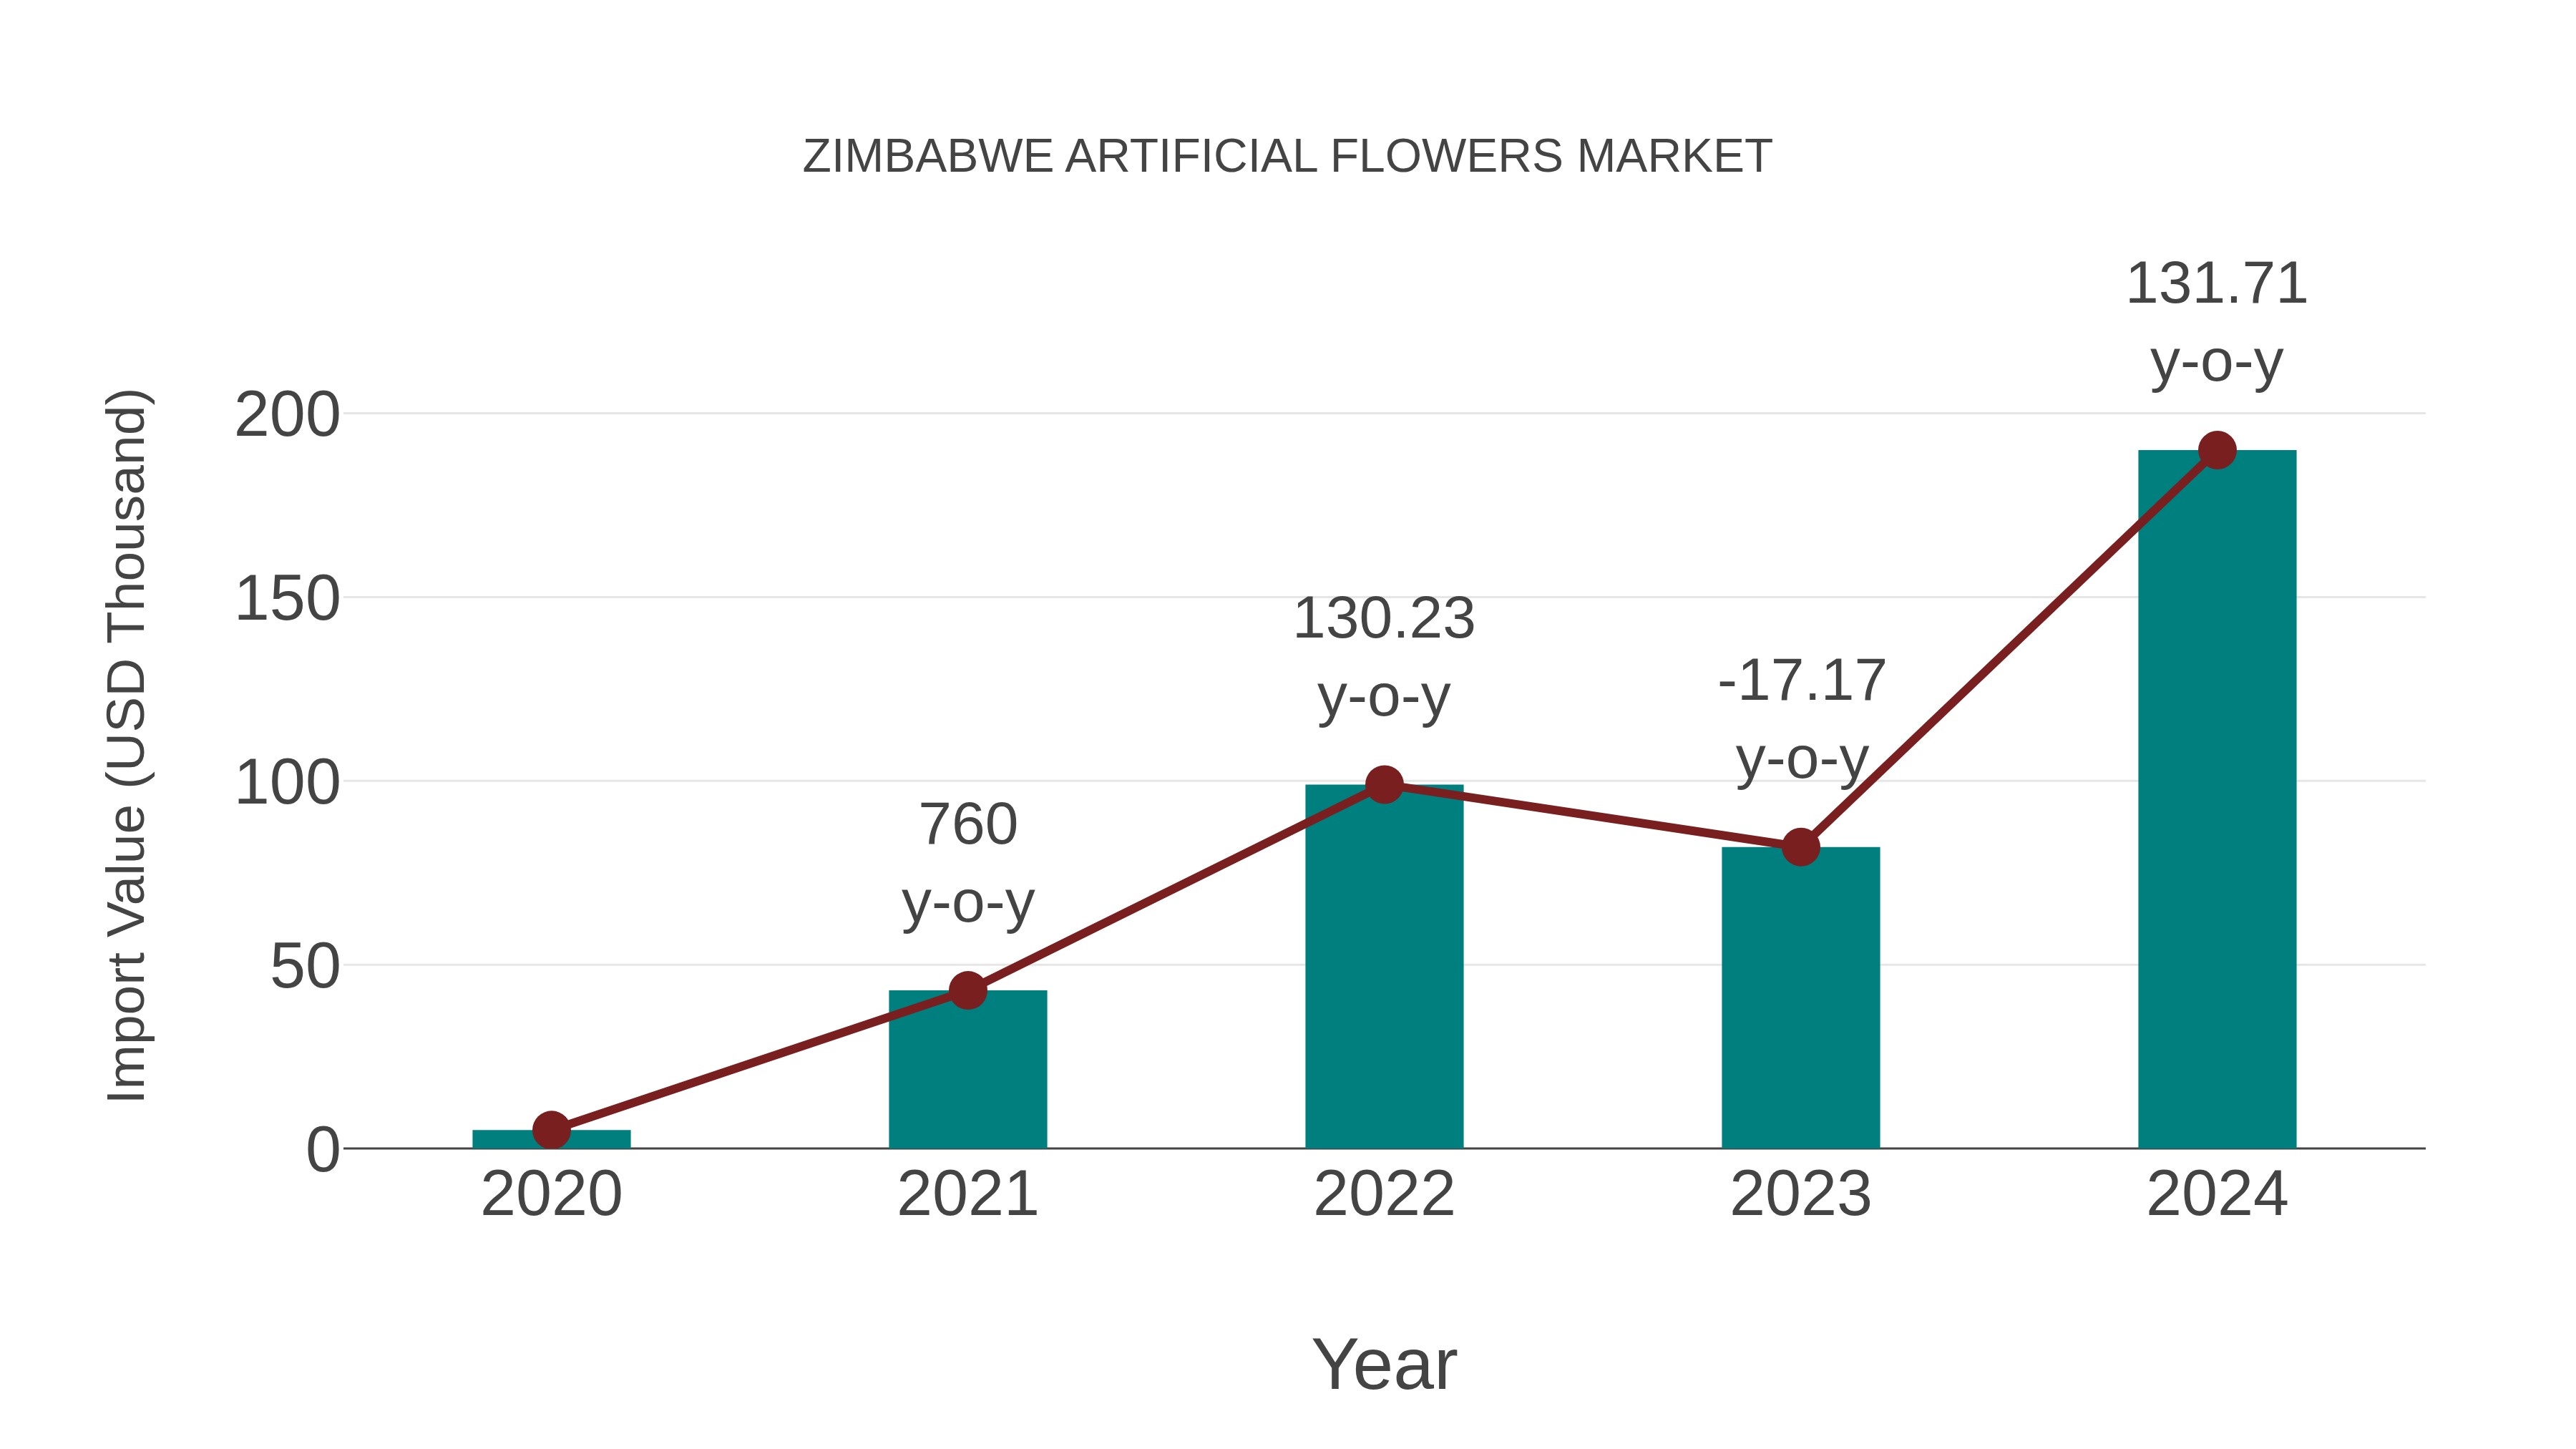
Zimbabwe Artificial Flowers Market: Import Trend Analysis
In the past year, the import trend for artificial flowers in the Zimbabwe market showed a steady increase. This growth was driven by rising consumer demand for decorative items and the availability of a wide variety of artificial flower options in the market.
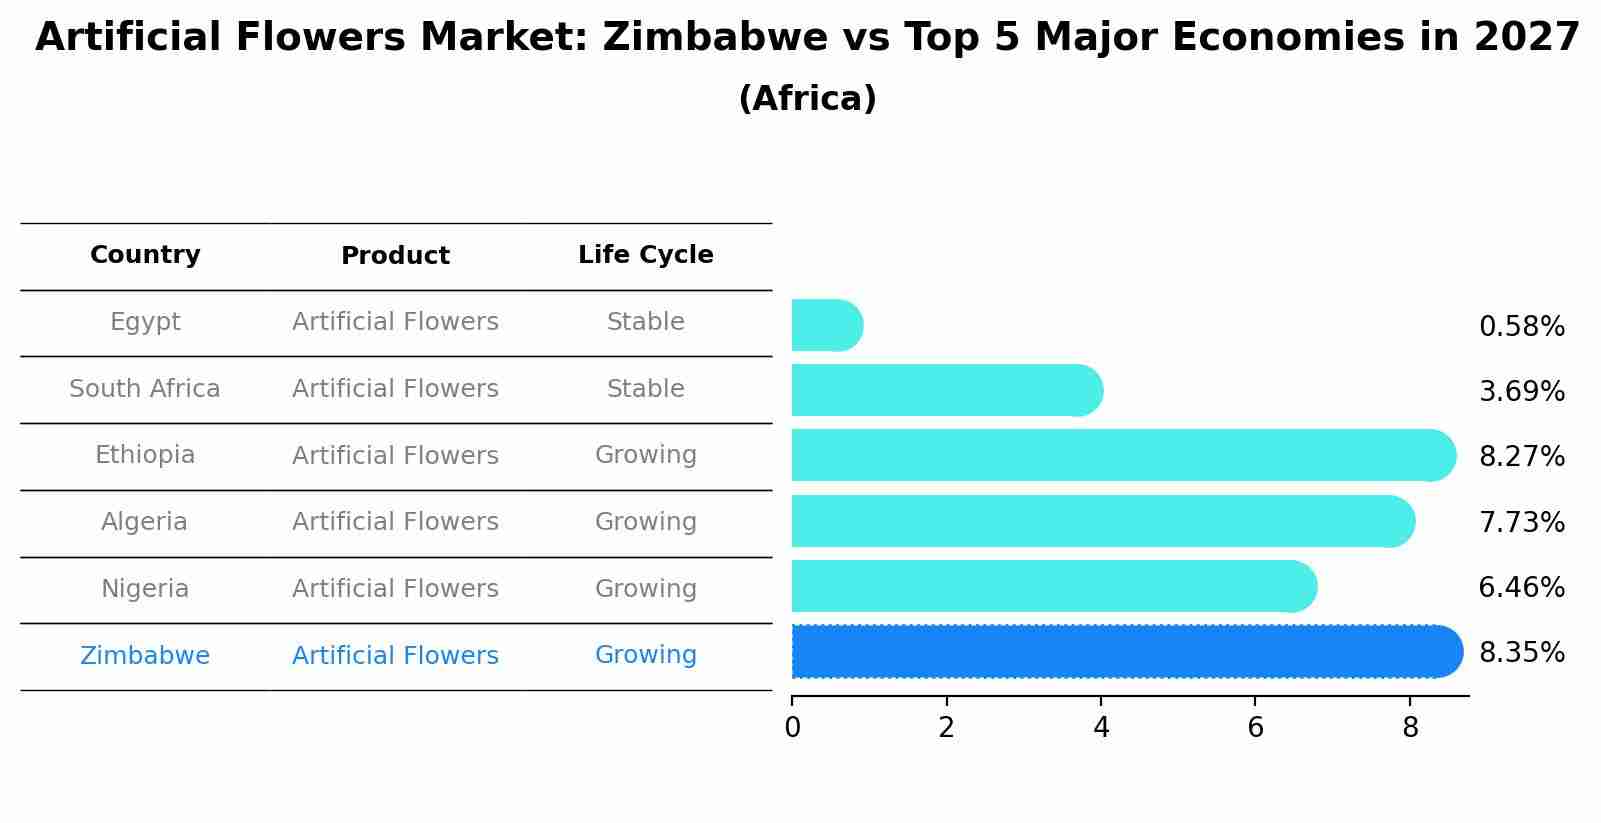
Artificial Flowers Market: Zimbabwe vs Top 5 Major Economies in 2027 (Africa)
Zimbabwe's Artificial Flowers market is anticipated to experience a growing growth rate of 8.35% by 2027, reflecting trends observed in the largest economy Egypt, followed by South Africa, Ethiopia, Algeria and Nigeria.
Key Highlights of the Report:
- Zimbabwe Artificial Flowers Market Outlook
- Market Size of Zimbabwe Artificial Flowers Market, 2025
- Forecast of Zimbabwe Artificial Flowers Market, 2032
- Historical Data and Forecast of Zimbabwe Artificial Flowers Revenues & Volume for the Period 2022-2032F
- Zimbabwe Artificial Flowers Market Trend Evolution
- Zimbabwe Artificial Flowers Market Drivers and Challenges
- Zimbabwe Artificial Flowers Price Trends
- Zimbabwe Artificial Flowers Porter`s Five Forces
- Zimbabwe Artificial Flowers Industry Life Cycle
- Historical Data and Forecast of Zimbabwe Artificial Flowers Market Revenues & Volume By Material Type for the Period 2022-2032F
- Historical Data and Forecast of Zimbabwe Artificial Flowers Market Revenues & Volume By Clay & Porcelain for the Period 2022-2032F
- Historical Data and Forecast of Zimbabwe Artificial Flowers Market Revenues & Volume By Cotton & Silk for the Period 2022-2032F
- Historical Data and Forecast of Zimbabwe Artificial Flowers Market Revenues & Volume By Leather & Nylon for the Period 2022-2032F
- Historical Data and Forecast of Zimbabwe Artificial Flowers Market Revenues & Volume By Paper & Wax for the Period 2022-2032F
- Historical Data and Forecast of Zimbabwe Artificial Flowers Market Revenues & Volume By Plastic & Polyester for the Period 2022-2032F
- Historical Data and Forecast of Zimbabwe Artificial Flowers Market Revenues & Volume By Application for the Period 2022-2032F
- Historical Data and Forecast of Zimbabwe Artificial Flowers Market Revenues & Volume By Commercial for the Period 2022-2032F
- Historical Data and Forecast of Zimbabwe Artificial Flowers Market Revenues & Volume By Residential for the Period 2022-2032F
- Zimbabwe Artificial Flowers Import Export Trade Statistics
- Market Opportunity Assessment By Material Type
- Market Opportunity Assessment By Application
- Zimbabwe Artificial Flowers Top Companies Market Share
- Zimbabwe Artificial Flowers Competitive Benchmarking By Technical and Operational Parameters
- Zimbabwe Artificial Flowers Company Profiles
- Zimbabwe Artificial Flowers Key Strategic Recommendations
Frequently Asked Questions About the Market Study (FAQs):
6Wresearch actively monitors the Zimbabwe Artificial Flowers Market and publishes its comprehensive annual report, highlighting emerging trends, growth drivers, revenue analysis, and forecast outlook. Our insights help businesses to make data-backed strategic decisions with ongoing market dynamics. Our analysts track relevent industries related to the Zimbabwe Artificial Flowers Market, allowing our clients with actionable intelligence and reliable forecasts tailored to emerging regional needs.
Yes, we provide customisation as per your requirements. To learn more, feel free to contact us on sales@6wresearch.com
1 Executive Summary |
2 Introduction |
2.1 Key Highlights of the Report |
2.2 Report Description |
2.3 Market Scope & Segmentation |
2.4 Research Methodology |
2.5 Assumptions |
3 Zimbabwe Artificial Flowers Market Overview |
3.1 Zimbabwe Country Macro Economic Indicators |
3.2 Zimbabwe Artificial Flowers Market Revenues & Volume, 2022 & 2032F |
3.3 Zimbabwe Artificial Flowers Market - Industry Life Cycle |
3.4 Zimbabwe Artificial Flowers Market - Porter's Five Forces |
3.5 Zimbabwe Artificial Flowers Market Revenues & Volume Share, By Material Type, 2022 & 2032F |
3.6 Zimbabwe Artificial Flowers Market Revenues & Volume Share, By Application, 2022 & 2032F |
4 Zimbabwe Artificial Flowers Market Dynamics |
4.1 Impact Analysis |
4.2 Market Drivers |
4.2.1 Increasing demand for low-maintenance decor solutions |
4.2.2 Rising focus on sustainable and eco-friendly products |
4.2.3 Growing preference for long-lasting and cost-effective alternatives to real flowers |
4.3 Market Restraints |
4.3.1 Limited awareness and availability in rural areas |
4.3.2 Seasonal fluctuations in demand |
4.3.3 Competition from fresh flowers and live plants market |
5 Zimbabwe Artificial Flowers Market Trends |
6 Zimbabwe Artificial Flowers Market Segmentations |
6.1 Zimbabwe Artificial Flowers Market, By Material Type |
6.1.1 Overview and Analysis |
6.1.2 Zimbabwe Artificial Flowers Market Revenues & Volume, By Clay & Porcelain, 2022-2032F |
6.1.3 Zimbabwe Artificial Flowers Market Revenues & Volume, By Cotton & Silk, 2022-2032F |
6.1.4 Zimbabwe Artificial Flowers Market Revenues & Volume, By Leather & Nylon, 2022-2032F |
6.1.5 Zimbabwe Artificial Flowers Market Revenues & Volume, By Paper & Wax, 2022-2032F |
6.1.6 Zimbabwe Artificial Flowers Market Revenues & Volume, By Plastic & Polyester, 2022-2032F |
6.2 Zimbabwe Artificial Flowers Market, By Application |
6.2.1 Overview and Analysis |
6.2.2 Zimbabwe Artificial Flowers Market Revenues & Volume, By Commercial, 2022-2032F |
6.2.3 Zimbabwe Artificial Flowers Market Revenues & Volume, By Residential, 2022-2032F |
7 Zimbabwe Artificial Flowers Market Import-Export Trade Statistics |
7.1 Zimbabwe Artificial Flowers Market Export to Major Countries |
7.2 Zimbabwe Artificial Flowers Market Imports from Major Countries |
8 Zimbabwe Artificial Flowers Market Key Performance Indicators |
8.1 Customer satisfaction rate with artificial flowers quality |
8.2 Number of retail outlets stocking artificial flowers |
8.3 Growth rate of online sales for artificial flowers |
8.4 Percentage of repeat customers purchasing artificial flowers |
8.5 Rate of adoption of artificial flowers in event decorations |
9 Zimbabwe Artificial Flowers Market - Opportunity Assessment |
9.1 Zimbabwe Artificial Flowers Market Opportunity Assessment, By Material Type, 2022 & 2032F |
9.2 Zimbabwe Artificial Flowers Market Opportunity Assessment, By Application, 2022 & 2032F |
10 Zimbabwe Artificial Flowers Market - Competitive Landscape |
10.1 Zimbabwe Artificial Flowers Market Revenue Share, By Companies, 2025 |
10.2 Zimbabwe Artificial Flowers Market Competitive Benchmarking, By Operating and Technical Parameters |
11 Company Profiles |
12 Recommendations | 13 Disclaimer |
Global Go To Market Strategy - 2030
Export potential enables firms to identify high-growth global markets with greater confidence by combining advanced trade intelligence with a structured quantitative methodology. The framework analyzes emerging demand trends and country-level import patterns while integrating macroeconomic and trade datasets such as GDP and population forecasts, bilateral import–export flows, tariff structures, elasticity differentials between developed and developing economies, geographic distance, and import demand projections. Using weighted trade values from 2020–2024 as the base period to project country-to-country export potential for 2030, these inputs are operationalized through calculated drivers such as gravity model parameters, tariff impact factors, and projected GDP per-capita growth. Through an analysis of hidden potentials, demand hotspots, and market conditions that are most favorable to success, this method enables firms to focus on target countries, maximize returns, and global expansion with data, backed by accuracy.
By factoring in the projected importer demand gap that is currently unmet and could be potential opportunity, it identifies the potential for the Exporter (Country) among 190 countries, against the general trade analysis, which identifies the biggest importer or exporter.
To discover high-growth global markets and optimize your business strategy:
Click Here
Pricing
- Single User License$ 1,995
- Department License$ 2,400
- Site License$ 3,120
- Global License$ 3,795

Leadership Perspectives from Industry Events
Search
Thought Leadership and Analyst Meet


Our Clients
6WResearch In News
- Doha a strategic location for EV manufacturing hub: IPA Qatar
- Demand for luxury TVs surging in the GCC, says Samsung
- Empowering Growth: The Thriving Journey of Bangladesh’s Cable Industry
- Demand for luxury TVs surging in the GCC, says Samsung
- Video call with a traditional healer? Once unthinkable, it’s now common in South Africa
- Intelligent Buildings To Smooth GCC’s Path To Net Zero
Latest Reports
- Poland Fire Protection Systems Market (2026-2032)
- Cape Verde Portable Hand-Thrown Extinguisher Market (2026-2032)
- Canada Portable Hand-Thrown Extinguisher Market (2026-2032)
- Cameroon Portable Hand-Thrown Extinguisher Market (2026-2032)
- Burundi Portable Hand-Thrown Extinguisher Market (2026-2032)
- Burkina Faso Portable Hand-Thrown Extinguisher Market (2026-2032)
- Bulgaria Portable Hand-Thrown Extinguisher Market (2026-2032)
- Brunei Portable Hand-Thrown Extinguisher Market (2026-2032)
- Botswana Portable Hand-Thrown Extinguisher Market (2026-2032)
- Bosnia and Herzegovina Portable Hand-Thrown Extinguisher Market (2026-2032)
Industry Events and Analyst Meet

HIMTEX 2026

India Refining Summit 2026

India EV Show 2026

EV tech India Expo 2026

Auto Tech Asia 2026
Whitepaper
- Middle East & Africa Commercial Security Market Click here to view more.
- Middle East & Africa Fire Safety Systems & Equipment Market Click here to view more.
- GCC Drone Market Click here to view more.
- Middle East Lighting Fixture Market Click here to view more.
- GCC Physical & Perimeter Security Market Click here to view more.