Zimbabwe Encapsulated Food Market (2026-2032) | Demand, Forecast, Strategy, Restraints, Trends, Value, Revenue, Consumer Insights, Pricing Analysis, Segments, Challenges, Drivers, Competitive, Competition, Supply, Companies, Analysis, Opportunities, Investment Trends, Growth, Share, Size, Outlook, Strategic Insights, Industry, Segmentation
Market Forecast By Raw Material (Acids, Flavoring Agents, Lipids, Bases & Buffers, Amino Acids & Peptides, Enzymes & Microorganisms, Antioxidants, Others), By Technology (Chemical, Physical), By Application (Dairy Products Animal Nutrition, Functional Food, Dietary Supplements, Confectionery Beverages, Bakery Products, Frozen Products and Others), By Shell Material (Hydrocolloids, Melts, Polymers, Lipids, Others) And Competitive Landscape
| Product Code: ETC11939771 | Publication Date: Apr 2025 | Updated Date: Feb 2026 | Product Type: Market Research Report | |
| Publisher: 6Wresearch | Author: Sachin Kumar Rai | No. of Pages: 65 | No. of Figures: 34 | No. of Tables: 19 |
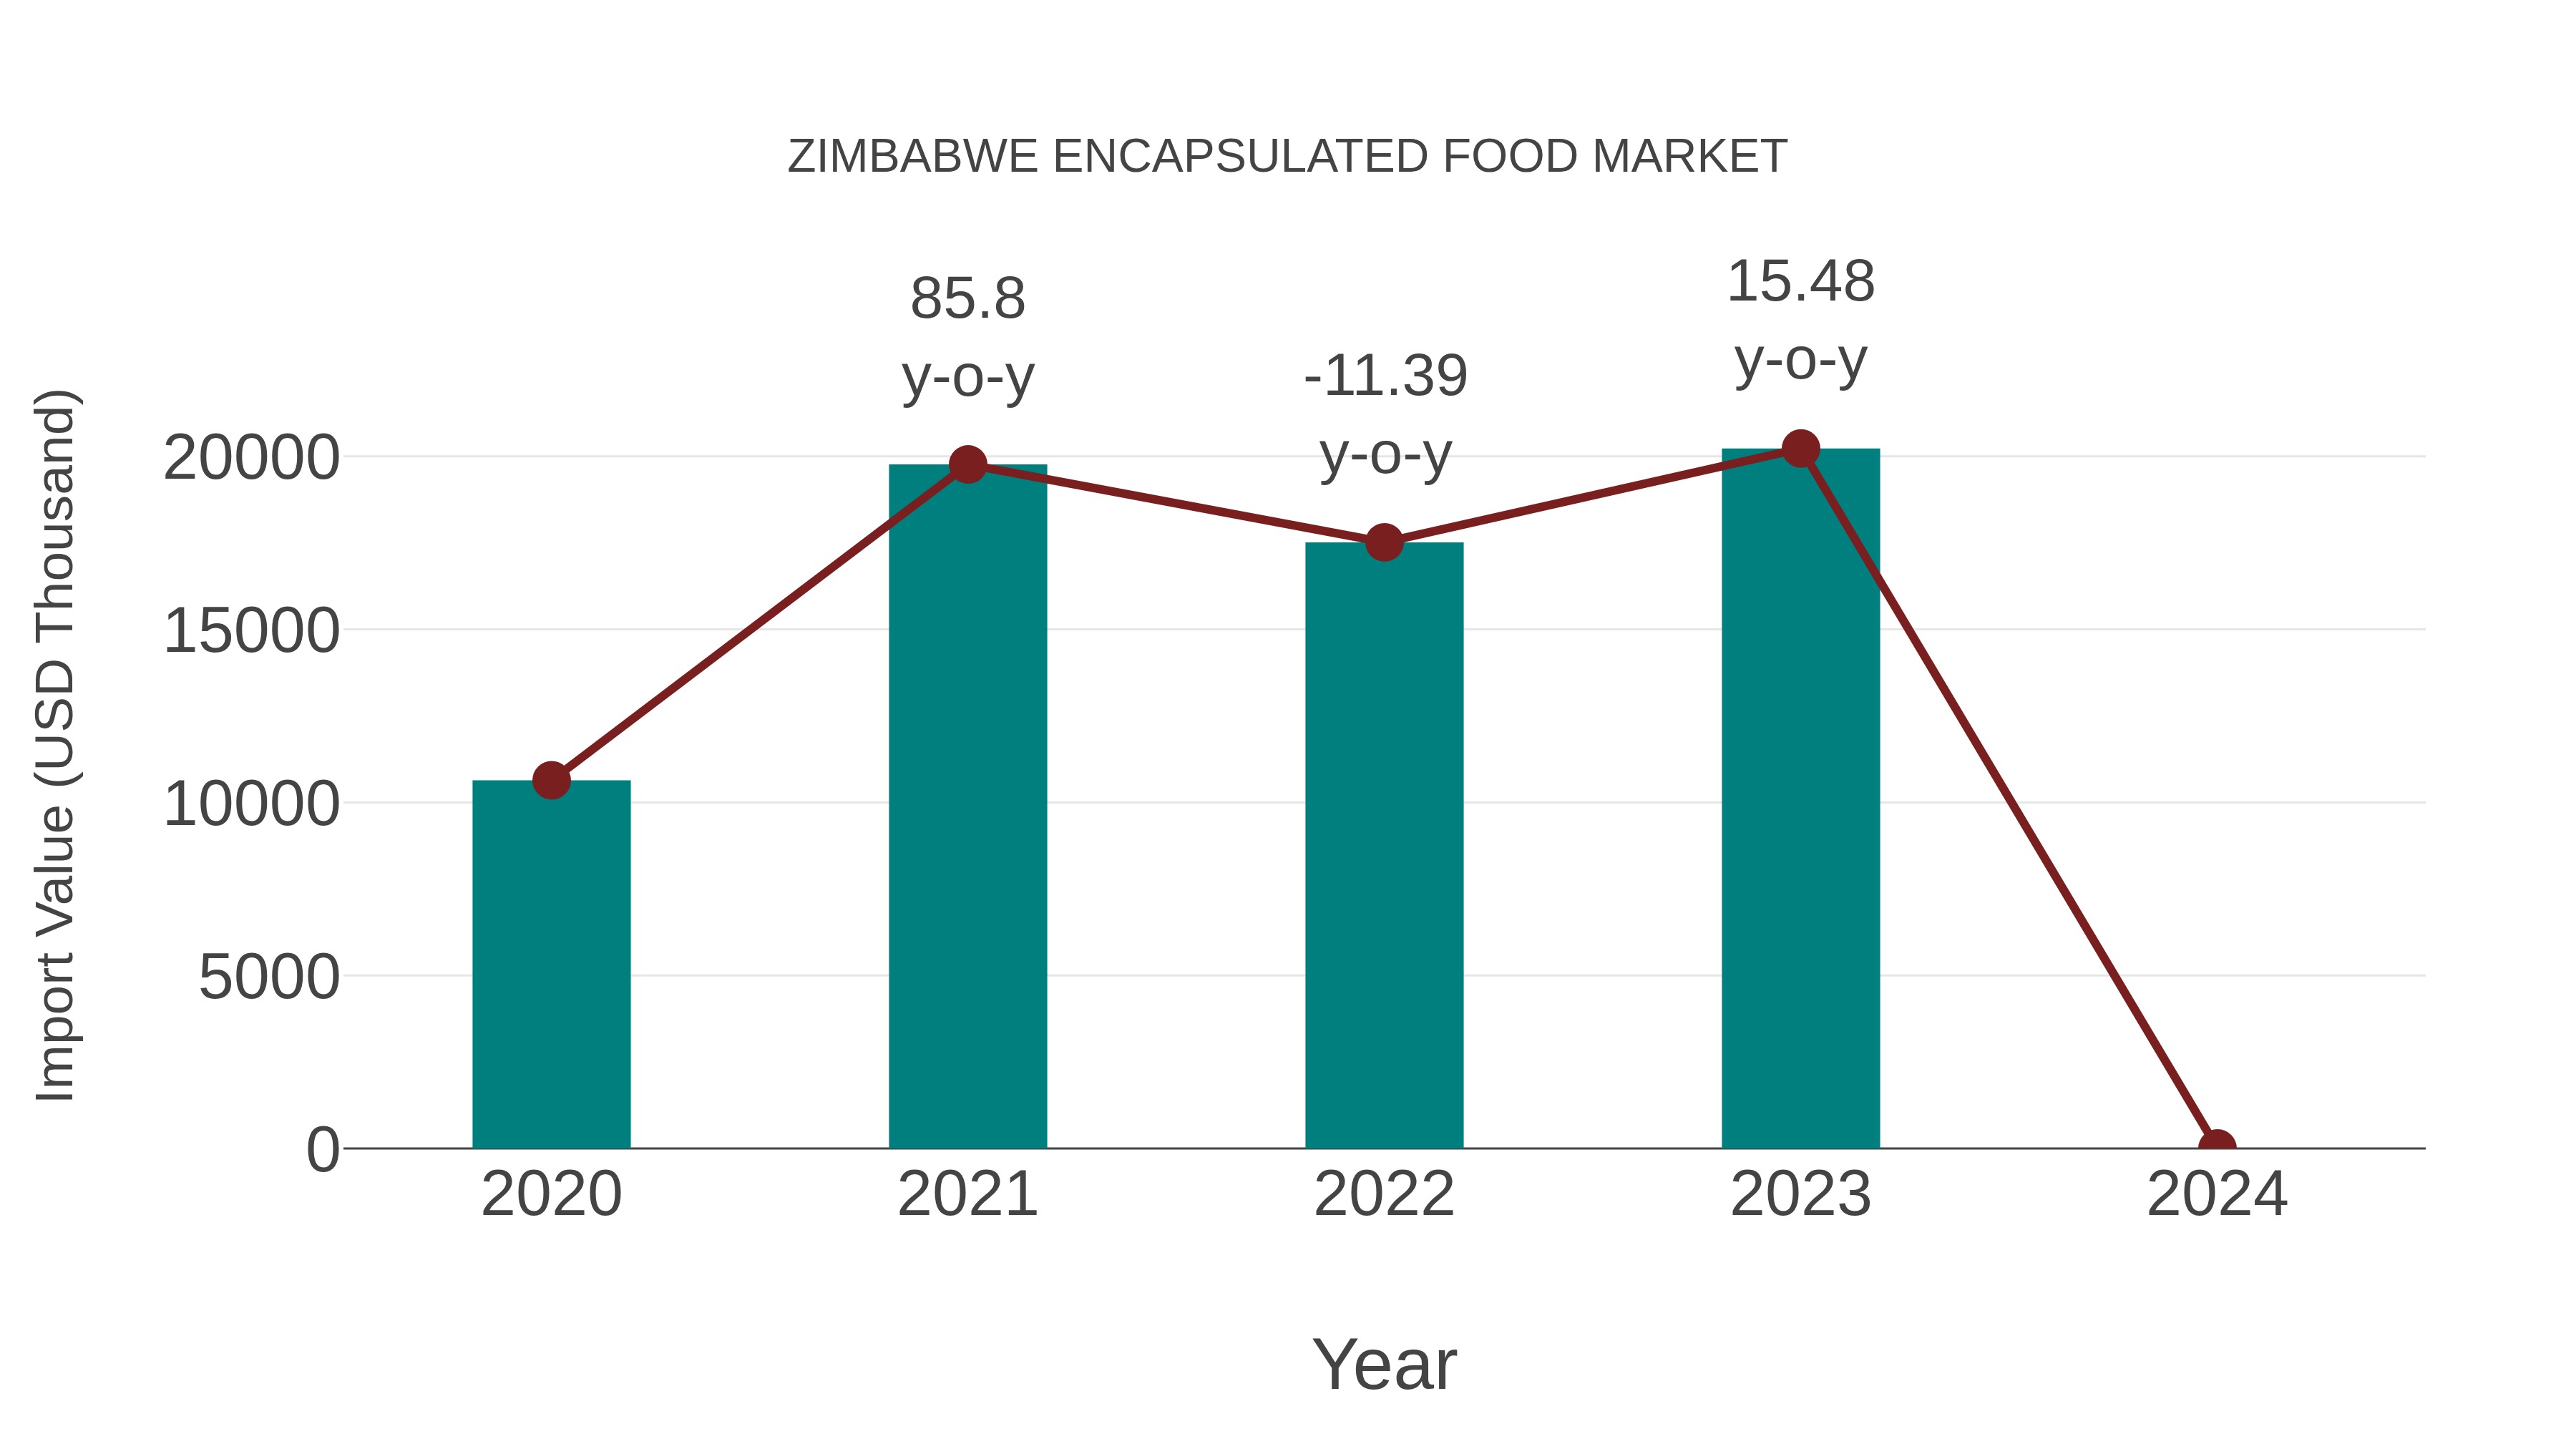
Zimbabwe Encapsulated Food Market: Import Trend Analysis
The import trend of Zimbabwe`s encapsulated food market from 2020 to 2024 showed a Compound Annual Growth Rate (CAGR) of 23.88%. In 2023-2024, the year-on-year growth rate was zero. This indicates a steady overall increase in imports during the period, reflecting sustained demand for encapsulated food products in Zimbabwe.
Key Highlights of the Report:
- Zimbabwe Encapsulated Food Market Outlook
- Market Size of Zimbabwe Encapsulated Food Market, 2025
- Forecast of Zimbabwe Encapsulated Food Market, 2032
- Historical Data and Forecast of Zimbabwe Encapsulated Food Revenues & Volume for the Period 2022-2032F
- Zimbabwe Encapsulated Food Market Trend Evolution
- Zimbabwe Encapsulated Food Market Drivers and Challenges
- Zimbabwe Encapsulated Food Price Trends
- Zimbabwe Encapsulated Food Porter's Five Forces
- Zimbabwe Encapsulated Food Industry Life Cycle
- Historical Data and Forecast of Zimbabwe Encapsulated Food Market Revenues & Volume By Raw Material for the Period 2022-2032F
- Historical Data and Forecast of Zimbabwe Encapsulated Food Market Revenues & Volume By Acids for the Period 2022-2032F
- Historical Data and Forecast of Zimbabwe Encapsulated Food Market Revenues & Volume By Flavoring Agents for the Period 2022-2032F
- Historical Data and Forecast of Zimbabwe Encapsulated Food Market Revenues & Volume By Lipids for the Period 2022-2032F
- Historical Data and Forecast of Zimbabwe Encapsulated Food Market Revenues & Volume By Bases & Buffers for the Period 2022-2032F
- Historical Data and Forecast of Zimbabwe Encapsulated Food Market Revenues & Volume By Amino Acids & Peptides for the Period 2022 - 2032F
- Historical Data and Forecast of Zimbabwe Encapsulated Food Market Revenues & Volume By Enzymes & Microorganisms for the Period 2022 - 2032F
- Historical Data and Forecast of Zimbabwe Encapsulated Food Market Revenues & Volume By Antioxidants for the Period 2022 - 2032F
- Historical Data and Forecast of Zimbabwe Acids Encapsulated Food Market Revenues & Volume By Others for the Period 2022 - 2032F
- Historical Data and Forecast of Zimbabwe Encapsulated Food Market Revenues & Volume By Technology for the Period 2022-2032F
- Historical Data and Forecast of Zimbabwe Encapsulated Food Market Revenues & Volume By Chemical for the Period 2022-2032F
- Historical Data and Forecast of Zimbabwe Encapsulated Food Market Revenues & Volume By Physical for the Period 2022-2032F
- Historical Data and Forecast of Zimbabwe Encapsulated Food Market Revenues & Volume By Application for the Period 2022-2032F
- Historical Data and Forecast of Zimbabwe Encapsulated Food Market Revenues & Volume By Dairy Products Animal Nutrition for the Period 2022-2032F
- Historical Data and Forecast of Zimbabwe Encapsulated Food Market Revenues & Volume By Functional Food for the Period 2022-2032F
- Historical Data and Forecast of Zimbabwe Encapsulated Food Market Revenues & Volume By Dietary Supplements for the Period 2022-2032F
- Historical Data and Forecast of Zimbabwe Encapsulated Food Market Revenues & Volume By Confectionery Beverages for the Period 2022-2032F
- Historical Data and Forecast of Zimbabwe Encapsulated Food Market Revenues & Volume By Bakery Products for the Period 2022 - 2032F
- Historical Data and Forecast of Zimbabwe Encapsulated Food Market Revenues & Volume By Frozen Products and Others for the Period 2022 - 2032F
- Historical Data and Forecast of Zimbabwe Encapsulated Food Market Revenues & Volume By Shell Material for the Period 2022-2032F
- Historical Data and Forecast of Zimbabwe Encapsulated Food Market Revenues & Volume By Hydrocolloids for the Period 2022-2032F
- Historical Data and Forecast of Zimbabwe Encapsulated Food Market Revenues & Volume By Melts for the Period 2022-2032F
- Historical Data and Forecast of Zimbabwe Encapsulated Food Market Revenues & Volume By Polymers for the Period 2022-2032F
- Historical Data and Forecast of Zimbabwe Encapsulated Food Market Revenues & Volume By Lipids for the Period 2022-2032F
- Historical Data and Forecast of Zimbabwe Encapsulated Food Market Revenues & Volume By Others for the Period 2022 - 2032F
- Zimbabwe Encapsulated Food Import Export Trade Statistics
- Market Opportunity Assessment By Raw Material
- Market Opportunity Assessment By Technology
- Market Opportunity Assessment By Application
- Market Opportunity Assessment By Shell Material
- Zimbabwe Encapsulated Food Top Companies Market Share
- Zimbabwe Encapsulated Food Competitive Benchmarking By Technical and Operational Parameters
- Zimbabwe Encapsulated Food Company Profiles
- Zimbabwe Encapsulated Food Key Strategic Recommendations
Frequently Asked Questions About the Market Study (FAQs):
6Wresearch actively monitors the Zimbabwe Encapsulated Food Market and publishes its comprehensive annual report, highlighting emerging trends, growth drivers, revenue analysis, and forecast outlook. Our insights help businesses to make data-backed strategic decisions with ongoing market dynamics. Our analysts track relevent industries related to the Zimbabwe Encapsulated Food Market, allowing our clients with actionable intelligence and reliable forecasts tailored to emerging regional needs.
Yes, we provide customisation as per your requirements. To learn more, feel free to contact us on sales@6wresearch.com
1 Executive Summary |
2 Introduction |
2.1 Key Highlights of the Report |
2.2 Report Description |
2.3 Market Scope & Segmentation |
2.4 Research Methodology |
2.5 Assumptions |
3 Zimbabwe Encapsulated Food Market Overview |
3.1 Zimbabwe Country Macro Economic Indicators |
3.2 Zimbabwe Encapsulated Food Market Revenues & Volume, 2022 & 2032F |
3.3 Zimbabwe Encapsulated Food Market - Industry Life Cycle |
3.4 Zimbabwe Encapsulated Food Market - Porter's Five Forces |
3.5 Zimbabwe Encapsulated Food Market Revenues & Volume Share, By Raw Material, 2022 & 2032F |
3.6 Zimbabwe Encapsulated Food Market Revenues & Volume Share, By Technology, 2022 & 2032F |
3.7 Zimbabwe Encapsulated Food Market Revenues & Volume Share, By Application, 2022 & 2032F |
3.8 Zimbabwe Encapsulated Food Market Revenues & Volume Share, By Shell Material, 2022 & 2032F |
4 Zimbabwe Encapsulated Food Market Dynamics |
4.1 Impact Analysis |
4.2 Market Drivers |
4.2.1 Increasing demand for convenient and ready-to-eat food products |
4.2.2 Rising urbanization and busy lifestyles leading to a preference for easy-to-prepare meals |
4.2.3 Growth in the tourism sector boosting the demand for portable and long-lasting food options |
4.3 Market Restraints |
4.3.1 Limited awareness and availability of encapsulated food products in remote or rural areas |
4.3.2 Concerns regarding the nutritional value and health impact of processed and encapsulated foods |
4.3.3 Price sensitivity among consumers due to economic challenges in Zimbabwe |
5 Zimbabwe Encapsulated Food Market Trends |
6 Zimbabwe Encapsulated Food Market, By Types |
6.1 Zimbabwe Encapsulated Food Market, By Raw Material |
6.1.1 Overview and Analysis |
6.1.2 Zimbabwe Encapsulated Food Market Revenues & Volume, By Raw Material, 2022 - 2032F |
6.1.3 Zimbabwe Encapsulated Food Market Revenues & Volume, By Acids, 2022 - 2032F |
6.1.4 Zimbabwe Encapsulated Food Market Revenues & Volume, By Flavoring Agents, 2022 - 2032F |
6.1.5 Zimbabwe Encapsulated Food Market Revenues & Volume, By Lipids, 2022 - 2032F |
6.1.6 Zimbabwe Encapsulated Food Market Revenues & Volume, By Bases & Buffers, 2022 - 2032F |
6.1.7 Zimbabwe Encapsulated Food Market Revenues & Volume, By Amino Acids & Peptides, 2022 - 2032F |
6.1.8 Zimbabwe Encapsulated Food Market Revenues & Volume, By Enzymes & Microorganisms, 2022 - 2032F |
6.1.9 Zimbabwe Encapsulated Food Market Revenues & Volume, By Others, 2022 - 2032F |
6.1.10 Zimbabwe Encapsulated Food Market Revenues & Volume, By Others, 2022 - 2032F |
6.2 Zimbabwe Encapsulated Food Market, By Technology |
6.2.1 Overview and Analysis |
6.2.2 Zimbabwe Encapsulated Food Market Revenues & Volume, By Chemical, 2022 - 2032F |
6.2.3 Zimbabwe Encapsulated Food Market Revenues & Volume, By Physical, 2022 - 2032F |
6.3 Zimbabwe Encapsulated Food Market, By Application |
6.3.1 Overview and Analysis |
6.3.2 Zimbabwe Encapsulated Food Market Revenues & Volume, By Dairy Products Animal Nutrition, 2022 - 2032F |
6.3.3 Zimbabwe Encapsulated Food Market Revenues & Volume, By Functional Food, 2022 - 2032F |
6.3.4 Zimbabwe Encapsulated Food Market Revenues & Volume, By Dietary Supplements, 2022 - 2032F |
6.3.5 Zimbabwe Encapsulated Food Market Revenues & Volume, By Confectionery Beverages, 2022 - 2032F |
6.3.6 Zimbabwe Encapsulated Food Market Revenues & Volume, By Bakery Products, 2022 - 2032F |
6.4 Zimbabwe Encapsulated Food Market, By Shell Material |
6.4.1 Overview and Analysis |
6.4.2 Zimbabwe Encapsulated Food Market Revenues & Volume, By Hydrocolloids, 2022 - 2032F |
6.4.3 Zimbabwe Encapsulated Food Market Revenues & Volume, By Melts, 2022 - 2032F |
6.4.4 Zimbabwe Encapsulated Food Market Revenues & Volume, By Polymers, 2022 - 2032F |
6.4.5 Zimbabwe Encapsulated Food Market Revenues & Volume, By Lipids, 2022 - 2032F |
6.4.6 Zimbabwe Encapsulated Food Market Revenues & Volume, By Others, 2022 - 2032F |
7 Zimbabwe Encapsulated Food Market Import-Export Trade Statistics |
7.1 Zimbabwe Encapsulated Food Market Export to Major Countries |
7.2 Zimbabwe Encapsulated Food Market Imports from Major Countries |
8 Zimbabwe Encapsulated Food Market Key Performance Indicators |
8.1 Average daily sales per retail outlet of encapsulated food products |
8.2 Number of new product launches and innovations in the encapsulated food market |
8.3 Percentage of repeat purchases by consumers for encapsulated food items |
9 Zimbabwe Encapsulated Food Market - Opportunity Assessment |
9.1 Zimbabwe Encapsulated Food Market Opportunity Assessment, By Raw Material, 2022 & 2032F |
9.2 Zimbabwe Encapsulated Food Market Opportunity Assessment, By Technology, 2022 & 2032F |
9.3 Zimbabwe Encapsulated Food Market Opportunity Assessment, By Application, 2022 & 2032F |
9.4 Zimbabwe Encapsulated Food Market Opportunity Assessment, By Shell Material, 2022 & 2032F |
10 Zimbabwe Encapsulated Food Market - Competitive Landscape |
10.1 Zimbabwe Encapsulated Food Market Revenue Share, By Companies, 2025 |
10.2 Zimbabwe Encapsulated Food Market Competitive Benchmarking, By Operating and Technical Parameters |
11 Company Profiles |
12 Recommendations |
13 Disclaimer |
Export potential assessment - trade Analytics for 2030
Export potential enables firms to identify high-growth global markets with greater confidence by combining advanced trade intelligence with a structured quantitative methodology. The framework analyzes emerging demand trends and country-level import patterns while integrating macroeconomic and trade datasets such as GDP and population forecasts, bilateral import–export flows, tariff structures, elasticity differentials between developed and developing economies, geographic distance, and import demand projections. Using weighted trade values from 2020–2024 as the base period to project country-to-country export potential for 2030, these inputs are operationalized through calculated drivers such as gravity model parameters, tariff impact factors, and projected GDP per-capita growth. Through an analysis of hidden potentials, demand hotspots, and market conditions that are most favorable to success, this method enables firms to focus on target countries, maximize returns, and global expansion with data, backed by accuracy.
By factoring in the projected importer demand gap that is currently unmet and could be potential opportunity, it identifies the potential for the Exporter (Country) among 190 countries, against the general trade analysis, which identifies the biggest importer or exporter.
To discover high-growth global markets and optimize your business strategy:
Click Here
Pricing
- Single User License$ 1,995
- Department License$ 2,400
- Site License$ 3,120
- Global License$ 3,795

Search
Thought Leadership and Analyst Meet


Our Clients
Latest Reports
- France Thermally Conductive Filler Dispersants Market (2026-2032) | Challenges, Restraints, Value, Share, Size, segmentation, Analysis, Trends, Investment Opportunities, Outlook, Pricing, Demand, Forecast, Revenue, Companies, Growth, Drivers, Strategy, Insights, Competition
- Egypt Thermally Conductive Filler Dispersants Market (2026-2032) | Competition, Forecast, Strategy, Value, Insights, Outlook, Investment Opportunities, Pricing, Demand, Share, segmentation, Drivers, Size, Companies, Restraints, Growth, Trends, Revenue, Challenges, Analysis
- Czech Republic Thermally Conductive Filler Dispersants Market (2026-2032) | Forecast, Pricing, Analysis, Drivers, Insights, Size, Demand, Growth, Challenges, segmentation, Competition, Outlook, Trends, Investment Opportunities, Companies, Strategy, Revenue, Share, Value, Restraints
- Colombia Thermally Conductive Filler Dispersants Market (2026-2032) | segmentation, Trends, Share, Drivers, Strategy, Companies, Demand, Insights, Size, Challenges, Value, Competition, Analysis, Growth, Revenue, Restraints, Forecast, Pricing, Outlook, Investment Opportunities
- China Thermally Conductive Filler Dispersants Market (2026-2032) | Restraints, Investment Opportunities, Pricing, Companies, Share, Size, Challenges, Trends, Outlook, Value, Analysis, Competition, Revenue, Drivers, Forecast, Demand, Insights, Growth, Strategy, segmentation
- Chile Thermally Conductive Filler Dispersants Market (2026-2032) | Investment Opportunities, Trends, Value, Restraints, Share, Companies, Forecast, segmentation, Pricing, Challenges, Demand, Size, Analysis, Drivers, Outlook, Growth, Competition, Strategy, Revenue, Insights
- Cambodia Thermally Conductive Filler Dispersants Market (2026-2032) | Analysis, Share, Outlook, Strategy, Pricing, Demand, Size, Growth, segmentation, Insights, Revenue, Forecast, Challenges, Competition, Companies, Investment Opportunities, Trends, Restraints, Value, Drivers
- Brazil Thermally Conductive Filler Dispersants Market (2026-2032) | Restraints, Forecast, Competition, Size, Revenue, Value, Investment Opportunities, Trends, Insights, Outlook, Growth, Analysis, Drivers, segmentation, Pricing, Challenges, Strategy, Share, Companies, Demand
- Bangladesh Thermally Conductive Filler Dispersants Market (2026-2032) | Restraints, Trends, Analysis, Competition, Insights, Forecast, Value, Investment Opportunities, Pricing, Share, Demand, Outlook, Revenue, segmentation, Companies, Drivers, Growth, Size, Challenges, Strategy
- Bahrain Thermally Conductive Filler Dispersants Market (2026-2032) | Trends, Outlook, Pricing, Demand, Value, Competition, Forecast, Growth, segmentation, Revenue, Companies, Analysis, Insights, Size, Drivers, Challenges, Strategy, Investment Opportunities, Share, Restraints
Industry Events and Analyst Meet

HIMTEX 2026

India Refining Summit 2026

India EV Show 2026

EV tech India Expo 2026

Auto Tech Asia 2026
Whitepaper
- Middle East & Africa Commercial Security Market Click here to view more.
- Middle East & Africa Fire Safety Systems & Equipment Market Click here to view more.
- GCC Drone Market Click here to view more.
- Middle East Lighting Fixture Market Click here to view more.
- GCC Physical & Perimeter Security Market Click here to view more.
6WResearch In News
- Doha a strategic location for EV manufacturing hub: IPA Qatar
- Demand for luxury TVs surging in the GCC, says Samsung
- Empowering Growth: The Thriving Journey of Bangladesh’s Cable Industry
- Demand for luxury TVs surging in the GCC, says Samsung
- Video call with a traditional healer? Once unthinkable, it’s now common in South Africa
- Intelligent Buildings To Smooth GCC’s Path To Net Zero