GCC Thermal Imaging Systems Market (2019-2025) | Analysis, Size, Share, Revenue, Trends, Growth, Forecast, Outlook, Value & Segmentation
Market Forecast By Product Types (Fixed Mounted and Handheld), By Technology (Cooled and Uncooled), By Verticals (Industrial, Military and Commercial), By Countries (Saudi Arabia, UAE, Qatar, Kuwait, Oman and Bahrain) and Competitive Landscape
| Product Code: ETC000620 | Publication Date: Jul 2019 | Updated Date: Oct 2025 | Product Type: Report | |
| Publisher: 6Wresearch | Author: Ravi Bhandari | No. of Pages: 210 | No. of Figures: 127 | No. of Tables: 13 |
Latest 2023 Developments of the GCC Thermal Imaging Systems Market
GCC Thermal Imaging Systems Market witnessed the recent advancements in cooled mercury cadmium telluride (MCT or HgCdTe) infrared detector technology that has made the development of high-performance infrared cameras possible for use in a wide variety of demanding thermal imaging applications. Companies have miniaturized IR and thermal imaging sensors, making them highly efficient & portable and increasing their ease of use. AI-enabled thermal detection platforms such as IOT, digital twin, smart robots and others have also been developed to monitor real-time production in manufacturing plants. Government authorities across several countries in the GCC region, for instance, the Saudi Central Board for Accreditation of Healthcare Institutions (SCBAHI) and Abu Dhabi Monitoring & Control Centre (ADMCC) have implemented certain rules and regulations for the mandatory use of thermal imaging systems for predictive and preventive maintenance and green building projects.
Mergers and Acquisitions:
- In August 2021, 3M Co. agreed to buy Acelity Inc.
- In May 2021, eledyne Technologies Incorporated acquired FLIR Systems, Inc.
GCC Thermal Imaging Systems Market Synopsis
The oil and gas sector and other related industries are the major areas of application for the thermal imaging systems Market. The development of these domains in the GCC region would prove to be beneficial for the growth of the thermal imaging systems market. Another area where such systems are commonly deployed is the military vertical. The growing conflicts and insurgency issues across the borders of many Arab countries would also require the deployment of more thermal imaging systems over the coming years.According to 6Wresearch, GCC Thermal Imaging Systems Market size is projected to grow at a CAGR of 3.9% during 2019-2025. Government authorities across several countries in the GCC region, for instance, the Saudi Central Board for Accreditation of Healthcare Institutions (SCBAHI) and Abu Dhabi Monitoring & Control Centre (ADMCC) have implemented certain rules and regulations for the mandatory use of thermal imaging systems for predictive and preventive maintenance and green building projects. Also, thermal imaging systems are widely used across the industrial domain for several applications such as detection, testing, maintenance, and security & surveillance. Thus, growing industrial and commercial segments would drive GCC thermal imaging systems market forecast period revenues.
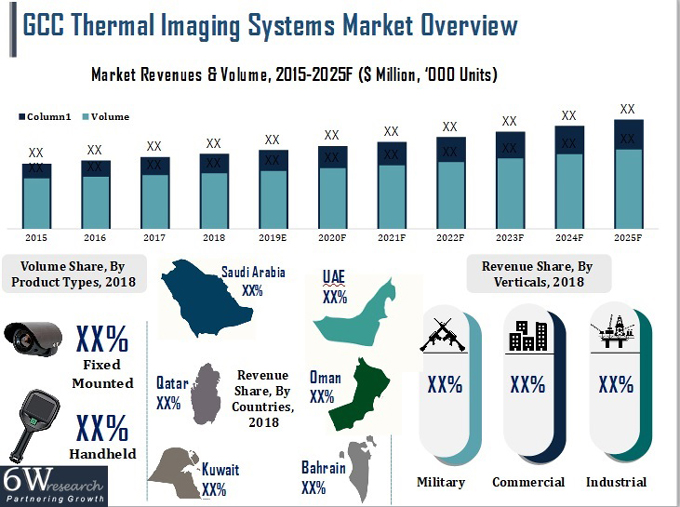 On the basis of technology, uncooled thermal imaging systems are generally preferred over their cooled counterparts and have captured a key pie in the overall GCC thermal imaging systems market share. Also, cooled thermal imaging systems are relatively expensive owing to the high cost of the lens and thermal detectors used in them and due to such systems having very specific areas of industrial applications. The high price is also a major restraint for the low demand for fixed-mounted systems in the overall GCC thermal imaging systems market.
The GCC thermal imaging systems market report comprehensively covers the market by product types, technology, verticals, and countries. The GCC thermal imaging systems market outlook report provides an unbiased and detailed analysis of the GCC thermal imaging systems market trends, opportunities, high growth areas and market drivers which would help the stakeholders to devise and align their market strategies according to the current and future market dynamics. GCC Thermal Imaging Systems Market This market product has a type, technology, and verticals. The report is all about unbiased and analysis of the market trends, high-growth areas. There are GCC region applications such as electrical faults in high voltage, pipe inspection, detection, and oil/gas leakage. The thermal imaging system market is used across the industrial and in many domains such as testing, security & surveillance, and detection. There is more scope for growth in the GCC thermal imaging system market in the forecast period.
GCC thermal imaging system market is a rapidly growing industry in the market. There are a lot of applications such as pipe inspection, oil/gas leakage detection, and electrical faults in high voltage. The thermal imaging system market used numerous military applications in the GCC. According to the research thermal imaging system market going to grow more in the upcoming years. There are government authorities in several countries in the GCC region such as the Abu Dhabi Monitoring & Control Centre (ADMCC) and the Saudi Central Board for Accreditation of Healthcare Institutions (SCBAHI). The thermal imaging system used several applications such as maintenance, detection, testing, and security & surveillance.
Key Highlights of the Report:
- GCC Thermal Imaging Systems Market Overview
- GCC Thermal Imaging Systems Market Outlook
- GCC Thermal Imaging Systems Market Forecast
- Historical Data of GCC Thermal Imaging Systems Market Revenues and Volume for the Period 2015-2018
- GCC Thermal Imaging Systems Market Size & Forecast of GCC Thermal Imaging Systems Market Revenues and Volume until 2025
- Historical Data of Saudi Arabia, UAE, Qatar, Kuwait, Bahrain, and Oman Thermal Imaging Systems Market Revenues and Volume for the Period 2015-2018
- Market Size & Forecast of Saudi Arabia, UAE, Qatar, Kuwait, Bahrain, and Oman Thermal Imaging Systems Market Revenues and Volume until 2025
- Historical Data of Saudi Arabia, UAE, Qatar, Kuwait, Bahrain, and Oman Thermal Imaging Systems Market Revenues and Volume, by Product Types, for the Period 2015- 2018
- Market Size & Forecast of Saudi Arabia, UAE, Qatar, Kuwait, Bahrain, and Oman Thermal Imaging Systems Market Revenues and Volume, by Product Types, until 2025
- Historical Data of Saudi Arabia, UAE, Qatar, Kuwait, Bahrain, and Oman Thermal Imaging Systems MarketRevenues and Volume, by Technology, for the Period 2015- 2018
- Market Size & Forecast of Saudi Arabia, UAE, Qatar, Kuwait, Bahrain, and Oman Thermal Imaging Systems Market Revenues and Volume, by Technology, until 2025
- Historical Data of Saudi Arabia, UAE, Qatar, Kuwait, Bahrain, and Oman Thermal Imaging Systems Market Revenues and Volume, by Verticals, for the Period 2015-2018
- Market Size & Forecast of Saudi Arabia, UAE, Qatar, Kuwait, Bahrain, and Oman Thermal Imaging Systems Market Revenues and Volume, by Verticals, until 2025
- Market Drivers and Restraints
- GCC Thermal Imaging Systems Market Trends and Industry Life Cycle
- Porter's Five Force Analysis and Market Opportunity Assessment
- GCC Thermal Imaging Systems Market Shares, By Players
- GCC Thermal Imaging Systems Market Overview on Competitive Benchmarking
- Company Profiles
- Key Strategic Recommendations
Markets Covered:
The GCC thermal imaging systems market report provides a detailed analysis of the following market segments:
By Product Types
- Fixed Mounted
- Handheld
By Technology
- Cooled
- Uncooled
By Verticals
- Industrial
- Military
- Commercial
By Countries
- Saudi Arabia
- United Arab Emirates (UAE)
- Qatar
- Kuwait
- Oman
- Bahrain
Frequently Asked Questions About the Market Study (FAQs):
6Wresearch actively monitors the GCC Thermal Imaging Systems Market and publishes its comprehensive annual report, highlighting emerging trends, growth drivers, revenue analysis, and forecast outlook. Our insights help businesses to make data-backed strategic decisions with ongoing market dynamics. Our analysts track relevent industries related to the GCC Thermal Imaging Systems Market, allowing our clients with actionable intelligence and reliable forecasts tailored to emerging regional needs.
Yes, we provide customisation as per your requirements. To learn more, feel free to contact us on sales@6wresearch.com
| 1. Executive Summary |
| 2. Introduction |
| 2.1 Report Description |
| 2.2 Key Highlights of The Report |
| 2.3 Market Scope & Segmentation |
| 2.4 Research Methodology |
| 2.5 Assumptions |
| 3. GCC Thermal Imaging Systems Market Overview |
| 3.1 GCC Thermal Imaging Systems Market Revenues & Volume, 2015-2025F |
| 3.2 GCC Thermal Imaging Systems Market Revenues, By Countries, 2015-2025F |
| 3.3 GCC Thermal Imaging Systems Market- Industry Life Cycle |
| 3.4 GCC Thermal Imaging Systems Market- Porter’s Five Forces |
| 3.5 GCC Thermal Imaging Systems Market Revenue and Volume Share, By Product Types, 2018 & 2025F |
| 3.6 GCC Thermal Imaging Systems Market Revenue and Volume Share, By Technology, 2018 & 2025F |
| 3.7 GCC Thermal Imaging Systems Market Revenue Share, By Verticals, 2018 & 2025F |
| 3.8 GCC Thermal Imaging Systems Market Revenue Share, By Countries, 2018 & 2025F |
| 4. GCC Thermal Imaging Systems Market Dynamics |
| 4.1 Impact Analysis |
| 4.2 Market Drivers |
| 4.2.1 Increasing demand for thermal imaging systems in security and surveillance applications in the GCC region. |
| 4.2.3 Rising investments in infrastructure development projects driving the need for thermal imaging systems in construction and building applications. |
| 4.3 Market Restraints |
| 4.3.1 High initial cost of thermal imaging systems limiting adoption, especially among small and medium-sized enterprises. |
| 4.3.2 Lack of awareness and technical expertise among end-users hindering market growth. |
| 4.3.3 Stringent regulations and export controls impacting the import and distribution of thermal imaging systems in the GCC region. |
| 5. GCC Thermal Imaging Systems Market Trends |
| 6. Saudi Arabia Thermal Imaging Systems Market Overview |
| 6.1 Saudi Arabia Country Indicators |
| 6.2 Saudi Arabia Thermal Imaging Systems Market Revenues & Volumes, 2015-2025F |
| 6.3 Saudi Arabia Thermal Imaging Systems Market Revenue and Volume Share, By Product Types, 2018 & 2025F |
| 6.3.1 Saudi Arabia Thermal Imaging Systems Market Revenues and Volume, By Product Types, 2015-2025F |
| 6.4 Saudi Arabia Thermal Imaging Systems Market Revenue and Volume Share, By Technology, 2018 & 2025F |
| 6.4.1 Saudi Arabia Thermal Imaging Systems Market Revenues and Volume, By Technology, 2015-2025F |
| 6.5 Saudi Arabia Thermal Imaging Systems Market Revenue Share, By Verticals, 2018 & 2025F |
| 6.5.1 Saudi Arabia Thermal Imaging Systems Market Revenues, By Industrial Vertical, 2015-2025F |
| 6.5.1.1 Saudi Arabia Industrial Sector Outlook |
| 6.5.2 Saudi Arabia Thermal Imaging Systems Market Revenues, By Military Vertical, 2015-2025F |
| 6.5.2.1 Saudi Arabia Military Sector Outlook |
| 6.5.3 Saudi Arabia Thermal Imaging Systems Market Revenues, By Commercial Vertical, 2015-2025F |
| 6.5.3.1 Saudi Arabia Commercial Sector Outlook |
| 6.6 Saudi Arabia Thermal Imaging Systems Market Key Performance Indicators |
| 66.2 Average utilization rate of thermal imaging systems across different industries. |
| 66.3 Rate of technological advancements and innovations in thermal imaging technologies adopted by companies in the GCC region. |
| 6.6.1 Saudi Arabia Government Spending Outlook |
| 6.6.2 Major Infrastructure Projects in Saudi Arabia |
| 6.7 Saudi Arabia Thermal Imaging Systems Market Opportunity Assessment |
| 6.7.1 Saudi Arabia Thermal Imaging Systems Market Opportunity Assessment, By Product Types, 2025F |
| 6.7.2 Saudi Arabia Thermal Imaging Systems Market Opportunity Assessment, By Technology, 2025F |
| 7. UAE Thermal Imaging Systems Market Overview |
| 7.1 UAE Country Indicators |
| 7.2 UAE Thermal Imaging Systems Market Revenues & Volumes, 2015-2025F |
| 7.3 UAE Thermal Imaging Systems Market Revenue and Volume Share, By Product Types, 2018 & 2025F |
| 7.3.1 UAE Thermal Imaging Systems Market Revenues and Volume, By Product Types, 2015-2025F |
| 7.4 UAE Thermal Imaging Systems Market Revenue and Volume Share, By Technology, 2018 & 2025F |
| 7.4.1 UAE Thermal Imaging Systems Market Revenues and Volume, By Technology, 2015-2025F |
| 7.5 UAE Thermal Imaging Systems Market Revenue Share, By Verticals, 2018 & 2025F |
| 7.5.1 UAE Thermal Imaging Systems Market Revenues, By Industrial Vertical, 2015-2025F |
| 7.5.1.1 UAE Industrial Sector Outlook |
| 7.5.2 UAE Thermal Imaging Systems Market Revenues, By Military Vertical, 2015-2025F |
| 7.5.3 UAE Thermal Imaging Systems Market Revenues, By Commercial Vertical, 2015-2025F |
| 7.5.3.1 UAE Commercial Sector Outlook |
| 7.6 UAE Thermal Imaging Systems Market Key Performance Indicators |
| 7.6.1 UAE Government Spending Outlook |
| 7.6.2 Major Infrastructure Projects in UAE |
| 7.7 UAE Thermal Imaging Systems Market Opportunity Assessment |
| 7.7.1 UAE Thermal Imaging Systems Market Opportunity Assessment, By Product Types, 2025F |
| 7.7.2 UAE Thermal Imaging Systems Market Opportunity Assessment, By Technology, 2025F |
| 8. Qatar Thermal Imaging Systems Market Overview |
| 8.1 Qatar Country Indicators |
| 8.2 Qatar Thermal Imaging Systems Market Revenues & Volumes, 2015-2025F |
| 8.3 Qatar Thermal Imaging Systems Market Revenue and Volume Share, By Product Types, 2018 & 2025F |
| 8.3.1 Qatar Thermal Imaging Systems Market Revenues and Volume, By Product Types, 2015-2025F |
| 8.4 Qatar Thermal Imaging Systems Market Revenue and Volume Share, By Technology, 2018 & 2025F |
| 8.4.1 Qatar Thermal Imaging Systems Market Revenues and Volume, By Technology, 2015-2025F |
| 8.5 Qatar Thermal Imaging Systems Market Revenue Share, By Verticals, 2018 & 2025F |
| 8.5.1 Qatar Thermal Imaging Systems Market Revenues, By Industrial Vertical, 2015-2025F |
| 8.5.1.1 Qatar Industrial Sector Outlook |
| 8.5.2 Qatar Thermal Imaging Systems Market Revenues, By Military Vertical, 2015-2025F |
| 8.5.3 Qatar Thermal Imaging Systems Market Revenues, By Commercial Vertical, 2015-2025F |
| 8.5.3.1 Qatar Commercial Sector Outlook |
| 8.6 Qatar Thermal Imaging Systems Market Key Performance Indicators |
| 8.6.1 Qatar Government Spending Outlook |
| 8.7 Qatar Thermal Imaging Systems Market Opportunity Assessment |
| 8.7.1 Qatar Thermal Imaging Systems Market Opportunity Assessment, By Product Types, 2025F |
| 8.7.2 Qatar Thermal Imaging Systems Market Opportunity Assessment, By Technology, 2025F |
| 9. Kuwait Thermal Imaging Systems Market Overview |
| 9.1 Kuwait Country Indicators |
| 9.2 Kuwait Thermal Imaging Systems Market Revenues & Volumes, 2015-2025F |
| 9.3 Kuwait Thermal Imaging Systems Market Revenue and Volume Share, By Product Types, 2018 & 2025F |
| 9.3.1 Kuwait Thermal Imaging Systems Market Revenues and Volume, By Product Types, 2015-2025F |
| 9.4 Kuwait Thermal Imaging Systems Market Revenue and Volume Share, By Technology, 2018 & 2025F |
| 9.4.1 Kuwait Thermal Imaging Systems Market Revenues and Volume, By Technology, 2015-2025F |
| 9.5 Kuwait Thermal Imaging Systems Market Revenue Share, By Verticals, 2018 & 2025F |
| 9.5.1 Kuwait Thermal Imaging Systems Market Revenues, By Industrial Vertical, 2015-2025F |
| 9.5.1.1 Kuwait Industrial Sector Outlook |
| 9.5.2 Kuwait Thermal Imaging Systems Market Revenues, By Military Vertical, 2015-2025F |
| 9.5.3 Kuwait Thermal Imaging Systems Market Revenues, By Commercial Vertical, 2015-2025F |
| 9.5.3.1 Kuwait Commercial Sector Outlook |
| 9.6 Kuwait Thermal Imaging Systems Market Key Performance Indicators |
| 9.6.1 Kuwait Government Spending Outlook |
| 9.6.2 Major Infrastructure Projects in Kuwait |
| 9.7 Kuwait Thermal Imaging Systems Market Opportunity Assessment |
| 9.7.1 Kuwait Thermal Imaging Systems Market Opportunity Assessment, By Product Types, 2025F |
| 9.7.2 Kuwait Thermal Imaging Systems Market Opportunity Assessment, By Technology, 2025F |
| 10. Oman Thermal Imaging Systems Market Overview |
| 10.1 Oman Country Indicators |
| 10.2 Oman Thermal Imaging Systems Market Revenues & Volumes, 2015-2025F |
| 10.3 Oman Thermal Imaging Systems Market Revenue and Volume Share, By Product Types, 2018 & 2025F |
| 10.3.1 Oman Thermal Imaging Systems Market Revenues and Volume, By Product Types, 2015-2025F |
| 10.4 Oman Thermal Imaging Systems Market Revenue and Volume Share, By Technology, 2018 & 2025F |
| 10.4.1 Oman Thermal Imaging Systems Market Revenues and Volume, By Technology, 2015-2025F |
| 10.5 Oman Thermal Imaging Systems Market Revenue Share, By Verticals, 2018 & 2025F |
| 10.5.1 Oman Thermal Imaging Systems Market Revenues, By Industrial Vertical, 2015-2025F |
| 10.5.1.1 Oman Industrial Sector Outlook |
| 10.5.2 Oman Thermal Imaging Systems Market Revenues, By Military Vertical, 2015-2025F |
| 10.5.3 Oman Thermal Imaging Systems Market Revenues, By Commercial Vertical, 2015-2025F |
| 10.5.3.1 Oman Commercial Sector Outlook |
| 10.6 Oman Thermal Imaging Systems Market Key Performance Indicators |
| 10.6.1 Oman Government Spending Outlook |
| 10.6.2 Oman Upcoming Projects |
| 10.7 Oman Thermal Imaging Systems Market Opportunity Assessment |
| 10.7.1 Oman Thermal Imaging Systems Market Opportunity Assessment, By Product Types, 2025F |
| 10.7.2 Oman Thermal Imaging Systems Market Opportunity Assessment, By Technology, 2025F |
| 11. Bahrain Thermal Imaging Systems Market Overview |
| 11.1 Bahrain Country Indicators |
| 11.2 Bahrain Thermal Imaging Systems Market Revenues & Volumes, 2015-2025F |
| 11.3 Bahrain Thermal Imaging Systems Market Revenue and Volume Share, By Product Types, 2018 & 2025F |
| 11.3.1 Bahrain Thermal Imaging Systems Market Revenues and Volume, By Product Types, 2015-2025F |
| 11.4 Bahrain Thermal Imaging Systems Market Revenue and Volume Share, By Technology, 2018 & 2025F |
| 11.4.1 Bahrain Thermal Imaging Systems Market Revenues and Volume, By Technology, 2015-2025F |
| 11.5 Bahrain Thermal Imaging Systems Market Revenue Share, By Verticals, 2018 & 2025F |
| 11.5.1 Bahrain Thermal Imaging Systems Market Revenues, By Industrial Vertical, 2015-2025F |
| 11.5.1.1 Bahrain Industrial Sector Outlook |
| 11.5.2 Bahrain Thermal Imaging Systems Market Revenues, By Military Vertical, 2015-2025F |
| 11.5.3 Bahrain Thermal Imaging Systems Market Revenues, By Commercial Vertical, 2015-2025F |
| 11.5.3.1 Bahrain Commercial Sector Outlook |
| 11.6 Bahrain Thermal Imaging Systems Market Key Performance Indicators |
| 11.6.1 Bahrain Government Spending Outlook |
| 11.6.2 Bahrain Project Awards Forecast |
| 11.6.3 Bahrain Upcoming Projects, By Sectors |
| 11.6.4 Bahrain Upcoming Projects, By Commercial Sector |
| 11.6.5 Bahrain Tourism Sector Outlook |
| 11.7 Bahrain Thermal Imaging Systems Market Opportunity Assessment |
| 11.7.1 Bahrain Thermal Imaging Systems Market Opportunity Assessment, By Product Types, 2025F |
| 11.7.2 Bahrain Thermal Imaging Systems Market Opportunity Assessment, By Technology, 2025F |
| 12. GCC Thermal Imaging Systems Market Opportunity Assessment |
| 12.1 GCC Thermal Imaging Systems Market Opportunity Assessment, By Product Types, 2025F |
| 12.2 GCC Thermal Imaging Systems Market Opportunity Assessment, By Technology, 2025F |
| 12.3 GCC Thermal Imaging Systems Market Opportunity Assessment, By Countries, 2025F |
| 13. GCC Thermal Imaging Systems Market Competitive Landscape |
| 13.1 Competitive Benchmarking, By Product Types |
| 13.2 GCC Thermal Imaging Systems Market Revenue Share, By Company, 2018 |
| 13.2.1 Saudi Arabia Thermal Imaging Systems Market Revenue Share, By Company, 2018 |
| 13.2.2 UAE Thermal Imaging Systems Market Revenue Share, By Company, 2018 |
| 13.2.3 Qatar Thermal Imaging Systems Market Ranking Share, By Company, 2018 |
| 13.2.4 Oman Thermal Imaging Systems Market Revenue Ranking, By Company, 2018 |
| 13.2.5 Bahrain Thermal Imaging Systems Market Revenue Ranking, By Company, 2018 |
| 13.2.6 Kuwait Thermal Imaging Systems Market Revenue Ranking, By Company, 2018 |
| 14. Company Profiles |
| 14.1 FLIR Systems, Inc |
| 14.2 3M Company |
| 14.3 Fluke Corporation |
| 14.4 Axis Communication AB |
| 14.5 Schneider Electric S.E |
| 14.6 BAE Systems Plc |
| 14.7 Hangzhou Hikvision Digital Technology Co., Ltd |
| 14.8 Zhejiang Dahua Technology Co., Ltd. |
| 14.9 Robert Bosch Middle East FZE |
| 15. Key Strategic Recommendations |
| 16. Disclaimer |
| List of Figures |
| Figure1. GCC Thermal Imaging System Market Revenues & Volume, 2015-2025F ($ Million, Units) |
| Figure2. GCC Thermal Imaging System Market Revenues, By Countries, 2018 ($ Million) |
| Figure3. GCC Thermal Imaging System Market - Industry Life Cycle, 2018 |
| Figure4. GCC Thermal Imaging Market Revenue and Volume Share, By Product Types, 2018 & 2025F |
| Figure5. GCC Thermal Imaging Market Revenue and Volume Share, By Technology, 2018 & 2025F |
| Figure6. GCC Thermal Imaging System Market Revenue Share, By Verticals, 2018 & 2025F |
| Figure7. GCC Thermal Imaging System Market Revenue Share, By Countries, 2018 & 2025F |
| Figure8. GCC and Middle East Construction Contract Awards 2018 |
| Figure9. Average Brent Spot Crude Oil Price, 2012-2019F ($ per Barrel) |
| Figure10. Saudi Arabia Thermal Imaging System Market Revenues & Volume, 2015-2025F ($ Million, Units) |
| Figure11. Saudi Arabia Thermal Imaging Market Revenue and Volume Share, By Product Types, 2018 & 2025F |
| Figure12. Saudi Arabia Fixed Mounted Thermal Imaging System Market Revenues and Volume, 2015-2025F ($ Million, Units) |
| Figure13. Saudi Arabia Hand Held Thermal Imaging System Market Revenues and Volume, 2015-2025F ($ Million, Units) |
| Figure14. Saudi Arabia Thermal Imaging System Market Revenue and Volume Share, By Technology, 2018 & 2025F |
| Figure15. Saudi Arabia Cooled Thermal System Imaging Market Revenues and Volume, 2015-2025F ($ Million, Units) |
| Figure16. Saudi Arabia Uncooled Thermal Imaging System Market Revenues and Volume, 2015-2025F ($ Million, Units) |
| Figure17. Saudi Arabia Thermal Imaging System Market Revenue Share, By Verticals, 2018 & 2025F |
| Figure18. Saudi Arabia Industrial Vertical Thermal Imaging Market Revenues, 2015-2025F ($ Million, Units) |
| Figure19. Upcoming Power Plant Projects in Saudi Arabia |
| Figure20. Saudi Arabia Military Vertical Thermal Imaging System Market Revenues, 2015-2025F ($ Million, Units) |
| Figure21. Saudi Arabia Commercial Vertical Thermal Imaging System Market Revenues, 2015-2025F ($ Million, Units) |
| Figure22. Upcoming Economic Cities in Saudi Arabia |
| Figure23. Major Upcoming Healthcare Projects in Saudi Arabia |
| Figure24. Saudi Arabia Actual Government Spending Vs Actual Government Revenues, 2015-2024F (SAR Trillion) |
| Figure25. Saudi Arabia Government Budget Spending Outlook, 2019 (SAR Billion) |
| Figure26. Saudi Thermal Imaging Market Opportunity Assessment, By Product Types, 2025F |
| Figure27. Saudi Thermal Imaging Market Opportunity Assessment, By Technology, 2025F |
| Figure28. UAE Thermal Imaging System Market Revenues & Volume, 2015-2025F ($ Million, Units) |
| Figure29. UAE Thermal Imaging System Market Revenue and Volume Share, By Product Types, 2018 & 2025F |
| Figure30. UAE Fixed Mounted Thermal Imaging System Market Revenues and Volume, 2015-2025F ($ Million, Units) |
| Figure31. UAE Hand Held Thermal Imaging System Market Revenues and Volume, 2015-2025F ($ Million, Units) |
| Figure32. UAE Thermal Imaging System Market Revenue and Volume Share, By Technology, 2018 & 2025F |
| Figure33. UAE Cooled Thermal Imaging System Market Revenues and Volume, 2015-2025F ($ Million, Units) |
| Figure34. UAE Uncooled Thermal Imaging System Market Revenues and Volume, 2015-2025F ($ Million, Units) |
| Figure35. UAE Thermal Imaging System Market Revenue Share, By Verticals, 2018 & 2025F |
| Figure36. UAE Industrial Vertical Thermal Imaging System Market Revenues, 2015-2025F ($ Million, Units) |
| Figure37. UAE Military Vertical Thermal Imaging System Market Revenues, 2015-2025F ($ Million, Units) |
| Figure38. UAE Commercial Vertical Thermal Imaging System Market Revenues, 2015-2025F ($ Million, Units) |
| Figure39. Dubai Residential Supply, 2014-2020F (Thousand Units) |
| Figure40. Abu Dhabi Residential Supply, 2014-2020F ( Thousand Units) |
| Figure41. Dubai Office Supply, 2015-2020 (Million Sq. m. of GLA) |
| Figure42. Abu Dhabi Office Supply, 2014-2019 (Million Sq. m. of GLA) |
| Figure43. UAE Actual Government Spending Vs Actual Government Revenues, 2014-2023F (AED Billion) |
| Figure44. UAE Thermal Imaging System Market Opportunity Assessment, By Product Types, 2025F |
| Figure45. UAE Thermal Imaging System Market Opportunity Assessment, By Technology, 2025F |
| Figure46. Qatar Thermal Imaging System Market Revenues & Volume, 2015-2025F ($ Million, Units) |
| Figure47. Qatar Thermal Imaging System Market Revenue and Volume Share, By Product Types, 2018 & 2025F |
| Figure48. Qatar Fixed Mounted Thermal Imaging System Market Revenues and Volume, 2015-2025F ($ Million, Units) |
| Figure49. Qatar Hand Held Thermal Imaging System Market Revenues and Volume, 2015-2025F ($ Million, Units) |
| Figure50. Qatar Thermal Imaging System Market Revenue and Volume Share, By Technology, 2018 & 2025F |
| Figure51. Qatar Cooled Thermal Imaging System Market Revenues and Volume, 2015-2025F ($ Million, Units) |
| Figure52. Qatar Uncooled Thermal Imaging System Market Revenues and Volume, 2015-2025F ($ Million, Units) |
| Figure53. Qatar Thermal Imaging System Market Revenue Share, By Verticals, 2018 & 2025F |
| Figure54. Qatar Industrial Vertical Thermal Imaging System Market Revenues, 2015-2025F ($ Million, Units) |
| Figure55. Qatar Electricity Demand, 2014-2025 (TWh) |
| Figure56. Qatar Military Vertical Thermal Imaging System Market Revenues, 2015-2025F ($ Million, Units) |
| Figure57. Qatar Commercial Vertical Thermal Imaging System Market Revenues, 2015-2025F ($ Million, Units) |
| Figure58. Qatar Organized Retail Supply, 2012-2019 (‘000 Sq.m. GLA) |
| Figure59. Upcoming Malls in Qatar |
| Figure60. Qatar Upcoming Major Transportation Infrastructure Projects |
| Figure61. Qatar Private Healthcare Spending, 2016 & 2026 ($ Billion) |
| Figure62. Qatar Public Healthcare Spending, 2016 & 2026 ($ Billion) |
| Figure63. Qatar Actual Government Spending Vs Actual Government Revenues, 2015-2024F (QAR Billion) |
| Figure64. Qatar Budget Allocation, 2019 |
| Figure65. Qatar Thermal Imaging System Market Opportunity Assessment, By Product Types, 2024F |
| Figure66. Qatar Thermal Imaging System Market Opportunity Assessment, Technplogy, 2024F |
| Figure67. Kuwait Thermal Imaging System Market Revenues & Volume, 2015-2025F ($ Million, Units) |
| Figure68. Kuwait Thermal Imaging System Market Revenue and Volume Share, By Product Types, 2018 & 2025F |
| Figure69. Kuwait Fixed Mounted Thermal Imaging System Market Revenues and Volume, 2015-2025F ($ Million, Units) |
| Figure70. Kuwait Hand Held Thermal Imaging System Market Revenues and Volume, 2015-2025F ($ Million, Units) |
| Figure71. Kuwait Thermal Imaging System Market Revenue and Volume Share, By Technology, 2018 & 2025F |
| Figure72. Kuwait Cooled Thermal Imaging System Market Revenues and Volume, 2015-2025F ($ Million, Units) |
| Figure73. Kuwait Uncooled Thermal Imaging System Market Revenues and Volume, 2015-2025F ($ Million, Units) |
| Figure74. Kuwait Thermal Imaging System Market Revenue Share, By Verticals, 2018 & 2025F |
| Figure75. Kuwait Industrial Vertical Thermal Imaging System Market Revenues, 2015-2025F ($ Million, Units) |
| Figure76. Kuwait Military Vertical Thermal Imaging System Market Revenues, 2015-2025F ($ Million, Units) |
| Figure77. Kuwait Commercial Vertical Thermal Imaging System Market Revenues, 2015-2025F ($ Million, Units) |
| Figure78. Kuwait Actual Government Spending Vs Actual Government Revenues, 2015-2024F (KWD Billion) |
| Figure79. Kuwait Thermal Imaging System Market Opportunity Assessment, By Product Types, 2024F |
| Figure80. Kuwait Thermal Imaging System Market Opportunity Assessment, By Technology, 2024F |
| Figure81. Oman Thermal Imaging System Market Revenues & Volume, 2015-2025F ($ Million, Units) |
| Figure82. Oman Thermal Imaging System Market Revenue and Volume Share, By Product Types, 2018 & 2025F |
| Figure83. Oman Fixed Mounted Thermal Imaging System Market Revenues and Volume, 2015-2025F ($ Million, Units) |
| Figure84. Oman Hand Held Thermal Imaging System Market Revenues and Volume, 2015-2025F ($ Million, Units) |
| Figure85. Oman Thermal Imaging System Market Revenue and Volume Share, By Technology, 2018 & 2025F) |
| Figure86. Oman Cooled Thermal Imaging System Market Revenues and Volume, 2015-2025F ($ Million, Units) |
| Figure87. Oman Uncooled Thermal Imaging System Market Revenues and Volume, 2015-2025F ($ Million, Units) |
| Figure88. Oman Thermal Imaging System Market Revenue Share, By Verticals, 2018 & 2025F |
| Figure89. Oman Industrial Vertical Thermal Imaging System Market Revenues & Volume, 2015-2025F ($ Million, Units) |
| Figure90. Oman Military Vertical Thermal Imaging System Market Revenues & Volume, 2015-2025F ($ Million, Units) |
| Figure91. Oman Commercial Vertical Thermal Imaging System Market Revenues, 2015-2025F ($ Million, Units) |
| Figure92. Muscat Hotel Supply, 2016 - 2021 (Number of Keys) |
| Figure93. Oman Actual Government Spending Vs Actual Government Revenues, 2014-2023F (OMR Billion) |
| Figure94. Oman Upcoming Projects, By Sectors ($Billion) |
| Figure95. Oman Thermal Imaging System Market Opportunity Assessment, By Product Types, 2025F |
| Figure96. Oman Thermal Imaging System Market Opportunity Assessment, By Technology, 2025F |
| Figure97. Bahrain Thermal Imaging System Market Revenues & Volume, 2015-2025F ($ Million, Units) |
| Figure98. Bahrain Thermal Imaging System Market Revenue and Volume Share, By Product Type, 2018 & 2025F |
| Figure99. Bahrain Fixed Mounted Thermal Imaging System Market Revenues and Volume, 2015-2025F ($ Million, Units) |
| Figure100. Bahrain Hand Held Thermal Imaging System Market Revenues and Volume, 2015-2025F ($ Million, Units) |
| Figure101. Bahrain Thermal Imaging System Market Revenue and Volume Share, By Technology, 2018 & 2025F |
| Figure102. Bahrain Cooled Thermal Imaging System Market Revenues and Volume, 2015-2025F ($ Million, Units) |
| Figure103. Bahrain Uncooled Thermal Imaging System Market Revenues and Volume, 2015-2025F ($ Million, Units) |
| Figure104. Bahrain Thermal Imaging System Market Revenue Share, By Verticals, 2018 & 2025F) |
| Figure105. Bahrain Industrial Vertical Thermal Imaging System Market Revenues, 2015-2025F ($ Million, Units) |
| Figure106. Bahrain Military Vertical Thermal Imaging System Market Revenues, 2015-2025F ($ Million, Units) |
| Figure107. Bahrain Commercial Vertical Thermal Imaging System Market Revenues, 2015-2025F ($ Million, Units) |
| Figure108. Bahrain Retail Market Size, Gross Leasable Area By Grade, 2007-2019 (sq.m.) |
| Figure109. Bahrain New Retail Space Supply, 2017-2020 (sq.m.) |
| Figure110. Manama Hotel Supply, 2016-2020 (Number of Branded Hotel Keys) |
| Figure111. Bahrain Residential Supply Pipeline, 2017-2020 (Units) |
| Figure112. Bahrain Residential Units Under Construction By Submarket, 2017-2020 (Units) |
| Figure113. Phase-wise Plans Under Bahrain Public Transport Masterplan |
| Figure114. Bahrain Actual Government Spending Vs Actual Government Revenues, 2015-2024F ( BHD Billion) |
| Figure115. Bahrain- Forecast Project Awards, 2018-2022 ($Billion) |
| Figure116. Bahrain Upcoming Projects, By Sectors ($Billion) |
| Figure117. Bahrain Thermal Imaging System Market Opportunity Assessment, By Product Types, 2025F |
| Figure118. Bahrain Thermal Imaging System Market Opportunity Assessment, By Technology, 2025F |
| Figure119. GCC Thermal Imaging System Market Opportunity Assessment, By Product Types, 2025F |
| Figure120. GCC Thermal Imaging System Market Opportunity Assessment, By Technology, 2025F |
| Figure121. GCC Thermal Imaging System Market Opportunity Assessment, By Countries, 2025F |
| Figure122. Saudi Arabia Thermal Imaging System Market Revenue Share, By Company, 2018 |
| Figure123. UAE Thermal Imaging System Market Revenue Share, By Company, 2018 |
| Figure124. Qatar Thermal Imaging System Market Revenue Share, By Company, 2018 |
| Figure125. Oman Thermal Imaging System Market Revenue Share, By Company, 2018 |
| Figure126. Bahrain Thermal Imaging System Market Revenue Share, By Company, 2017 |
| Figure127. Kuwait Thermal Imaging System Solutions Company Ranking, 2017 |
| List of Tables |
| Table1. Upcoming Construction Projects in the GCC |
| Table2. Saudi Arabia Upcoming Oil & Gas Projects |
| Table3. Saudi Arabia Upcoming Transportation Projects |
| Table4. List of Major Infrastructure Projects in Saudi Arabia |
| Table5. UAE Under Construction Residential Projects (Contd.) |
| Table6. Upcoming Malls in UAE |
| Table7. Upcoming Construction Projects in Dubai |
| Table8. Upcoming Hospitality Projects in UAE |
| Table9. Upcoming Construction Projects In UAE |
| Table10. Upcoming Oil & Gas Projects in Qatar |
| Table11. Qatar Upcoming Power Projects |
| Table12. Qatar Upcoming Solar Power Projects |
| Table13. Oman Upcoming Industrial Projects |
Global Go To Market Strategy - 2030
Export potential enables firms to identify high-growth global markets with greater confidence by combining advanced trade intelligence with a structured quantitative methodology. The framework analyzes emerging demand trends and country-level import patterns while integrating macroeconomic and trade datasets such as GDP and population forecasts, bilateral import–export flows, tariff structures, elasticity differentials between developed and developing economies, geographic distance, and import demand projections. Using weighted trade values from 2020–2024 as the base period to project country-to-country export potential for 2030, these inputs are operationalized through calculated drivers such as gravity model parameters, tariff impact factors, and projected GDP per-capita growth. Through an analysis of hidden potentials, demand hotspots, and market conditions that are most favorable to success, this method enables firms to focus on target countries, maximize returns, and global expansion with data, backed by accuracy.
By factoring in the projected importer demand gap that is currently unmet and could be potential opportunity, it identifies the potential for the Exporter (Country) among 190 countries, against the general trade analysis, which identifies the biggest importer or exporter.
To discover high-growth global markets and optimize your business strategy:
Click Here
Pricing
- Single User License$ 4,560
- Department License$ 5,055
- Site License$ 5,595
- Global License$ 6,000

Leadership Perspectives from Industry Events
Search
Thought Leadership and Analyst Meet


Our Clients
6WResearch In News
- India Air Conditioner Market Set for Strong Rebound in 2026 After Weather-Led Correction and GST-Driven Recovery: 6Wresearch
- ADAS in India: How Automatic Emergency Braking, Blind Spot Detection & Driver Monitoring are Transforming Road Safety
- Doha a strategic location for EV manufacturing hub: IPA Qatar
- Demand for luxury TVs surging in the GCC, says Samsung
- Empowering Growth: The Thriving Journey of Bangladesh’s Cable Industry
- Demand for luxury TVs surging in the GCC, says Samsung
Latest Reports
- Nicaragua RPG Gaming Market (2026-2032)
- New Zealand RPG Gaming Market (2026-2032)
- Netherlands RPG Gaming Market (2026-2032)
- Nauru RPG Gaming Market (2026-2032)
- Namibia RPG Gaming Market (2026-2032)
- Mozambique RPG Gaming Market (2026-2032)
- Montenegro RPG Gaming Market (2026-2032)
- Mongolia RPG Gaming Market (2026-2032)
- Monaco RPG Gaming Market (2026-2032)
- Micronesia RPG Gaming Market (2026-2032)
Industry Events and Analyst Meet

HIMTEX 2026

India Refining Summit 2026

India EV Show 2026

EV tech India Expo 2026

Auto Tech Asia 2026
Whitepaper
- Middle East & Africa Commercial Security Market Click here to view more.
- Middle East & Africa Fire Safety Systems & Equipment Market Click here to view more.
- GCC Drone Market Click here to view more.
- Middle East Lighting Fixture Market Click here to view more.
- GCC Physical & Perimeter Security Market Click here to view more.