Ecuador’s Frozen Crustaceans Exports to Existing Partners Could Reach USD 9.19 Billion, While Crude Petroleum Opens USD 560.17 Million Across New Markets by 2031.
Frozen crustaceans lead Ecuador’s export potential, though the United States and China are nearly tied at the top, together commanding over 56% of established demand. In untapped markets, Singapore alone captures nearly a third of all new-corridor value, more than double any other buyer, while Malaysia, China and South Korea each hold single-digit shares a far top-heavier hierarchy than Ecuador’s established trade.
Source: 6WExportGTM
The United States and China Are Nearly Tied in Established Demand While Singapore Dominates Ecuador’s New-Corridor Trade
Ecuador’s emerging export opportunities are increasingly linked with Asian and global markets, led by Singapore with an export potential of USD 0.98 billion, followed by Malaysia at USD 0.36 billion and China at USD 0.23 billion. These opportunities are primarily supported by Ecuador’s competitive strengths in resource-based sectors, including seafood, agricultural commodities, and mining products. South Korea and the United States represent additional high-value markets with opportunities of USD 0.18 billion and USD 0.16 billion, respectively, supported by demand for Ecuador’s shrimp, copper, processed seafood, and other globally traded commodities. Expanding market access and strengthening value-added production could help Ecuador diversify its export destinations beyond traditional partners.
| Top 5 Existing Importers | Export Potential (USD Billion) | Top 5 New Potential Importers | Export Potential (USD Billion) |
| United States | 8.99 | Singapore | 0.98 |
| China | 8.24 | Malaysia | 0.36 |
| Japan | 2.26 | China | 0.23 |
| India | 1.31 | South Korea | 0.18 |
| South Korea | 1.05 | United States | 0.16 |
Source: 6WExportGTM
Ecuador’s current export opportunities are focused on the major global markets, with the largest potential destinations being the United States (USD 8.99 billion) and China (USD 8.24 billion). These markets are supported by strong demand for Ecuador’s main export sectors, such as shrimp, bananas, crude oil, copper and processed seafood. In contrast, Japan, India and South Korea offer significant opportunities with export potential of USD 2.26 billion, USD 1.31 billion and USD 1.05 billion respectively, driven by demand for agricultural commodities, minerals and industrial inputs. Deepening Ecuador’s position in established global supply chains and expanding value-added exports can be helped by strengthening existing trade relationships with these markets.
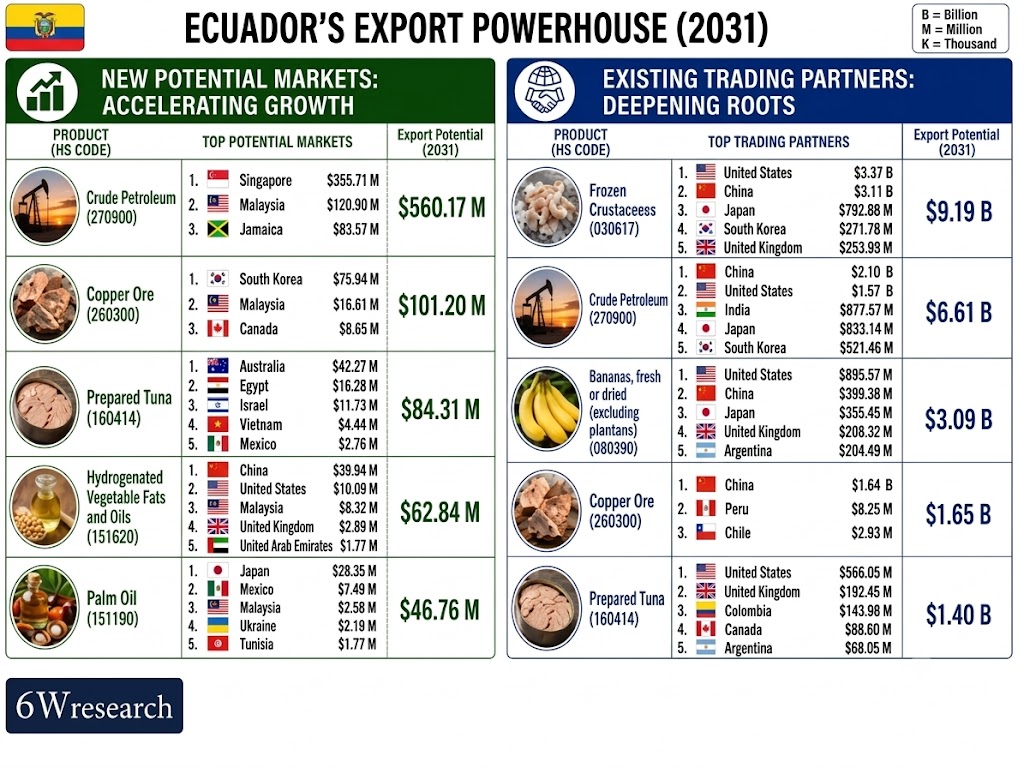
Ecuador’s Emerging Export Opportunities Expand Across Petroleum, Copper, Seafood, and Specialty Agricultural Products
Crude petroleum is the leading new-corridor product at USD 560.17 million, led by Singapore (USD 355.71 million), Malaysia (USD 120.90 million) and Jamaica (USD 83.57 million). Singapore’s dominance reflects its role as one of the world’s largest oil-refining and trading hubs, blending and re-exporting crude from diverse origins across Asia; Malaysia’s Petronas-anchored refining and trading infrastructure serves a similar regional blending function; and Jamaica’s smaller purchase likely reflects a Caribbean refining or bunkering relationship distinct from the Pacific-basin buyers that dominate established trade.
Copper ore and prepared tuna together account for another USD 185.51 million of new-corridor potential. Copper ore’s USD 101.20 million is led by South Korea (USD 75.94 million) and Malaysia (USD 16.61 million), with South Korea’s large non-ferrous metals-smelting industry diversifying ore sourcing beyond its traditional Chilean and Peruvian suppliers. Prepared tuna’s USD 84.31 million is led by Australia (USD 42.67 million), Egypt (USD 16.28 million) and Israel (USD 11.73 million) Australia’s retail canned-seafood market diversifying supply beyond traditional Pacific-basin sources, while Egypt and Israel reflect emerging Mediterranean and Middle Eastern demand for Ecuadorian tuna in markets with limited domestic canning capacity of their own.
Hydrogenated vegetable fats and oils and palm oil close out the new-corridor top five. The fats-and-oils line’s USD 62.84 million is led by China (USD 39.64 million), reflecting China’s vast food-processing and confectionery industry importing specialty hydrogenated oils as inputs a genuinely new buyer relationship for a product with no established-trade equivalent. Palm oil’s USD 46.76 million is led by Japan (USD 28.35 million), reflecting Japan’s food and cosmetics industries diversifying palm-oil sourcing amid sustainability-driven supply-chain shifts. Taken together, the five products show a new-corridor opportunity for Ecuador based on oils, petroleum, sea food and copper ore.
Ecuador’s Global Export Strengths Are Anchored by Shrimp, Oil, Bananas, Copper, and Tuna Across Key International Markets
Frozen crustaceans, Ecuador’s largest established product at USD 9.19 billion, are led by the United States (USD 3.37 billion), China (USD 3.11 billion) and Japan (USD 792.85 million). The US is the world’s largest shrimp-consuming market by value, with Ecuadorian white-leg shrimp displacing Asian supply on quality and traceability grounds; China’s equally large purchases reflect a booming domestic seafood-consumption market that its own aquaculture sector cannot fully satisfy; and Japan’s established sushi and seafood-retail culture provides a stable premium outlet for high-grade frozen shrimp.
Crude petroleum (USD 6.61 billion) and bananas (USD 3.09 billion) together contribute another USD 9.70 billion. Crude petroleum’s top buyers China (USD 2.10 billion), the United States (USD 1.57 billion) and India (USD 872.57 million) reflect Chinese independent refiners seeking price-competitive heavy crude, US Gulf Coast refineries historically configured for Ecuadorian blends, and Indian state refiners diversifying their crude basket. Bananas are led by the United States (USD 895.57 million), China (USD 399.38 million) and Japan (USD 355.45 million), reflecting the US retail market’s longstanding dependence on Latin American banana supply chains, China’s fast-growing fresh-fruit consumption, and Japan’s well-established quality-driven banana-import culture.
Copper ore (USD 1.65 billion) and prepared tuna (USD 1.40 billion) close out the top five opportunity. Copper ore is overwhelmingly a single relationship with China (USD 1.64 billion), consistent with China’s dominant copper-smelting base absorbing nearly all of Ecuador’s still-nascent copper-mining output, with Peru and Chile taking only marginal shares. Prepared tuna is led by the United States (USD 566.05 million), the United Kingdom (USD 192.45 million) and Colombia (USD 143.98 million), reflecting large canned-seafood retail markets in the US and UK alongside a smaller regional Andean trade relationship. Read together, the established base is a story of seafood, energy and fruit converging repeatedly on the same handful of large economies the US, China and Japan appear among the top buyers of nearly every product leaving Ecuador’s established trade genuinely multi-product but still narrowly dependent on a small set of buyer relationships.
|
Ecuador’s established trade is diversified by product but not by buyer the United States, China and Japan show up at the top of shrimp, oil, bananas and tuna alike. The new-corridor data looks meaningfully different: Singapore and Malaysia’s refining relationships, South Korea’s metals demand, and entirely new vegetable-oil lines into China and Japan point to a genuinely broader set of buyers than the established base suggests. 6WExportGTM Analysis |
Top Global Export Opportunities (2031), By Product
| Product | Export Opportunity (USD Billion) |
| Electronic Integrated Circuits | 685.7 |
| Refined Petroleum Oils | 668.4 |
| Light Petroleum Oils | 588.9 |
| Logic Electronic Integrated Circuits | 507.9 |
| Medicines | 381.2 |
| Gasoline Passenger Cars (1.5–3.0L) | 360.9 |
| Smartphones | 343.6 |
| Electronic Integrated Circuits with Memory | 333.2 |
| Data Transmission Equipment | 216.9 |
| Immunological Products | 209.6 |
Excludes naturally occurring products (e.g., crude oil, raw gold). Source: 6WExportGTM
Global export opportunities through 2031 are expected to be driven by technology-intensive and high-value products, including semiconductors, pharmaceuticals, automotive products, and digital equipment. Within this evolving global landscape, Ecuador is well positioned to capitalize on its existing strengths in globally competitive sectors such as shrimp, bananas, tuna, crude petroleum, and emerging copper exports. By leveraging its natural resource advantages, expanding value-added processing, and strengthening integration with international supply chains, Ecuador can continue to diversify its export portfolio and capture new opportunities across global markets.
What Ecuador Already Sells and Where
Current actual trade confirms oil & gas and seafood as Ecuador’s two leading sectors, running almost neck and neck. Oil & gas leads at USD 8.67 billion, driven overwhelmingly by crude petroleum at USD 7.83 billion (90.37%), with refined petroleum oils contributing a smaller USD 835.08 million (9.63%). Seafood & fisheries ranks a close second at USD 8.31 billion, led by frozen crustaceans at USD 6.23 billion (75.06%) and prepared tuna at USD 1.41 billion (16.98%). Fruits rank third at USD 3.91 billion, almost entirely bananas at USD 3.35 billion (85.75%), with a smaller general fruits line contributing USD 216.58 million (5.54%).
| Sector | Exports (USD Billion) | Leading Products (USD Million/Billion) |
| Oil & Gas | 8.67 | Crude Petroleum (90.37%), Refined Petroleum Oils (9.63%) |
| Seafood & Fisheries | 8.31 | Frozen Crustaceans (75.06%), Prepared Tuna (16.98%) |
| Fruits | 3.91 | Bananas (85.75%), Fruits (5.54%) |
Source: UN Comtrade
By destination, the United States is Ecuador’s largest current export market at USD 6.36 billion, split between crude petroleum at USD 1.45 billion (22.85%) and frozen crustaceans at USD 1.34 billion (21.07%) a genuinely diversified two-product relationship. Panama ranks second at USD 5.80 billion, almost entirely crude petroleum at USD 5.31 billion (91.42%), a concentration so extreme it most plausibly reflects crude routed through Panama’s canal-adjacent transshipment and bunkering infrastructure rather than direct Panamanian consumption. China ranks third at USD 4.64 billion, led by frozen crustaceans at USD 2.92 billion (62.93%) and copper ore at USD 1.05 billion (22.64%).
| Country | Exports (USD Billion) | Leading Products (USD Million/Billion) |
| United States | 6.36 | Crude Petroleum (22.85%), Frozen Crustaceans (21.07%) |
| Panama | 5.80 | Crude Petroleum (91.42%), Refined Petroleum Oils (6.8%) |
| China | 4.64 | Frozen Crustaceans (62.93%), Copper Ore (22.64%) |
Source: UN Comtrade
Two Developments Shaping Ecuador’s Export Base: A US Trade Deal with a Shrimp-Sized Gap, and Fragile Oil Infrastructure
Two key developments are influencing Ecuador’s future export outlook. First, the new US–Ecuador trade agreement provides improved market access for key exports such as bananas, tuna, and minerals by reducing tariff barriers, although frozen crustaceans remain subject to existing trade measures that could affect competitiveness. Second, Ecuador’s crude oil export potential faces structural challenges, including aging pipeline infrastructure, environmental risks, and existing export commitments linked to external financing, which could impact the sector’s ability to sustain long-term growth despite continued global demand.
A US Trade Deal Helps Bananas and Tuna, But Leaves Shrimp’s Tariff Burden in Place
Ecuador's trade outlook got a genuine lift with the signing of the US-Ecuador Reciprocal Trade Agreement on March 13, 2026, which improved market access for key non-oil exports by removing a 15% tariff surcharge on eligible products. The agreement covers roughly USD 2.8-3.2 billion in trade and benefits major export categories including bananas, tuna, flowers, cacao, gold and copper. That translates into stronger competitiveness for established products such as bananas — USD 895.57 million exported to the US — and prepared tuna at USD 566.05 million, effectively restoring more favourable trading conditions for both. Frozen crustaceans, however, Ecuador's largest export category by far, fall outside this tariff relief and continue to carry existing trade-related duties. Even so, Ecuador remains a major global player in shrimp exports, backed by a large-scale aquaculture industry and well-established international demand. Combined with the country's competitive strengths in seafood, agriculture and minerals, this agreement opens up real opportunity to grow exports further, broaden market access, and deepen Ecuador's integration into global supply chains.
|
The US–Ecuador trade agreement strengthens Ecuador’s export competitiveness by improving market access for key products such as bananas, tuna, and minerals. While shrimp remains subject to existing trade measures, Ecuador’s diversified export base and strong position in global seafood and agricultural markets provide continued opportunities for export growth. Manish Pant, Senior Data Scientist, Data Science & Market Intelligence, 6Wresearch |
Aging Pipelines and Oil-Backed Loans Cloud Ecuador’s USD 6.61 Billion Crude Line
Ecuador's crude petroleum sector still holds real long-term promise, built on production capabilities that are already well established and demand that keeps coming in strong from major global buyers. By 2031, we're looking at established export potential of around USD 6.61 billion, with China leading at USD 2.10 billion and the US following at USD 1.57 billion. What's become clear over the past year or so is how much supply resilience actually matters here — Ecuador has been putting real effort into improving infrastructure reliability and getting more out of its export capacity. Back in July 2025, erosion risks caused a stretch of pipeline disruptions that hit production pretty hard, but recovery efforts got the SOTE pipeline running again, and flows were actually up 12% in the first half of 2026 versus the year before. Between ongoing work on pipeline stability, restructuring some of the oil-backed financial commitments, and building in more market flexibility, export performance should hold up reasonably well going forward. As long as investment in infrastructure continues and resources are managed responsibly, Ecuador should be able to hold its position as a reliable crude supplier while squeezing more value out of what it already has.
|
Ecuador’s crude petroleum export opportunity remains substantial, supported by strong demand from key international markets such as China and the United States. Future growth will depend less on market access and more on strengthening supply reliability through infrastructure upgrades, improved operational resilience, and effective resource management. Manisha Gupta, Data Analyst, Data Science & Market Intelligence, 6Wresearch |
The Takeaway
Ecuador's export base spans several globally competitive sectors — shrimp, crude oil, bananas, copper and tuna among them but it remains heavily concentrated in a small number of key markets, the United States, China and Japan chief among them. Emerging opportunities point to a broader mix, with fresh demand taking shape across refining hubs and agricultural markets. For Ecuador, the strategic priority now is fairly clear: make the most of improved trade access for bananas and tuna, work through the remaining barriers affecting shrimp exports, and strengthen the reliability of its energy export infrastructure to support growth over the longer term.
Key strategic priorities for Ecuador include:
- Push for shrimp-specific tariff relief to match the new trade deal, since frozen crustaceans generated a record USD 8.4 billion in 2025 and represent USD 9.19 billion in established 2031 potential, yet remain outside the March 2026 US-Ecuador agreement and still face a combined antidumping, countervailing and Section 301 tariff burden of over 23%.
- Capture the bananas and tuna gains from the new US agreement quickly, given the removal of the 15% surcharge directly benefits USD 895.57 million in established banana trade and USD 566.05 million in established tuna trade with the United States, before competitors with existing US free-trade agreements narrow the advantage.
- Invest in pipeline resilience to protect the USD 6.61 billion crude line, given the SOTE and OCP pipelines have already caused a 68% single-month production collapse in July 2025 from erosion-related ruptures, a physical risk that no amount of buyer diversification can offset.
- Build on the Singapore and Malaysia refining relationships in new-corridor crude, since these two hubs already represent USD 355.71 million and USD 120.90 million of new-corridor crude petroleum demand respectively, offering a genuine diversification path beyond the China-US-India buyers who dominate established crude trade.
Ultimately, Ecuador’s 2031 export outlook depends less on finding new buyers than on managing the risks already visible in its current base a shrimp industry still paying a tariff premium its neighbors in the new US deal do not, and an oil sector whose biggest threat comes from its own pipelines and legacy debt rather than from softening demand.

Leadership Perspectives from Industry Events
Search
6Wresearch in the News
 Forbes
Citing 6Wresearch analytics to map global infrastructure and pharmaceutical industry trajectories.
 Bloomberg Law
Direct syndication of 6Wresearch's macro data points, capturing complex supply chain shifts.
 Reuters
Tracking industrial manufacturing adjustments and electronic security ecosystem scaling.
 Mint
Mint
Utilizing deep-tech sector market sizing to analyze global automation and robotics.
 The Economic Times
Anchoring features on industrial IoT growth metrics and connected smart-grid devices.
 Business Standard
Featuring strategic evaluations of Advanced Driver Assistance Systems (ADAS) and AI road safety.
 The Hindu
Spotlighting core commercial metrics ranging from unmanned aerial vehicles (UAVs) to consumer durables.
 Financial Express
Anchoring quarterly reviews on cross-border real estate tech and structural hardware manufacturing.
 Yahoo Finance
Syndicating the tracker's $30.1 billion untapped-market findings, spotlighting Japan, the US and China as India's top new-potential importers.
 India Today
Carrying the release on smartphones leading India's export potential to $94 billion by 2031, per 6WExportGTM data.
 Dailyhunt
Distributing the tracker findings to its regional readership, framing India's export diversification into Japan and Mexico.
 PR Newswire Original release
Publishing the full India Export Attractiveness Tracker 2026, detailing new trade corridors across iron ore, LCVs and pharmaceuticals.
 The Industrial
Highlighting the tracker's read on India's semiconductor ambitions and long-term chip-assembly export potential.
 PTI News
Reporting on the $66.81 billion pharmaceuticals export opportunity flagged in the tracker, amid looming US generic-drug tariffs.
 Tribune India
Covering the tracker's tariff-versus-regulation analysis across India's mature export markets in the US, China and UAE.
 ANI News
Amplifying the report's findings on polished diamonds, refined petroleum and medicines as India's core export engines.
 International Business Magazine
Covering the report's insight into how AEB, blind spot detection, and driver monitoring are reshaping India's ADAS market.
 Focus Gaming News
Highlighting the research forecast for Egypt's gambling market, projecting steady growth through 2032.
Thought Leadership and Analyst Meet





Our Clients








Latest Reports
- Austria X-ray Imaging Devices Market (2026-2032)
- Armenia X-ray Imaging Devices Market (2026-2032)
- Antigua and Barbuda X-ray Imaging Devices Market (2026-2032)
- Angola X-ray Imaging Devices Market (2026-2032)
- Andorra X-ray Imaging Devices Market (2026-2032)
- Albania X-ray Imaging Devices Market (2026-2032)
- Afghanistan X-ray Imaging Devices Market (2026-2032)
- United States (US) X-ray Imaging Devices Market (2026-2032)
- United Kingdom (UK) X-ray Imaging Devices Market (2026-2032)
- United Arab Emirates (UAE) X-ray Imaging Devices Market (2026-2032)
Industry Events and Analyst Meet

EV India Expo 2026

HIMTEX 2026

India Refining Summit 2026

India EV Show 2026

EV tech India Expo 2026
Whitepaper
- Middle East & Africa Commercial Security Market Click here to view more.
- Middle East & Africa Fire Safety Systems & Equipment Market Click here to view more.
- GCC Drone Market Click here to view more.
- Middle East Lighting Fixture Market Click here to view more.
- GCC Physical & Perimeter Security Market Click here to view more.


