Crude Petroleum and LNG Exports to Existing Trading Partners Are Projected to Reach USD 313.48 Billion and USD 156.08 Billion by 2031, While the Energy Sector Unlocks USD 29.01 Billion in New Potential Markets
The United States export potential in 2031 is primarily driven by energy products, with crude oil, LNG, and related commodities dominating both existing and entirely new product opportunities. China represents the largest share of existing export potential at 20.74% nearly 2.5 times Japan’s share and also leads new product opportunities with 9.15%. Agriculture and semiconductors further reinforce China’s importance as a key destination for U.S. exports.
Source: 6WExportGTM
China Dominates Germany's Export Potential While Emerging Asian Markets Drive New Product Opportunities
China overwhelmingly leads the current export opportunity at USD 623.81 billion, more than twice the potential associated with second-ranked Japan at USD 262.54 billion. Mexico and India follow closely at USD 196.54 billion and USD 193.79 billion, respectively, while South Korea completes the top five with USD 188.76 billion. The concentration of four Asian economies among the five leading importers highlights Asia’s central role in the exporter’s established trade potential, with Mexico representing the only major market outside the region.
| Top 5 Current Leading Importers | Export Potential (USD Billion) | Top 5 New Potential Importers for New Product Lines | Export Potential (USD Billion) |
| China | 623.81 | China | 2.66 |
| Japan | 262.54 | Philippines | 1.82 |
| Mexico | 196.54 | Vietnam | 1.37 |
| India | 193.79 | Turkey | 1.33 |
| South Korea | 188.76 | Egypt | 1.31 |
Source: 6WExportGTM
Even the new-corridor list, worth USD 29.01 billion in total, keeps circling back to China, which leads at USD 2.66 billion even in the untapped markets this time on the back of iron ore and nickel ore rather than crude oil or gas. The Philippines, Vietnam, Turkey and Egypt round out the top five, a genuinely different set of buyers than the energy-import giants that dominate established trade, and one weighted more toward Southeast Asian and Mediterranean coal and mineral demand.
Energy and Raw Materials Unlock USD 4.24 Billion in New U.S. Export-Corridor Potential by 2031
LNG, agglomerated iron ore concentrates and coal lead the way. While the United States currently has minimal trade with several of these destinations, analysis by 6WExportGTM, a part of 6Wresearch, shows real untapped export opportunity emerging by 2031 much of it in raw materials and fuels flowing to buyers that don't yet show up mean
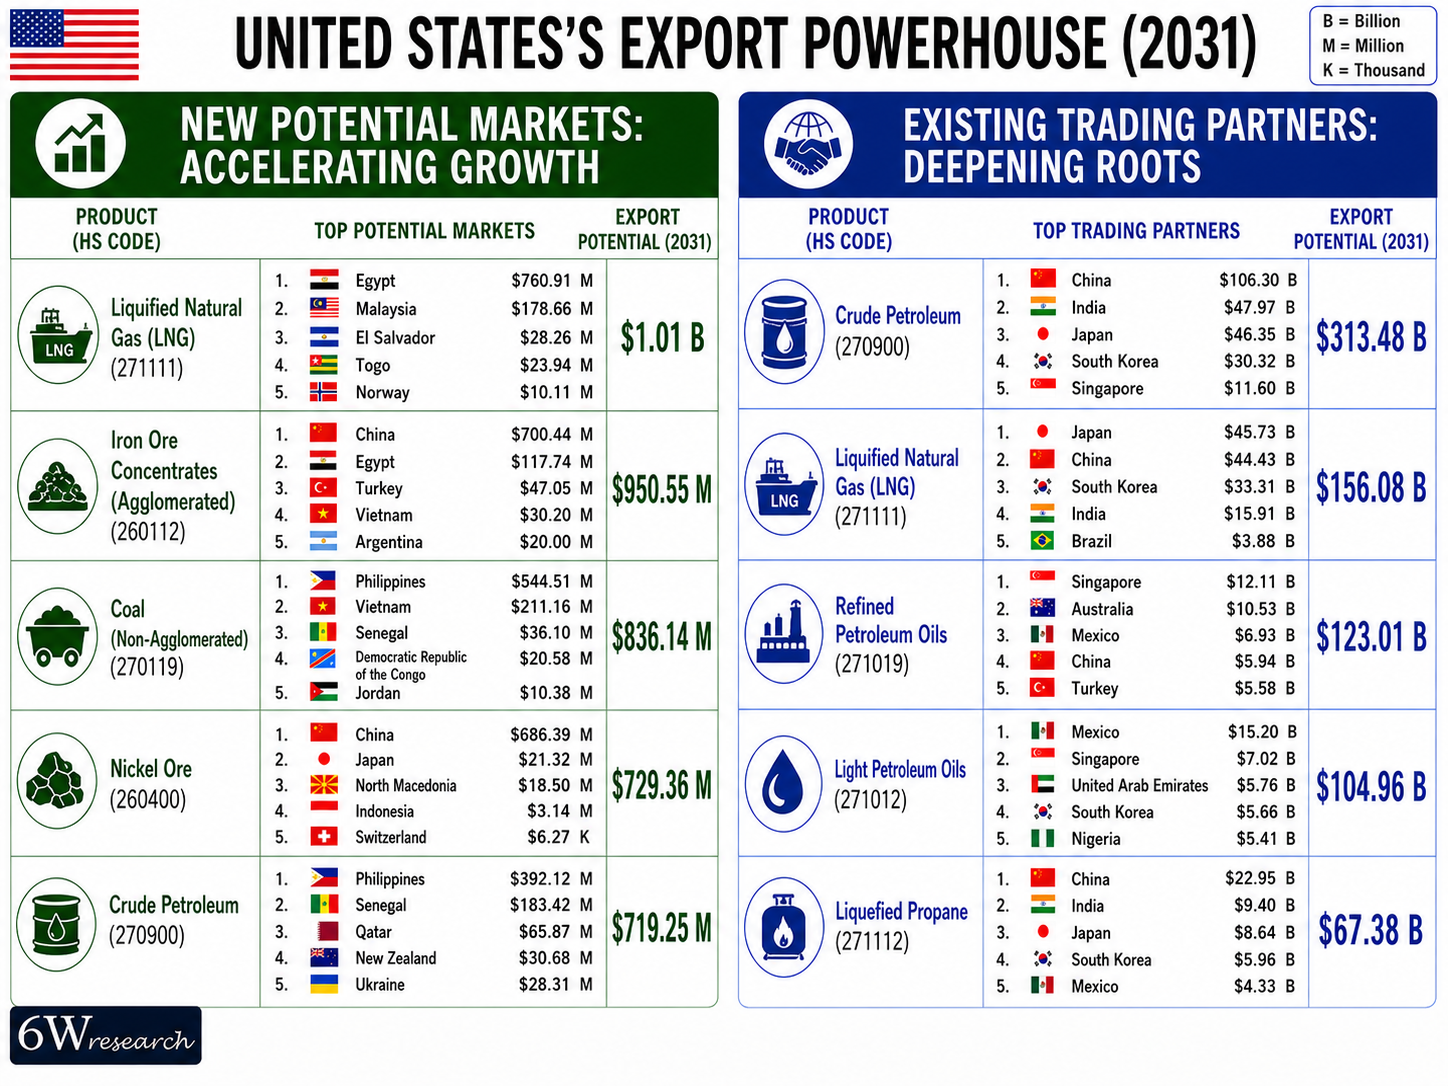
Liquefied natural gas represents the largest new-corridor opportunity at USD 1.008 billion, led by Egypt (USD 0.761 billion) and Malaysia (USD 0.179 billion) two energy-importing economies not typically associated with US LNG cargoes. Agglomerated iron ore concentrates follow at USD 0.951 billion, led overwhelmingly by China (USD 0.700 billion), while non-agglomerated coal adds a further USD 0.836 billion, led by the Philippines (USD 0.545 billion) and Vietnam (USD 0.211 billion).
Nickel ore appears as a notable new line at USD 0.729 billion, led again by China (USD 0.686 billion) while crude petroleum itself shows up even within the untapped markets at USD 0.719 billion, led by the Philippines (USD 0.392 billion) and Senegal (USD 0.183 billion), two markets with essentially no current US crude relationship to speak of.
U.S. Energy Exports Dominate Established Trading Partners, Led by USD 313.48 Billion in Crude Petroleum by 2031
Crude petroleum liquefied natural gas and refined petroleum oils account for the overwhelming majority of United States's highest-value export potential by 2031 a reminder that the US shale and LNG revolution of the past decade has turned energy into the country's dominant export category by a wide margin.
Crude petroleum alone carries USD 313.48 billion in potential, led by China (USD 106.30 billion), India (USD 47.97 billion), Japan (USD 46.35 billion), South Korea (USD 30.32 billion) and Singapore (USD 11.60 billion). LNG follows closely at USD 156.08 billion, led this time by Japan (USD 46.73 billion) just ahead of China (USD 44.43 billion), with South Korea, India and Brazil rounding out the top five. Refined petroleum oils add USD 123.01 billion, led by Singapore (USD 12.11 billion) and Australia (USD 10.53 billion) both regional refining and re-export hubs rather than primary end-consumption markets.
Light petroleum oils contribute a further USD 104.96 billion, led by Mexico (USD 15.20 billion) and Singapore (USD 7.02 billion), reflecting deep North American refining integration alongside Asian trading-hub demand. Liquefied propane rounds out the top five at USD 67.38 billion, led by China (USD 22.95 billion) and India (USD 9.40 billion) a product category where China alone accounts for well over a third of total potential, underscoring just how central Chinese demand remains across nearly every major US energy export line.
|
The United States' export future by 2031 is, in value terms, overwhelmingly an energy story. Crude oil, LNG, refined petroleum products and propane dominate the country's largest export opportunities, while China emerges as the most influential buyer across nearly every major energy export line. 6WExportGTM Analysis |
Three Forces Reshaping What United States Sells Abroad
The United States export trajectory to 2031 will be shaped less by finding new products to sell than by managing three fast-moving dynamics around the products it already dominates: an LNG export buildout that is fundamentally reshaping global gas markets, a soybean-and-agriculture relationship with China that collapsed and is only partially rebuilding, and a semiconductor export-control regime that determines, chip by chip, how much of United States's advanced technology reaches its largest single trading partner.
LNG's Second Wave: United States Becomes the World's Swing Supplier
The United States has emerged as the world’s largest LNG exporter, surpassing Qatar and Australia, with operational liquefaction capacity of roughly 18 billion cubic feet per day as of early 2026. The year marks a major inflection point in the country’s LNG expansion, with Golden Pass LNG shipping its first cargo, Corpus Christi Stage 3 bringing its final trains online, and Venture Global’s CP2 LNG project reaching a final investment decision in March 2026 with 20 million tonnes per annum of planned capacity. U.S. LNG export capacity is expected to exceed 30 Bcf/d by the early 2030s, more than doubling December 2025 levels, while Europe remains the largest destination at around 45% of volumes, followed by Asia at approximately 40%.
|
The scale of the current LNG buildout means United States's USD 156.08 billion in projected LNG export potential is likely conservative if even half of the newly sanctioned capacity reaches full operation on schedule this is one of the most capital-backed export forecasts in the entire report. Manish Pant, Senior Data Scientist, Data Science & Market Intelligence, 6Wresearch |
Soybeans, Suspended and Restored: The China Relationship in Miniature
China's roughly USD 12.76 billion in soybean-product purchases makes it the single largest product line in the US-China trading relationship by product, and few products better illustrate how quickly US export relationships with China can swing. China halted soybean purchases entirely during the 2025 tariff dispute, leaning instead on South American suppliers, before a trade agreement reached between Presidents Trump and Xi in late 2025 restored the relationship committing China to purchase at least 25 million metric tons annually through 2028, plus a further USD 17 billion a year in non-soybean agricultural products. Even so, USDA data through March 2026 shows China accounted for under 30% of total US soybean exports, roughly half its pre-trade-war share, and farm groups describe the outlook as improved but still "daunting" relative to pre-2018 volumes.
|
The soybean relationship is a useful proxy for reading the rest of this report's China numbers: a purchase commitment on paper and a fully restored trading relationship are not the same thing, and the gap between them is exactly where execution risk lives for crude oil, LNG and propane exports too. Manisha Gupta, Data Analyst, Data Science & Market Intelligence, 6Wresearch |
Chips With Strings Attached: Semiconductors Meet Export Control
Electronic integrated circuits are China's third-largest single import line from the United States at USD 5.76 billion, alongside USD 3.45 billion in semiconductor manufacturing machines but both figures sit downstream of a genuinely volatile policy environment. After nearly three years of tightening controls dating back to 2022, the Trump administration reversed course in December 2025, clearing Nvidia's H200 and AMD's MI325X for case-by-case export to China under strict conditions: US-based third-party testing, a cap limiting China-bound shipments to 50% of domestic US sales, and a 25% tariff on each shipment's value flowing directly to the US Treasury. Roughly 10 major Chinese firms, including Alibaba, Tencent and ByteDance, have been cleared to buy H200 chips, though as of mid-2026 actual deliveries remain caught in legal and regulatory limbo, and a bipartisan group of lawmakers has separately pushed for a blanket ban on semiconductor manufacturing equipment exports to all of China rather than the current entity-by-entity approach.
Top Global Export Opportunities (2031), By Product
| Product | Export Opportunity (USD Billion) |
| Electronic Integrated Circuits | 685.7 |
| Refined Petroleum Oils | 668.4 |
| Light Petroleum Oils | 588.9 |
| Logic electronic integrated circuits | 507.9 |
| Medicines | 381.2 |
| Gasoline Passenger Cars (1.5–3.0L) | 360.9 |
| Smartphones | 343.6 |
| Electronic integrated circuits with memory | 333.2 |
| Data Transmission Equipment | 216.9 |
| Immunological Products | 209.6 |
Excludes naturally occurring products (e.g., crude oil, raw gold). Source: 6WExportGTM
Globally, the largest export opportunities beyond naturally occurring products are concentrated in electronics, energy and pharmaceuticals highlighting the growing dominance of semiconductors, advanced manufacturing and high-value technology products in global trade. Japan already sits inside several of these categories, but its real priority through 2031 is defending semiconductor-equipment leadership, stabilizing its auto industry through a difficult transition, and using energy and metals diversification to reduce the geopolitical exposure that comes with a resource-poor, trade-dependent economy.
What United States Sells, and to Whom: The Established Base
Oil & gas overwhelmingly anchors the United States' established export potential at USD 304.12 billion, led by crude petroleum (38.96%) and refined petroleum oils (22.98%), highlighting the country's continued strength in global energy exports. Pharmaceuticals form the second-largest sector at USD 110.44 billion, supported by medicines (25.08%) and immunological products (24.43%), while semiconductors contribute USD 89.09 billion, with electronic integrated circuits (36.35%) and logic electronic integrated circuits (15.03%) accounting for the largest shares, underscoring the strategic importance of advanced electronics in the U.S. export portfolio.
| Sector | Exports (USD Billion) | Leading Products / Share |
| Oil & Gas | 304.12 | Crude Petroleum (38.96%), Refined Petroleum Oils (22.98%) |
| Pharmaceuticals | 110.44 | Medicines (25.08%), Immunological Products (24.43%) |
| Semiconductors | 89.09 | Electronic Integrated Circuits (36.35), Logic Electronic Integrated Circuits (15.03%) |
Source: UN Comtrade
By trading value, Canada and Mexico remain the United States’ largest established export destinations, reflecting deeply integrated North American trade. Canada, with export potential of USD 348.41 billion, is led by crude petroleum (3.24%) and gasoline-powered light commercial vehicles (2.37%). Mexico follows closely at USD 334.04 billion, supported by light petroleum oils (5.40%) and Refined Petroleum Oils (4.75%). China ranks third at USD 143.55 billion, with soybean products (9.83%) and crude petroleum (4.74%) emerging as the leading product categories, highlighting the continued importance of agriculture and energy in U.S.–China trade.
| Country | Exports (USD Billion) | Leading Products / Share |
| Canada | 348.41 | Crude Petroleum (3.24%); LCV (Gasoline) (2.37%) |
| Mexico | 330.04 | Light Petroleum Oils (5.86%); Refined Petroleum Oils (4.89%) |
| China | 143.54 | Soybean Products (9.83%); Crude Petroleum (4.74%) |
Source: UN Comtrade
The Takeaway
The United States should focus on converting its existing strengths into more resilient and diversified export growth rather than relying primarily on headline market potential. Energy will remain the central pillar, but the priority should be to translate LNG capacity additions into sustained shipments, deepen crude and refined-product relationships across a broader mix of buyers, and reduce excessive dependence on any single destination. At the same time, agriculture should be managed with greater market diversification, given the continuing fragility of demand from China, while semiconductor exports require a disciplined balance between commercial opportunity, national-security controls and regulatory predictability.
The recommended strategy is therefore to concentrate on three fronts: accelerate execution in LNG and downstream energy exports; expand agricultural and commodity access across Asia, Latin America and other emerging markets; and protect long-term leadership in semiconductors, pharmaceuticals and advanced manufacturing through stable trade policy and target market development. The next phase of U.S. export growth will depend less on identifying entirely new products and more on strengthening delivery capacity, diversifying destination risk and securing durable access in strategically important markets.

Leadership Perspectives from Industry Events
Search
6Wresearch in the News
 Forbes
Citing 6Wresearch analytics to map global infrastructure and pharmaceutical industry trajectories.
 Bloomberg Law
Direct syndication of 6Wresearch's macro data points, capturing complex supply chain shifts.
 Reuters
Tracking industrial manufacturing adjustments and electronic security ecosystem scaling.
 Mint
Mint
Utilizing deep-tech sector market sizing to analyze global automation and robotics.
 The Economic Times
Anchoring features on industrial IoT growth metrics and connected smart-grid devices.
 Business Standard
Featuring strategic evaluations of Advanced Driver Assistance Systems (ADAS) and AI road safety.
 The Hindu
Spotlighting core commercial metrics ranging from unmanned aerial vehicles (UAVs) to consumer durables.
 Financial Express
Anchoring quarterly reviews on cross-border real estate tech and structural hardware manufacturing.
 Yahoo Finance
Syndicating the tracker's $30.1 billion untapped-market findings, spotlighting Japan, the US and China as India's top new-potential importers.
 India Today
Carrying the release on smartphones leading India's export potential to $94 billion by 2031, per 6WExportGTM data.
 Dailyhunt
Distributing the tracker findings to its regional readership, framing India's export diversification into Japan and Mexico.
 PR Newswire Original release
Publishing the full India Export Attractiveness Tracker 2026, detailing new trade corridors across iron ore, LCVs and pharmaceuticals.
 The Industrial
Highlighting the tracker's read on India's semiconductor ambitions and long-term chip-assembly export potential.
 PTI News
Reporting on the $66.81 billion pharmaceuticals export opportunity flagged in the tracker, amid looming US generic-drug tariffs.
 Tribune India
Covering the tracker's tariff-versus-regulation analysis across India's mature export markets in the US, China and UAE.
 ANI News
Amplifying the report's findings on polished diamonds, refined petroleum and medicines as India's core export engines.
 International Business Magazine
Covering the report's insight into how AEB, blind spot detection, and driver monitoring are reshaping India's ADAS market.
 Focus Gaming News
Highlighting the research forecast for Egypt's gambling market, projecting steady growth through 2032.
Thought Leadership and Analyst Meet





Our Clients








Latest Reports
- Austria X-ray Imaging Devices Market (2026-2032)
- Armenia X-ray Imaging Devices Market (2026-2032)
- Antigua and Barbuda X-ray Imaging Devices Market (2026-2032)
- Angola X-ray Imaging Devices Market (2026-2032)
- Andorra X-ray Imaging Devices Market (2026-2032)
- Albania X-ray Imaging Devices Market (2026-2032)
- Afghanistan X-ray Imaging Devices Market (2026-2032)
- United States (US) X-ray Imaging Devices Market (2026-2032)
- United Kingdom (UK) X-ray Imaging Devices Market (2026-2032)
- United Arab Emirates (UAE) X-ray Imaging Devices Market (2026-2032)
Industry Events and Analyst Meet

EV India Expo 2026

HIMTEX 2026

India Refining Summit 2026

India EV Show 2026

EV tech India Expo 2026
Whitepaper
- Middle East & Africa Commercial Security Market Click here to view more.
- Middle East & Africa Fire Safety Systems & Equipment Market Click here to view more.
- GCC Drone Market Click here to view more.
- Middle East Lighting Fixture Market Click here to view more.
- GCC Physical & Perimeter Security Market Click here to view more.


