When Does Awareness Become Real Behaviour Change?
Public Perception and Awareness of Blood Donation – Pre vs. Post-Campaign
Objective
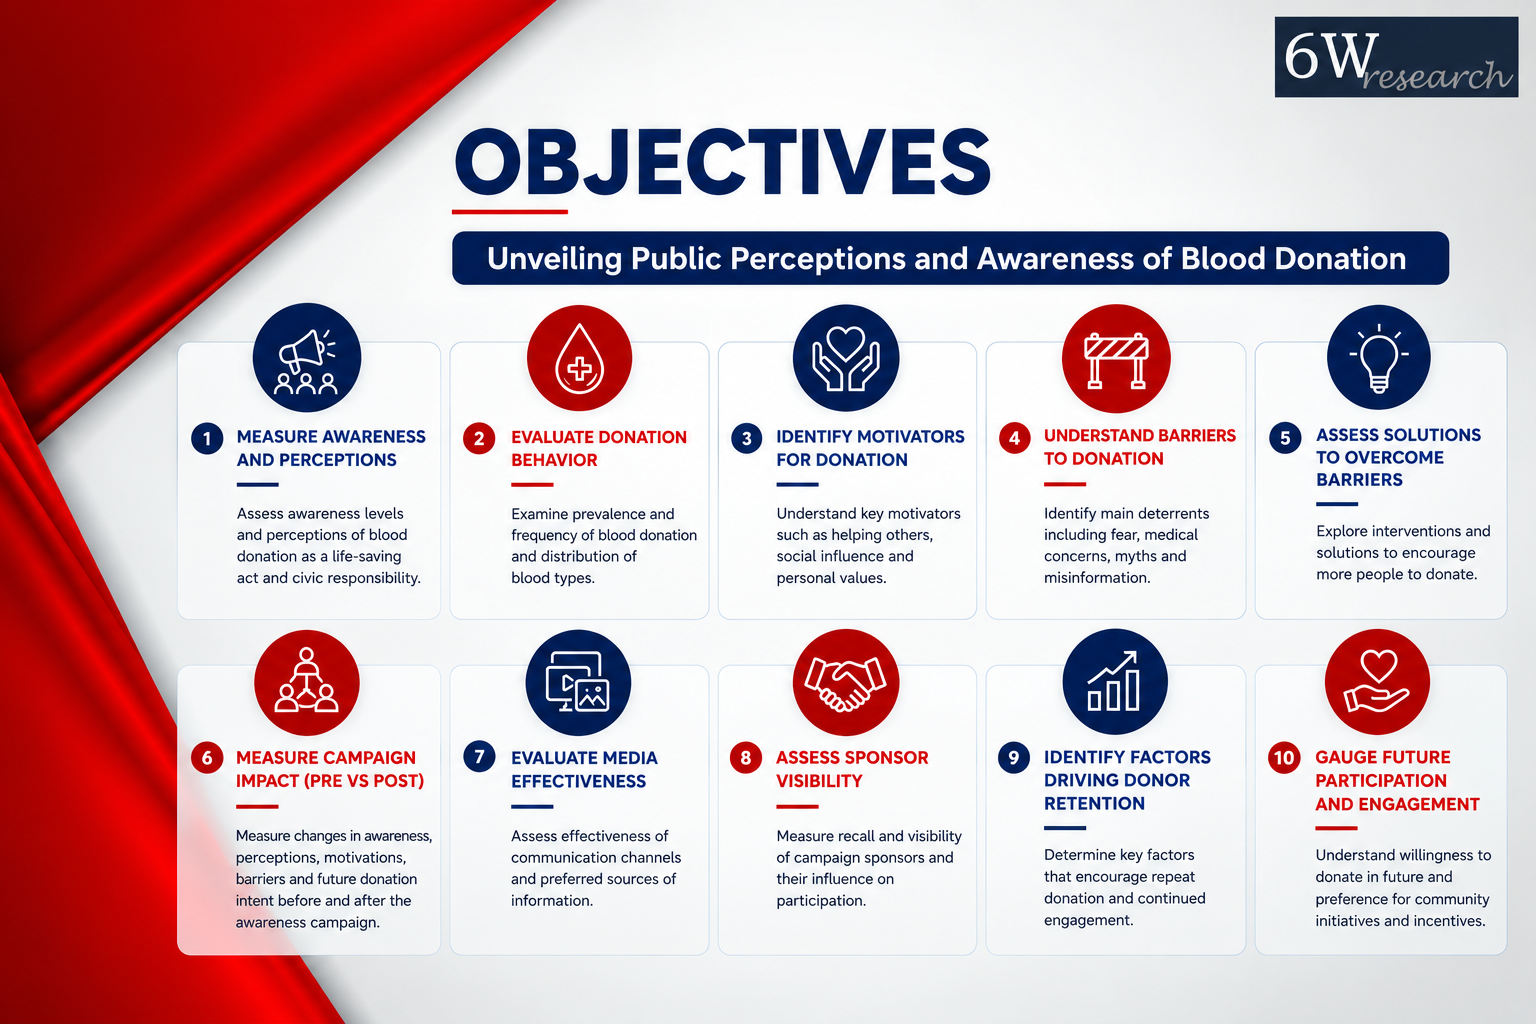
The objective was to measure changes in blood-donation awareness, perception, motivations, barriers, campaign recall and future donation intent before and after an awareness campaign. The research also evaluated media effectiveness, sponsor visibility and the factors influencing donor retention and continued participation.
Business Challenge
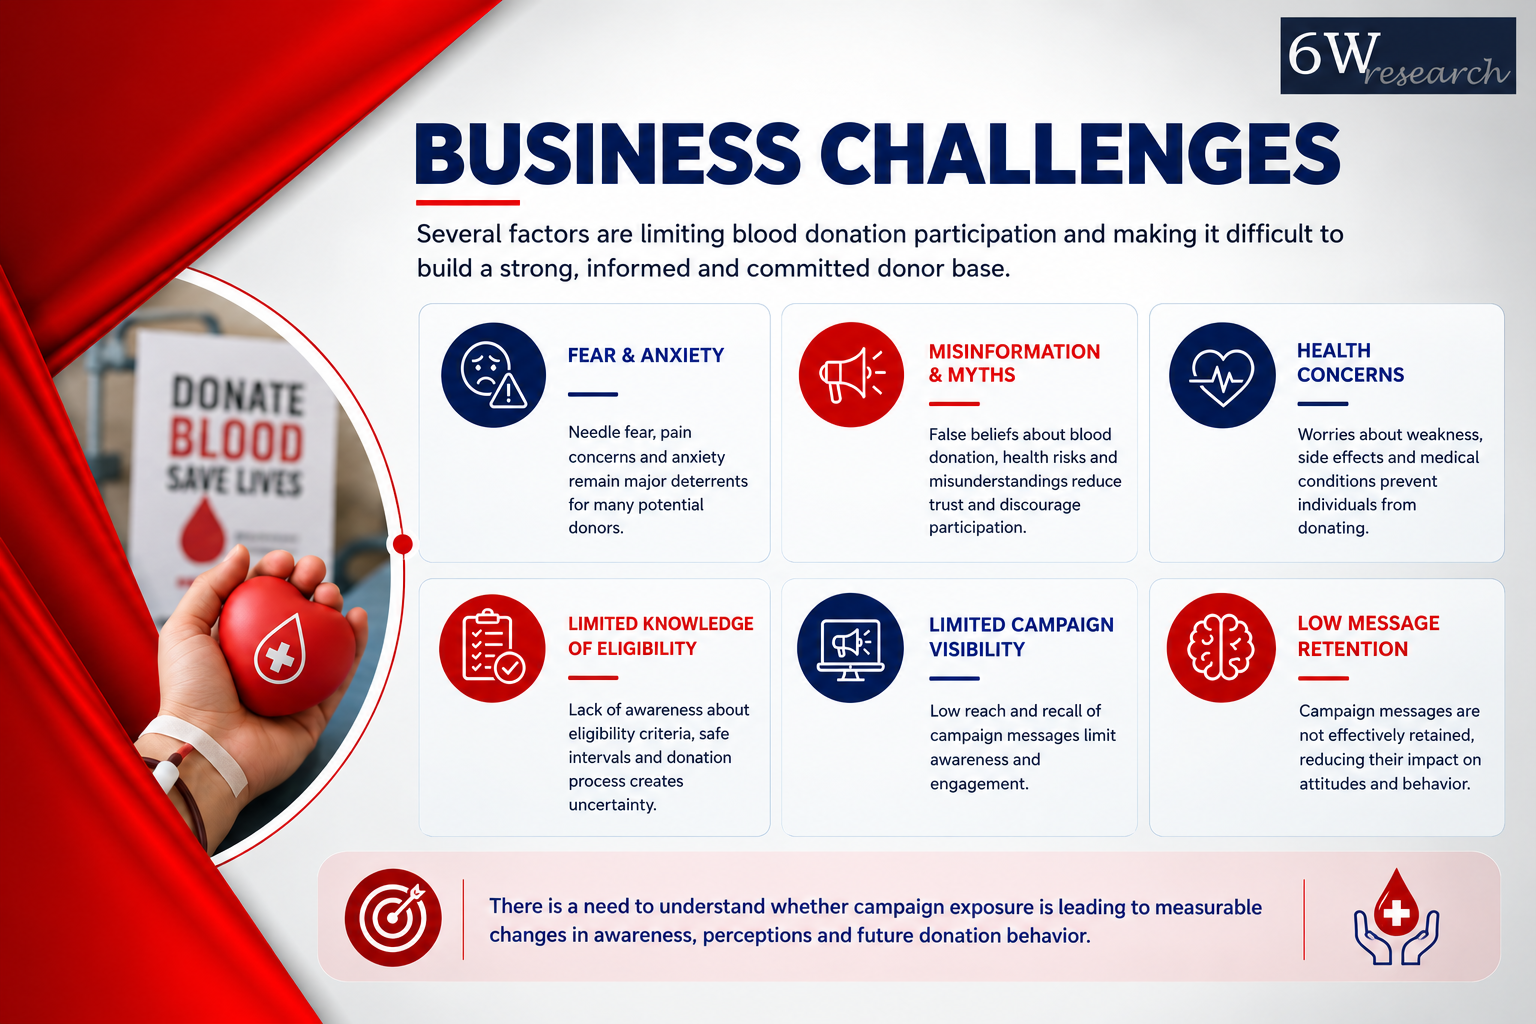
Limited participation due to fear, misinformation, health concerns, and limited knowledge of eligibility requirements. Campaign visibility and message retention were also limited, creating a need to determine whether campaign exposure was producing measurable changes in awareness, perceptions and future donation behavior.
How We Did It
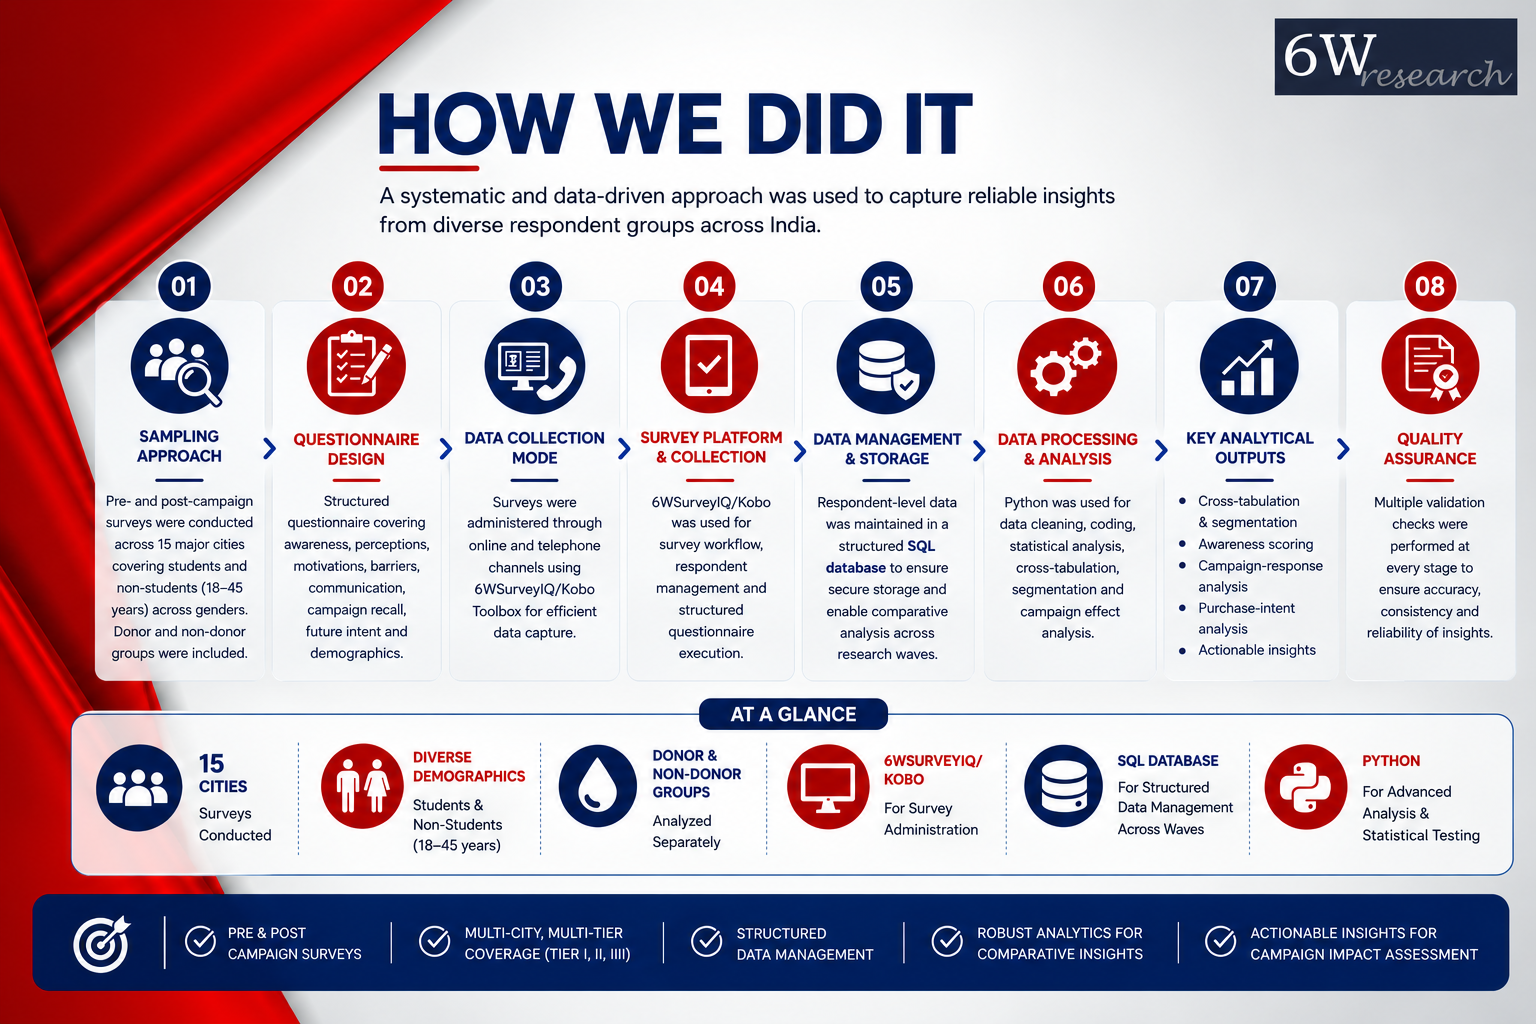
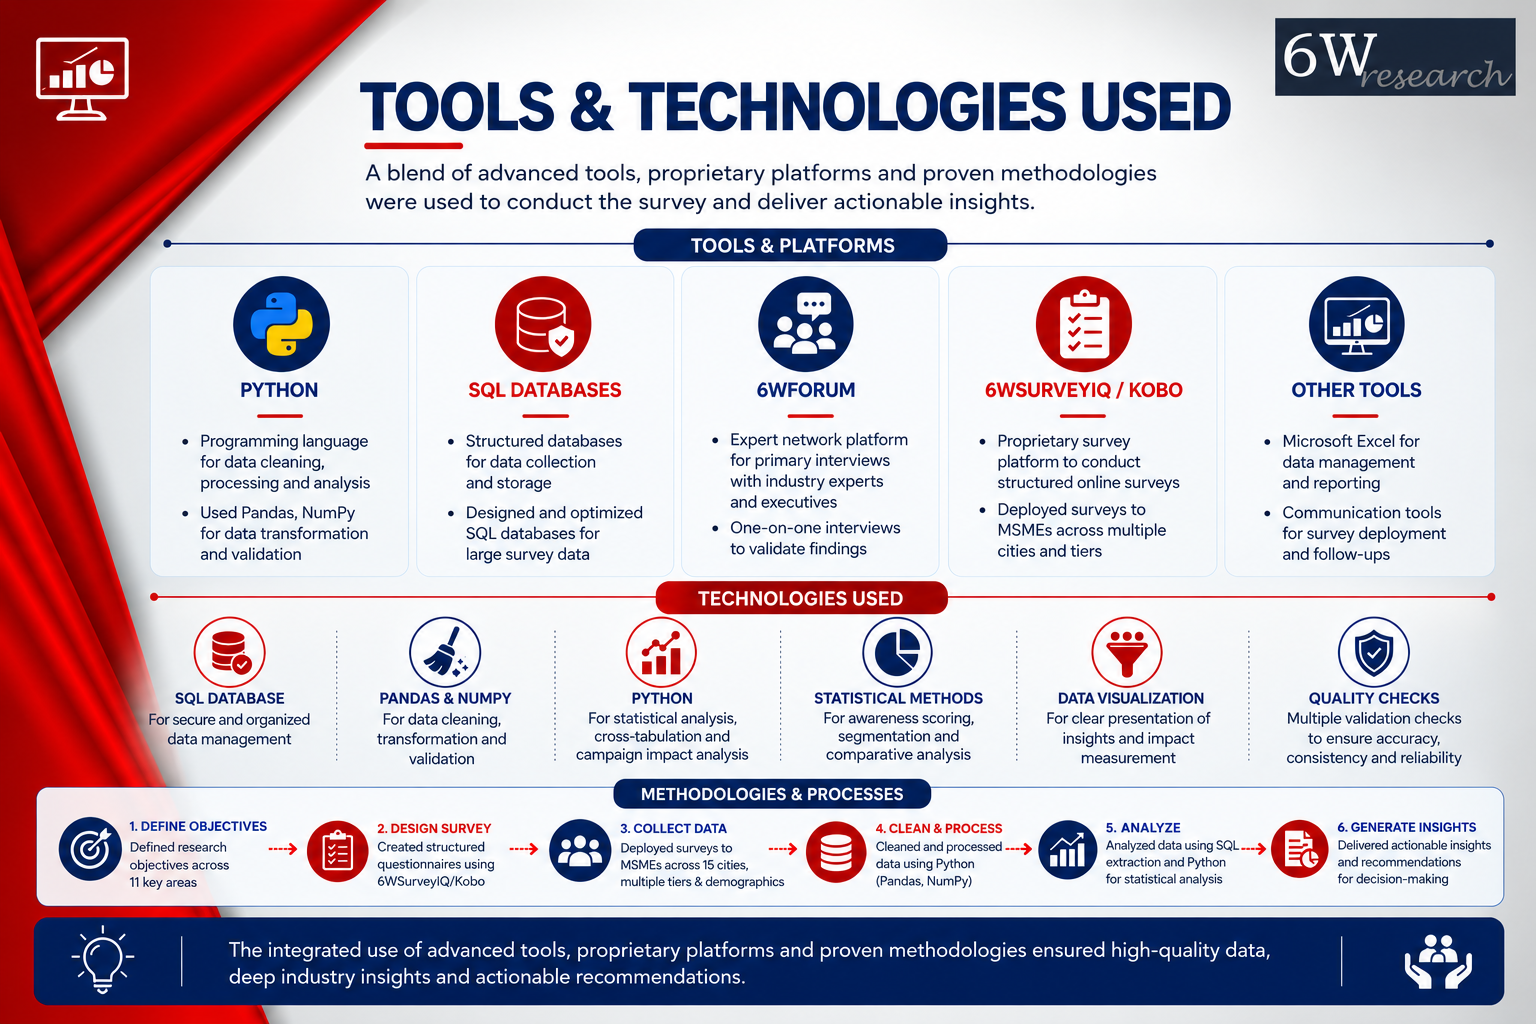
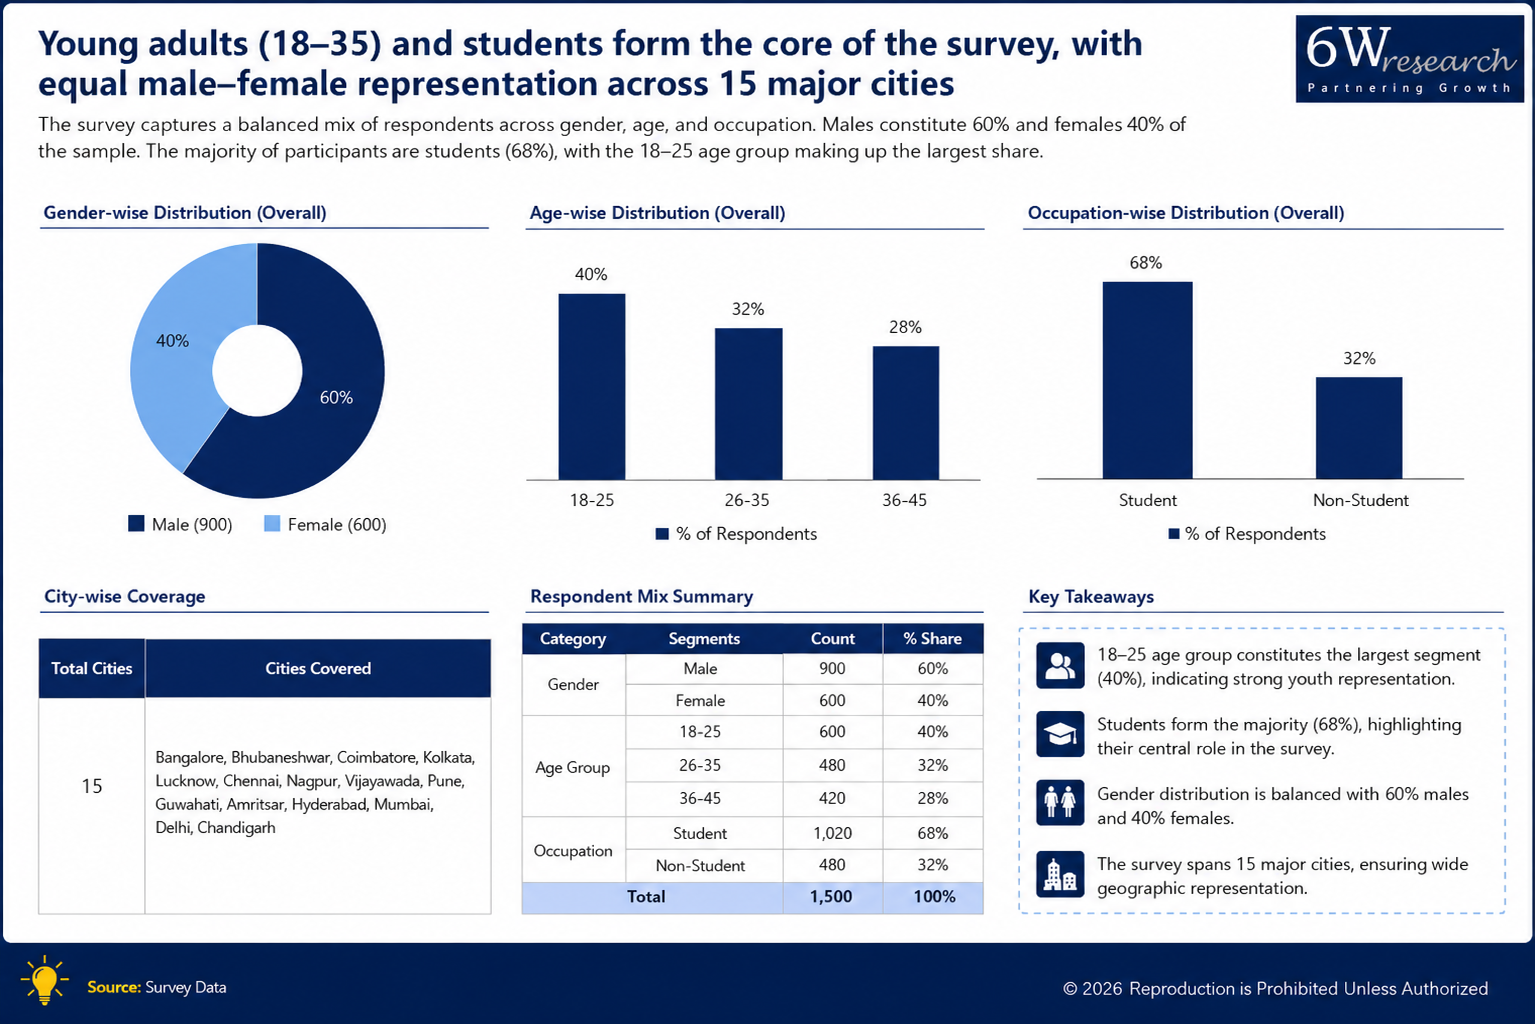
We used a structured pre- and post-campaign framework to measure how awareness, perceptions, motivations, barriers, message recall and donation intent shifted over the course of the campaign. Surveys ran across 15 cities, covering different market tiers and a defined mix of age, gender, education and occupation, with the same sampling structure kept consistent across both waves. Each wave covered 1,500 respondents, which let us make solid comparisons of what actually changed, both geographically and demographically. We analyzed donors and non-donors separately to distinguish shifts among existing donors from changes in attitude among people who hadn't donated yet. The research captured donation history, frequency and intent, perceived benefits, motivations, barriers like fear, anxiety and misinformation, awareness of eligibility and facilities, media habits, campaign recall, message retention, and willingness to engage going forward. The post-campaign wave was then compared against baseline to measure the actual point-by-point changes — eligibility awareness, perceived life-saving impact, future intent, reduced psychological barriers, recall and willingness to participate. Everything was captured at the respondent level to allow cross-tabulation and segment-wise comparison across waves. We combined descriptive analysis, pre/post comparison, demographic and behavioral segmentation, and donor-versus-non-donor profiling to move past simple recall numbers and actually understand how communication translated into changed knowledge, perceptions and intended behavior.
Key Findings
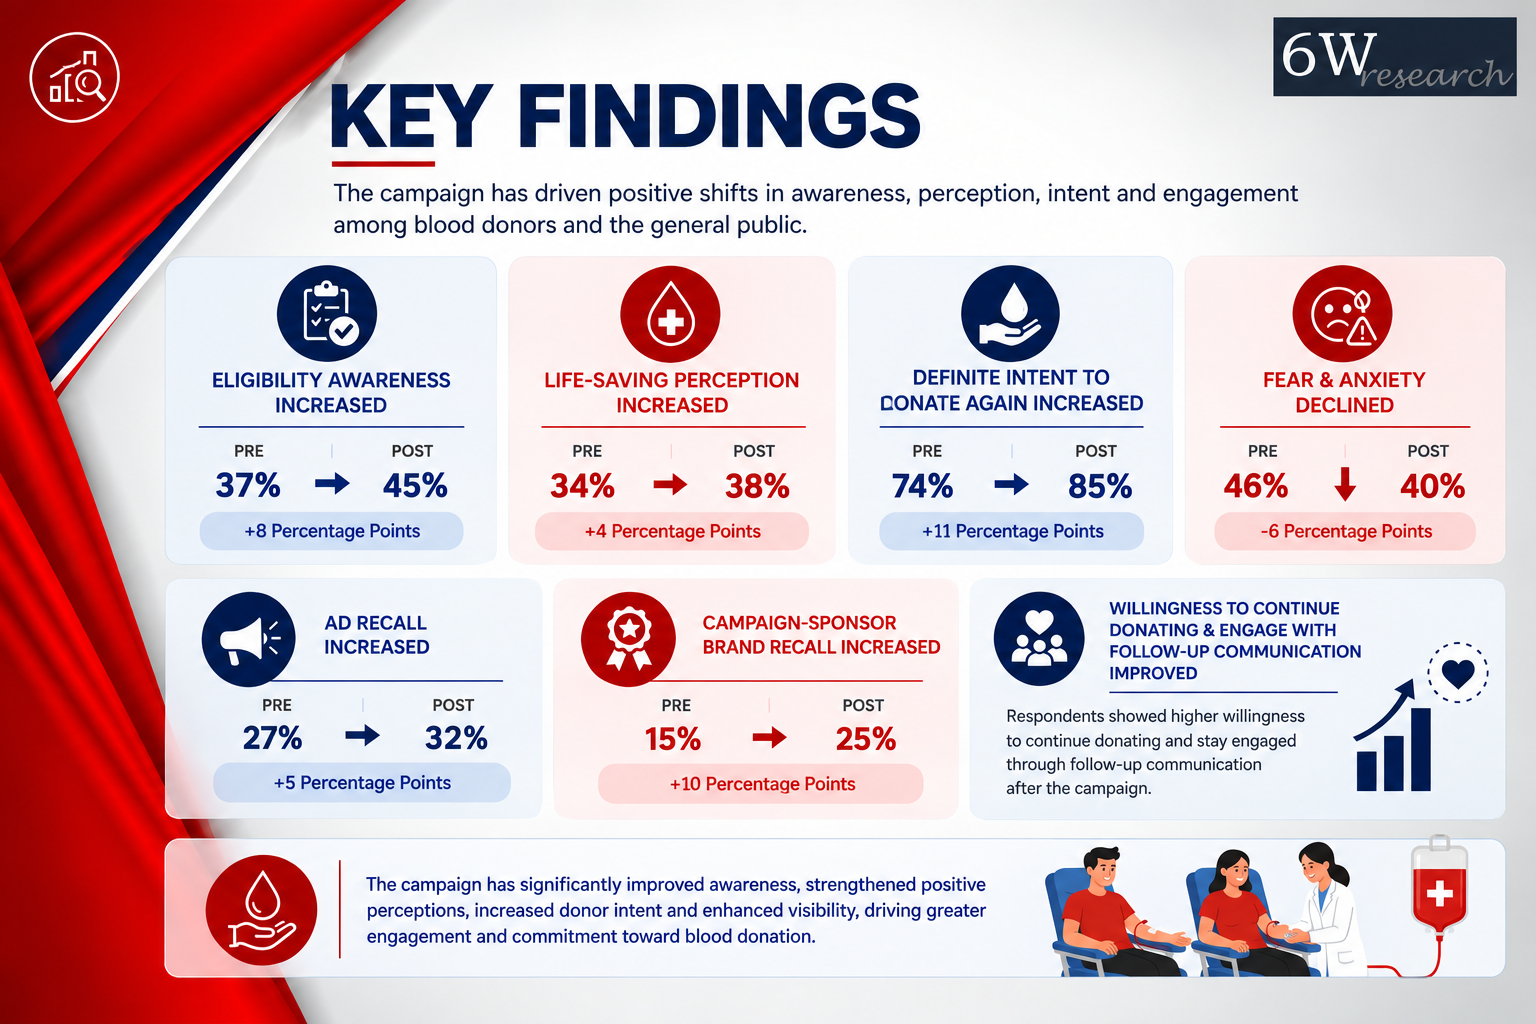
- Eligibility awareness increased from 37% to 45%.
- Life-saving perception increased from 34% to 38%.
- Definite intent to donate again increased from 74% to 85%.
- Fear and anxiety declined by 6 percentage points.
- Ad recall increased from 27% to 32%.
- Campaign-sponsor brand recall increased by 10 percentage points.
- Willingness to continue donating and engage with follow-up communication improved after the campaign.
Findings
The campaign moved the needle in a few meaningful ways. Awareness of donation eligibility climbed from 37% to 45% — an 8-point jump — though more than half of people are still in the dark, so this clearly needs ongoing communication rather than a one-off push. Perception of donation as life-saving also improved, up from 34% to 38%, and awareness of free health check-ups rose from 23% to 27%. The bigger win, though, was on actual intent — among existing donors, those who said they'd definitely donate again jumped from 74% to 85%, an 11-point rise. The core motivation of "helping others" also strengthened by 6 points as the top reason people gave. And it wasn't just donors — both donors and non-donors came away seeing blood donation as more important and relevant than before.
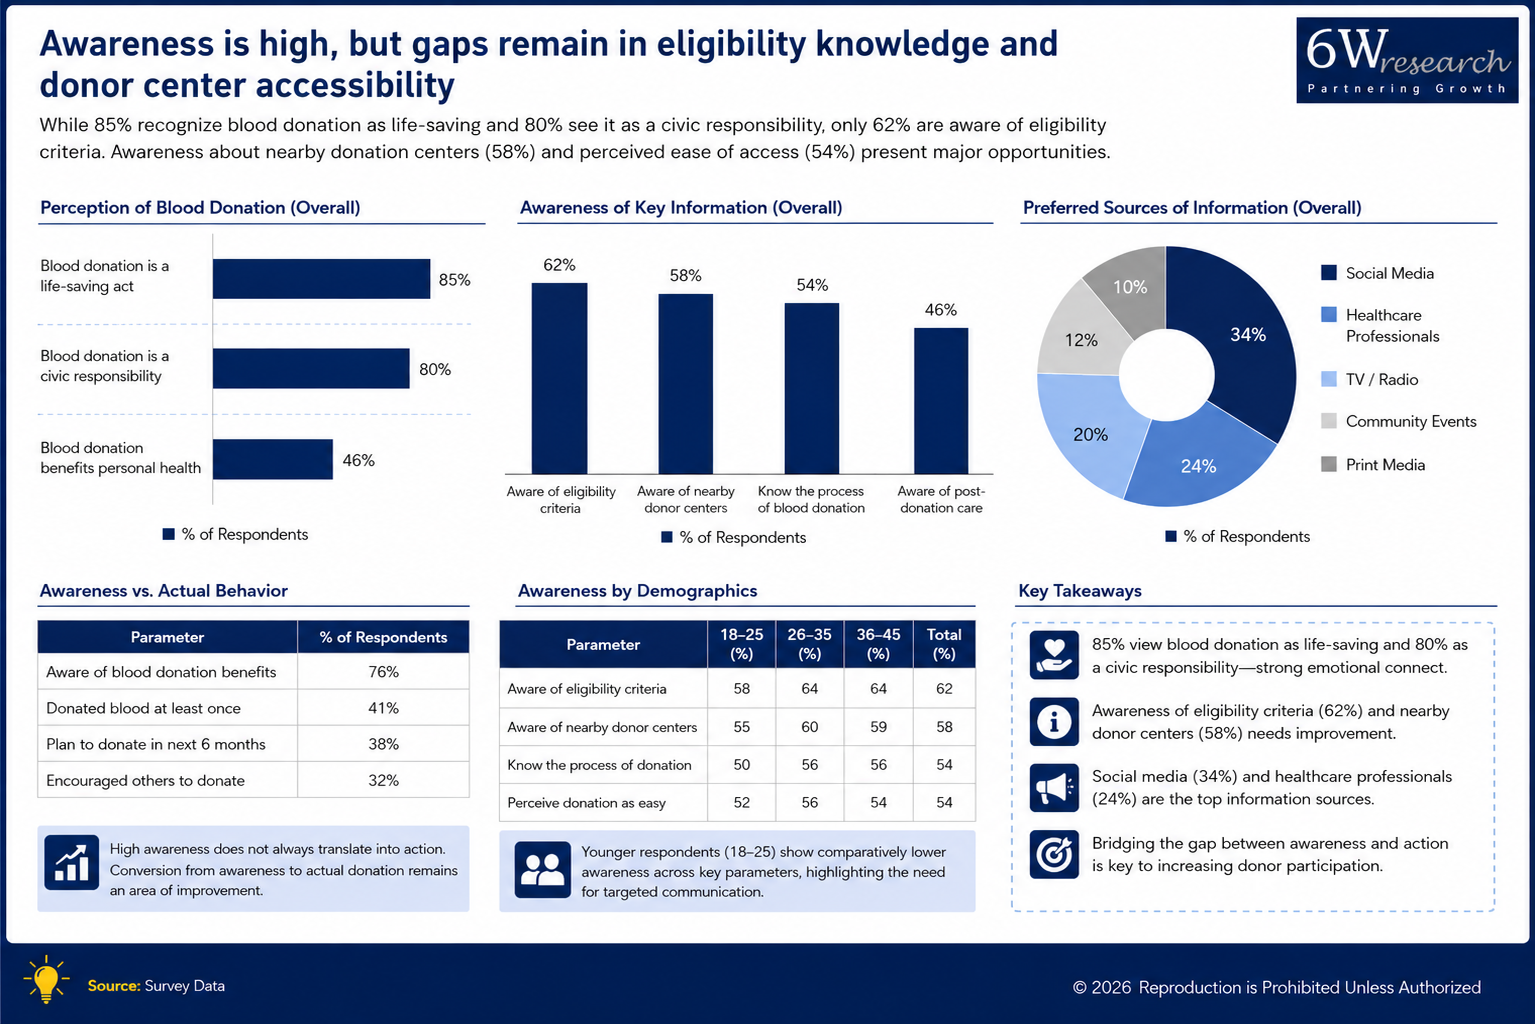
The campaign clearly chipped away at some of the psychological and informational barriers that used to hold people back. Fear and anxiety dropped by 6 percentage points, and lack of awareness fell by 5 — real progress on building confidence and clearing up misconceptions. But it wasn't uniformly positive: awareness around health-risk reduction actually dipped slightly, and so did perceive psychological satisfaction as a benefit, suggesting future messaging needs more balance instead of leaning so heavily on rational, functional arguments. Needle-related worries stayed stubbornly high, pointing to a need for more direct reassurance about safety and discomfort. On the bright side, campaign recall rose from 27% to 32%, and openness to future communication grew by 6 points. Overall, the campaign-built awareness and willingness — but converting that into consistent participation will take sustained education, better message retention, and more targeted reassurance.
Business Impact
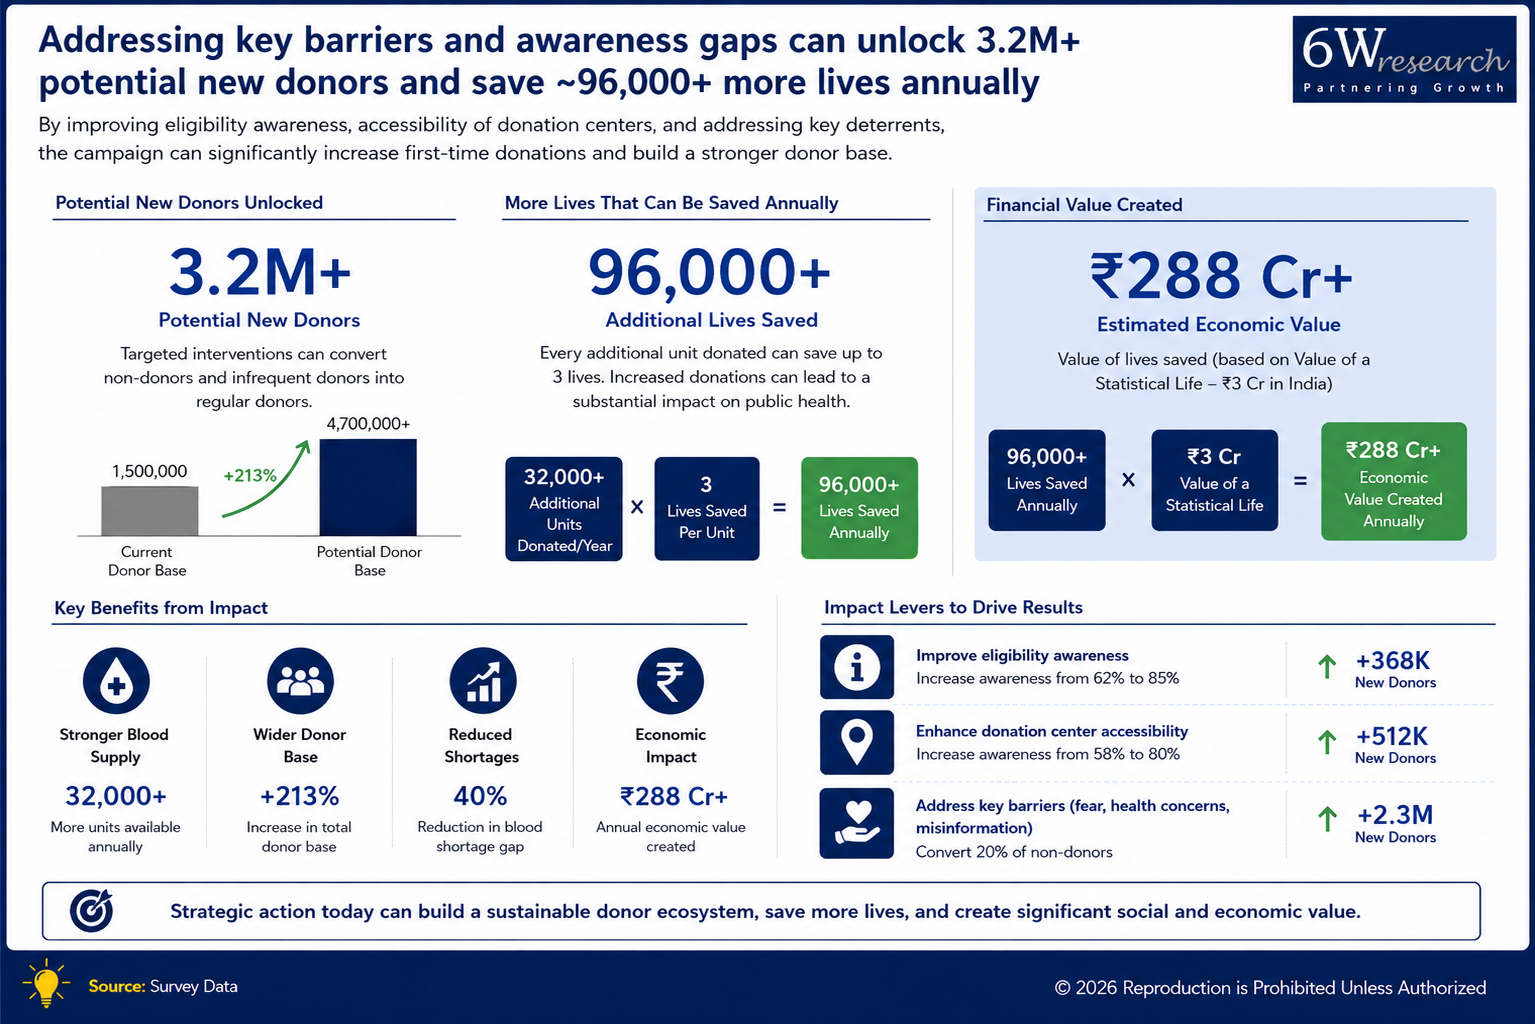
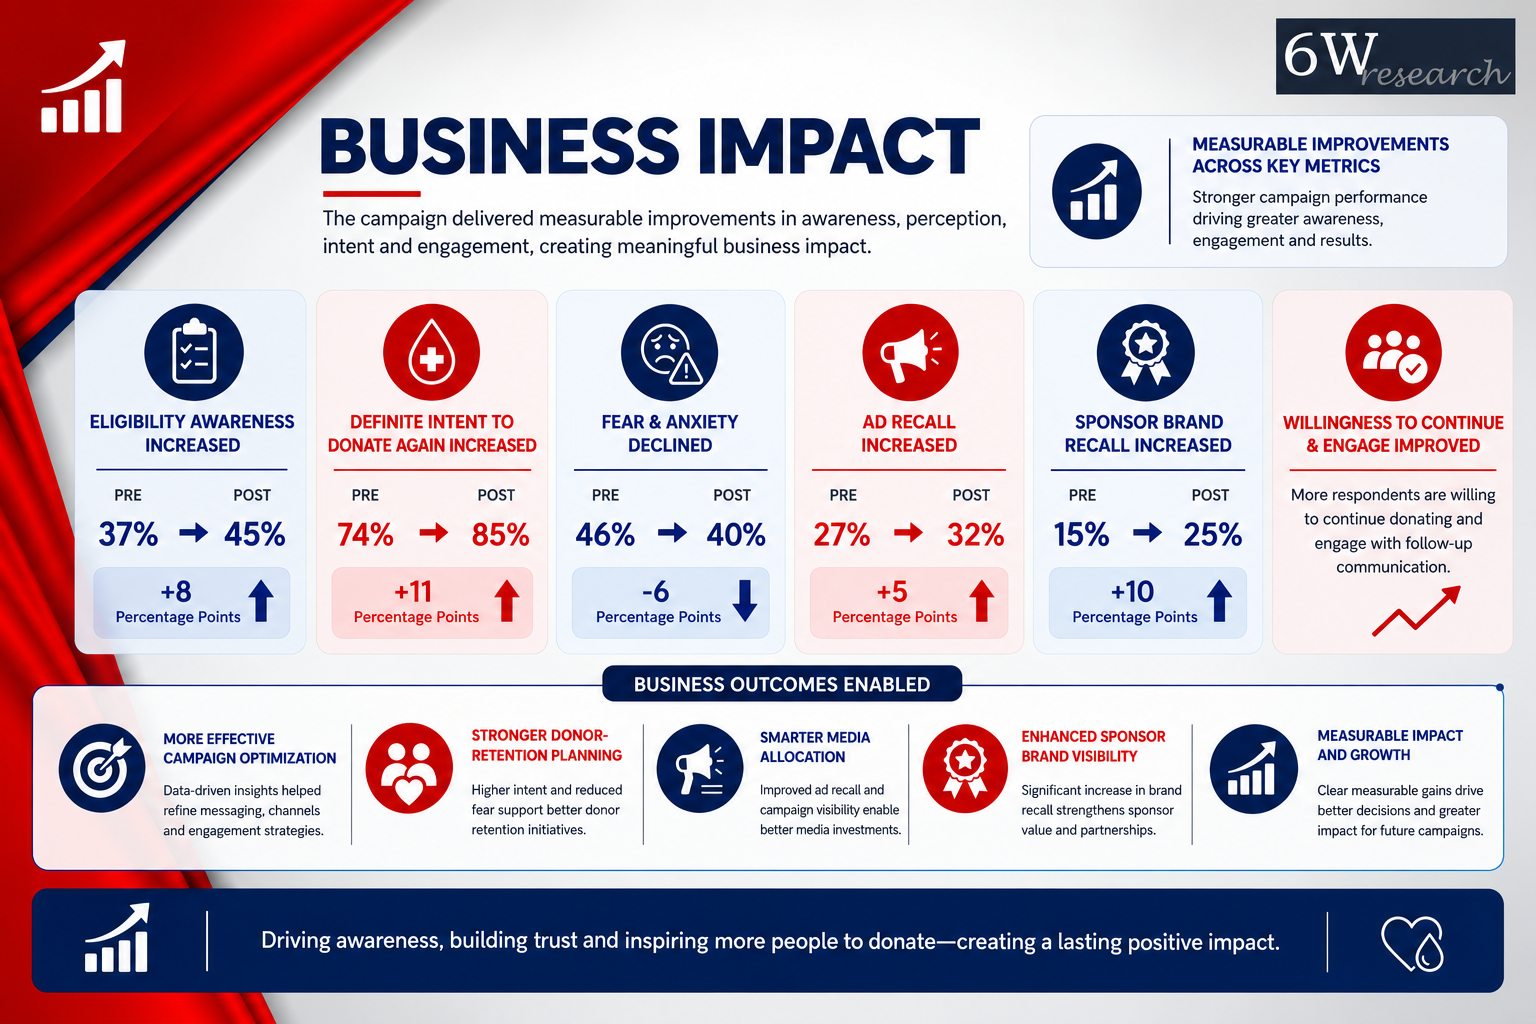
Awareness around eligibility moved up 8 points, from 37% to 45%, and intent to donate again climbed 11 points, from 74% to 85%. Fear and anxiety dropped 6 points, ad recall rose 5 points, and sponsor brand recall jumped 10 points, from 15% to 25%. Numbers like these are exactly what makes campaign optimization, donor retention planning, media allocation, and sponsor visibility decisions easier to get right.


