Where Are the Biggest Opportunities to Win in Fire & Security Markets?
GTM on India Controls Fire Security Products
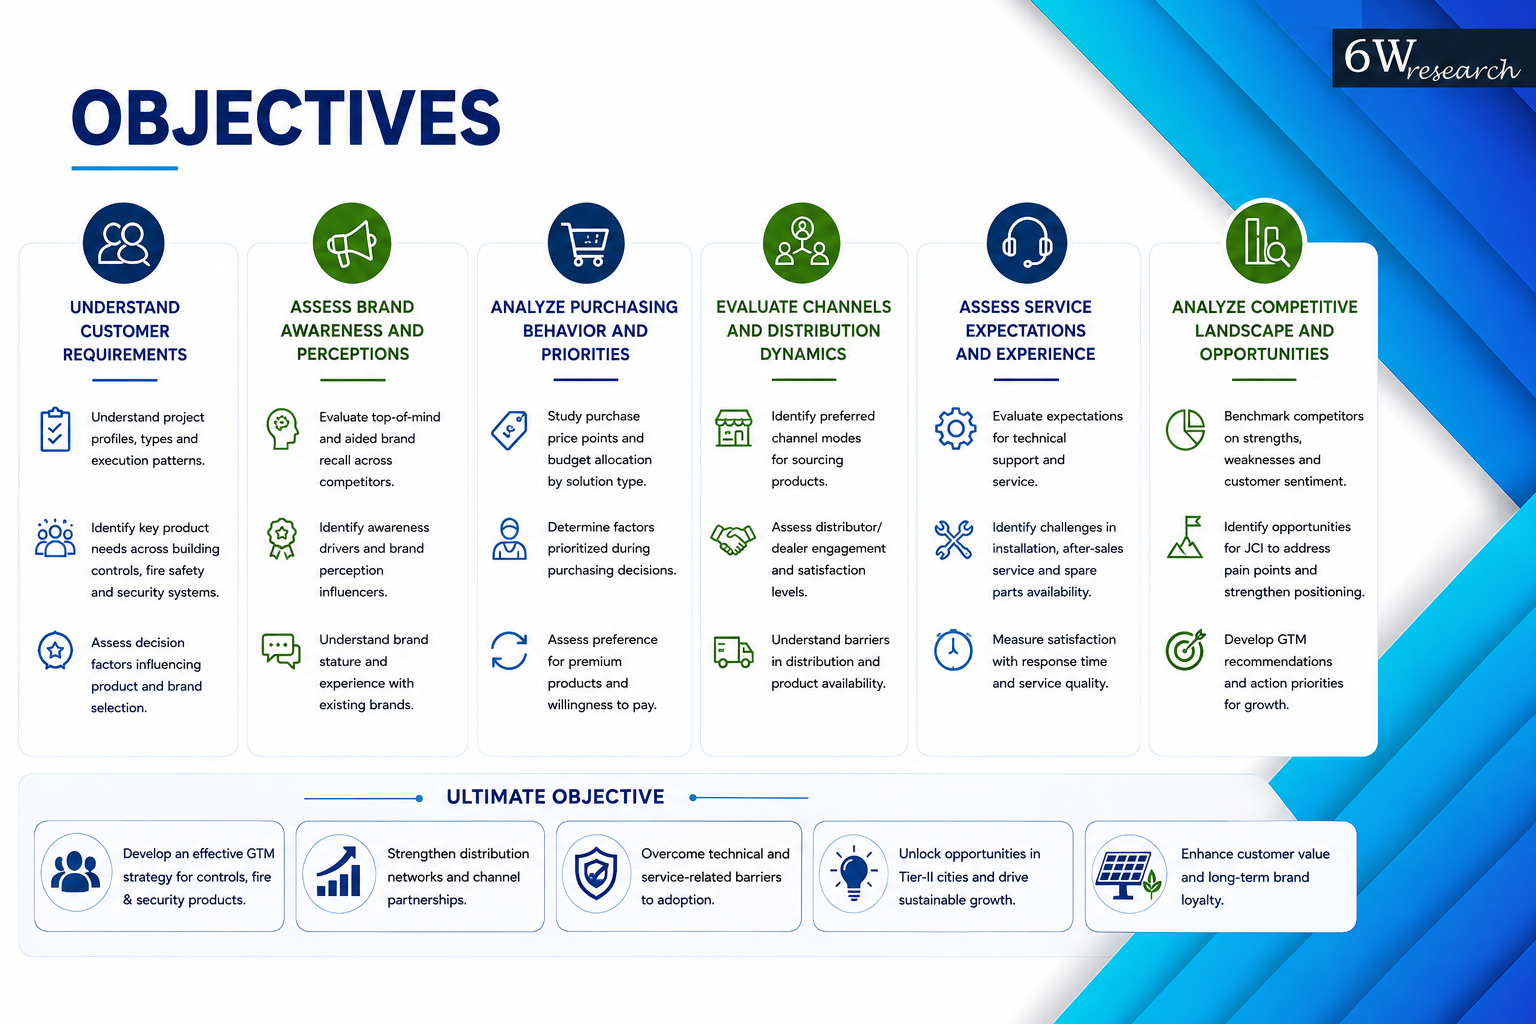
Objective
The main objective was to create a GTM strategy for controls, fire, and security products by analysing some important aspects such as requirements of the customers, brand awareness, buying behavior, channels, pricing, service expectations, and competitive positioning in Tier-II cities. Also, the study aimed to identify opportunities to enhance distribution and to address technical as well as service-related obstacles.
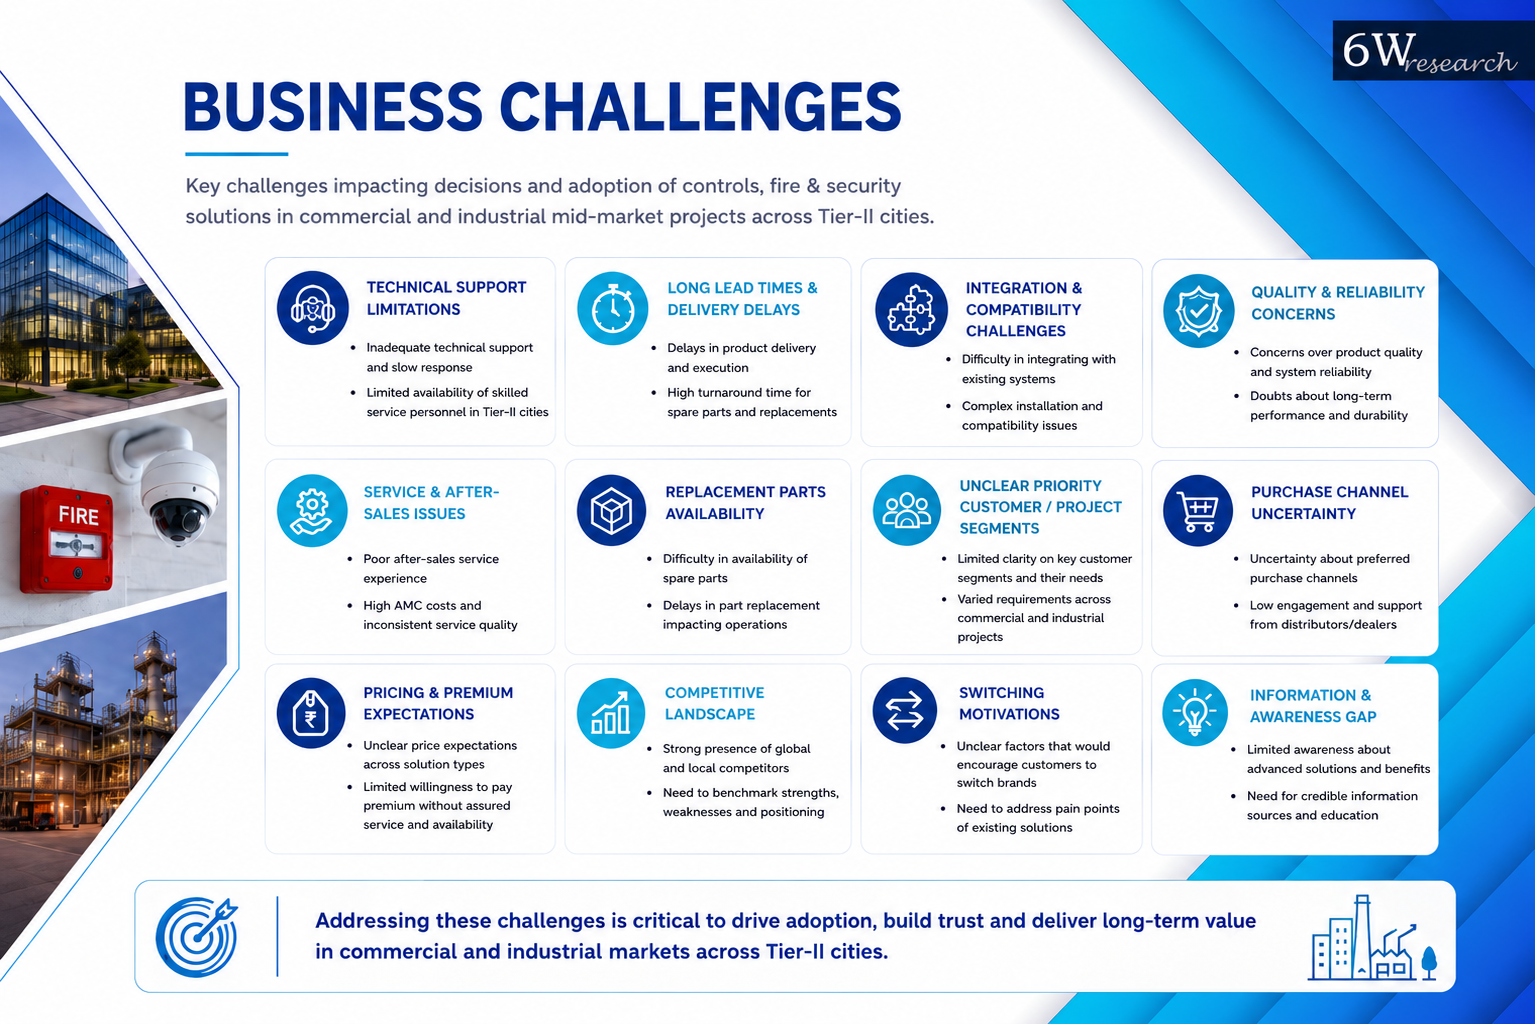
Business Challenge
Customers are tackling with technical-support limitations, extended delivery times, incorporation challenges, quality concerns, and service issues. The business required a clearer understanding of priority customer segments, purchase channels, pricing expectations, competitor strengths, and the reasons that would enhance customers to explore brands or pay a premium for upgraded service and availability.
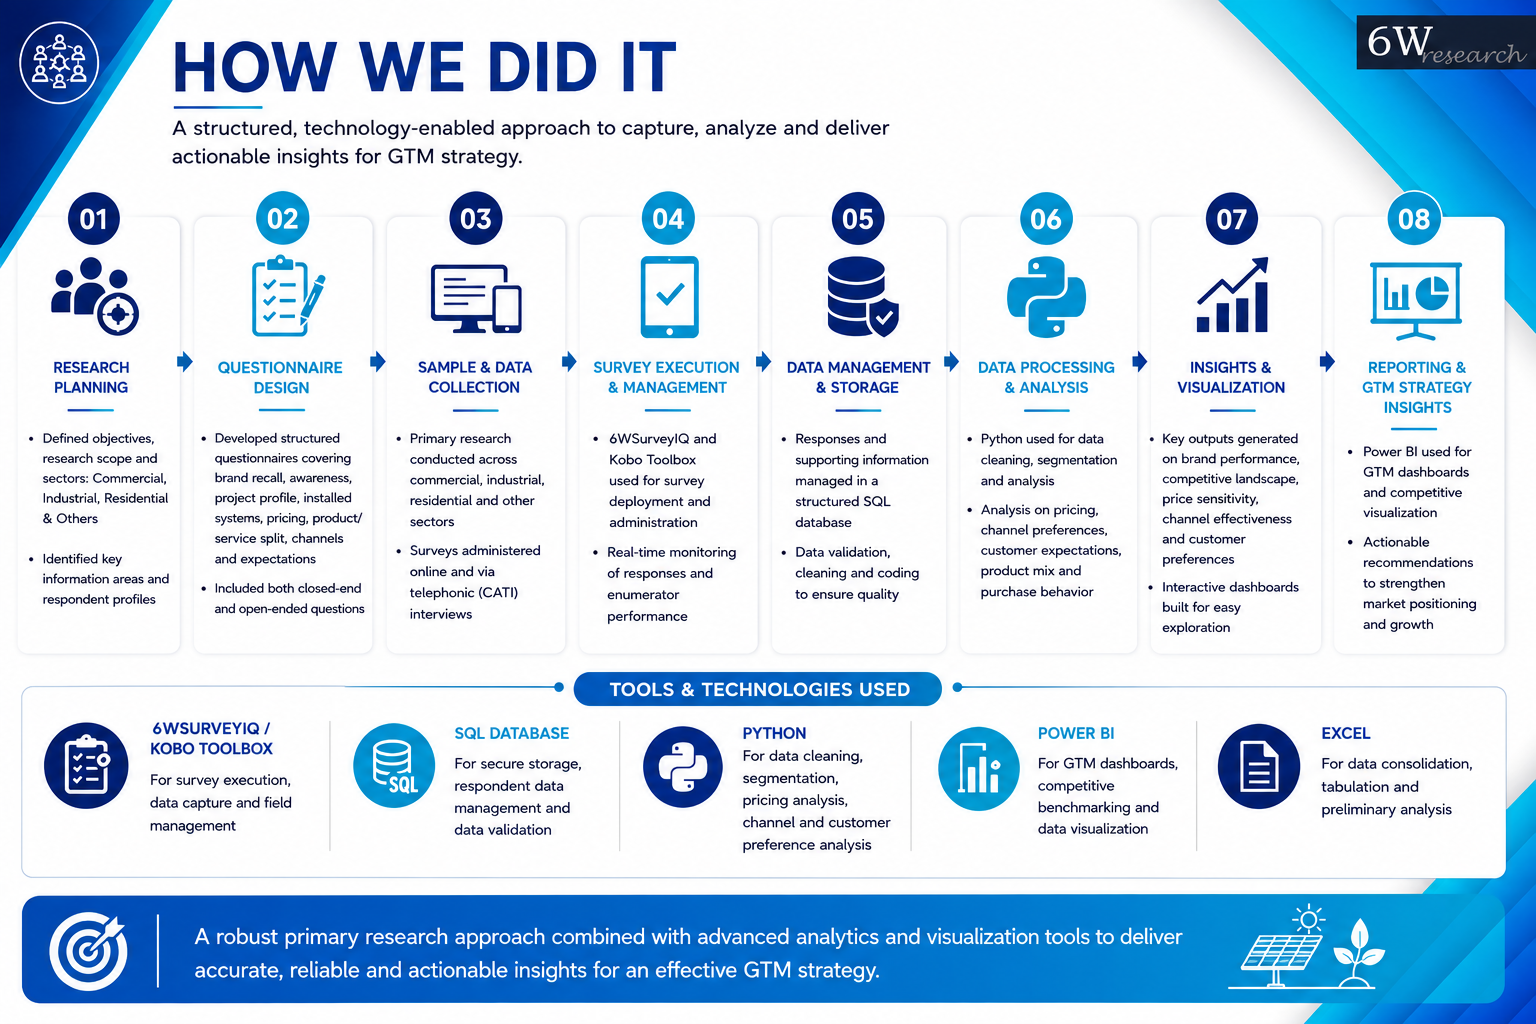
How We Did It
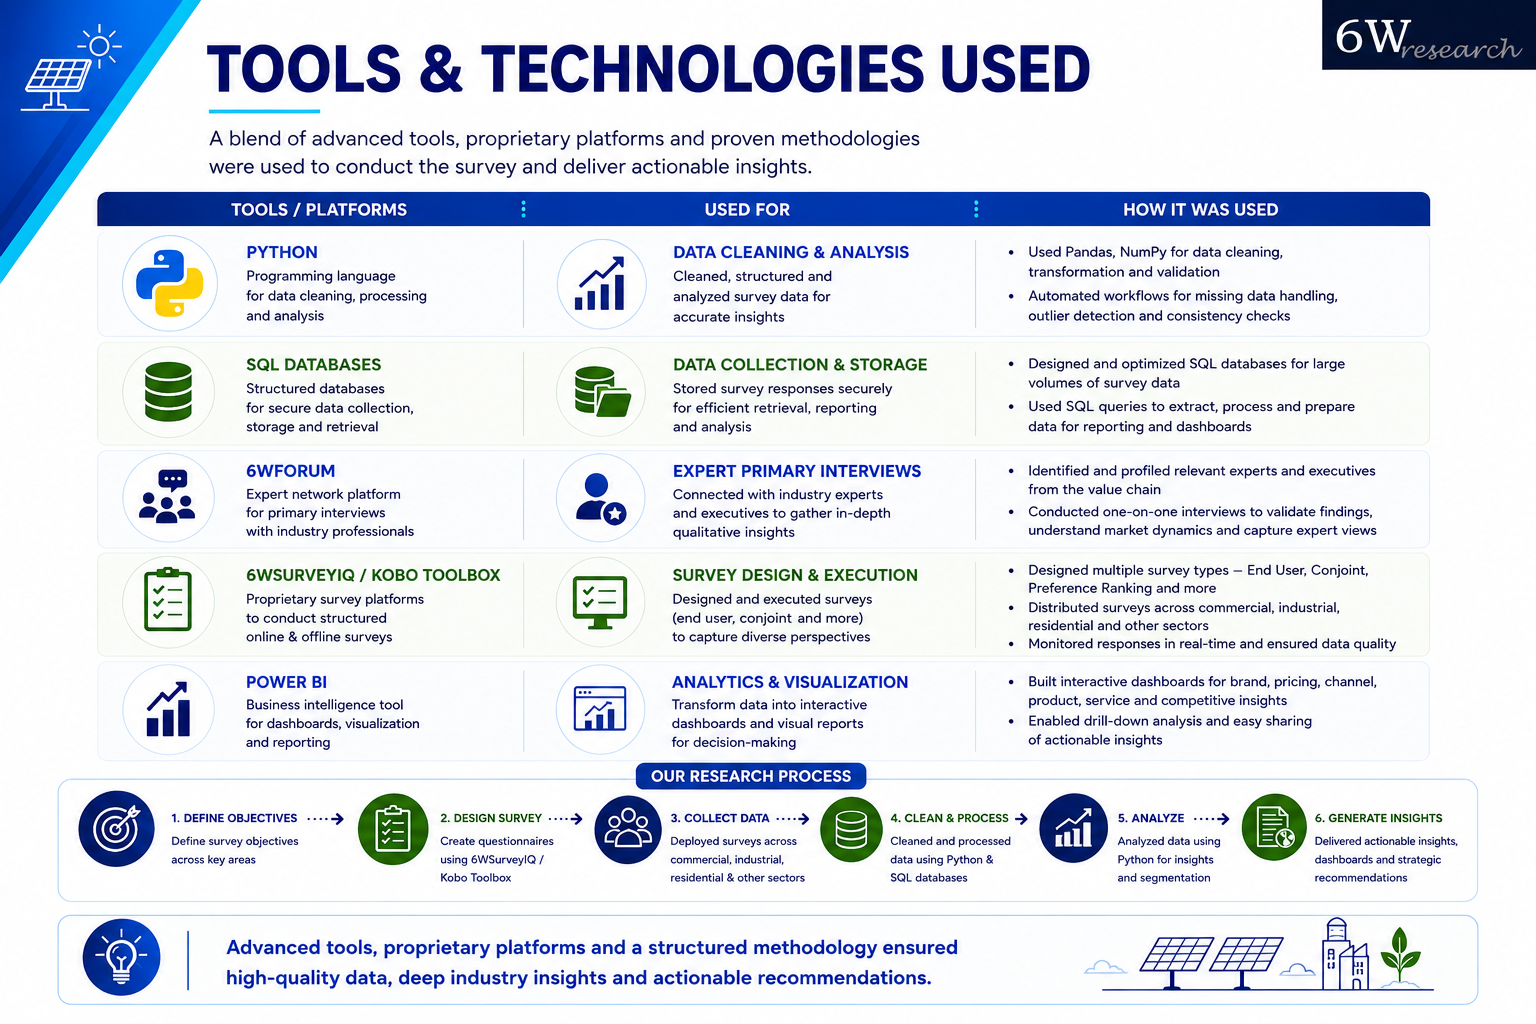
Primary research covered commercial, industrial, residential and other project categories to build a full picture of the controls, fire safety and security market across Tier-2 cities in India. We looked at project profiles, type, scale and annual value across a broad respondent base spanning multiple cities, covering both existing and new project requirements. The research assessed top-of-mind and aided brand recall, sources of brand awareness, installed systems, price points, product-versus-service cost splits, willingness to pay a premium, channel modes and channel selection criteria. We went deep across building control, fire safety and security solutions — lighting controls, water management, fire alarms, extinguishers, smoke/heat detectors, CCTV, video management software, access control and related systems. Brands were evaluated on product features, quality, reliability reputation, warranty, after-sales support, price, proximity, customization and system compatibility. We also looked at pain points, switching triggers, maintenance preferences and expected service levels to identify opportunities and barriers. Channel behavior was assessed across distributors, dealers, integrated system providers, direct purchases and e-commerce, with particular attention to how much known dealers and recommendations actually matter. 6WSurveyIQ/Kobo handled survey execution, SQL managed the respondent data, and Python was used for segmentation, pricing analysis and channel analysis. Power BI turned it all into interactive GTM dashboards and competitive visualizations, connecting market evidence, customer behavior and channel insights into practical go-to-market recommendations.
Key Findings
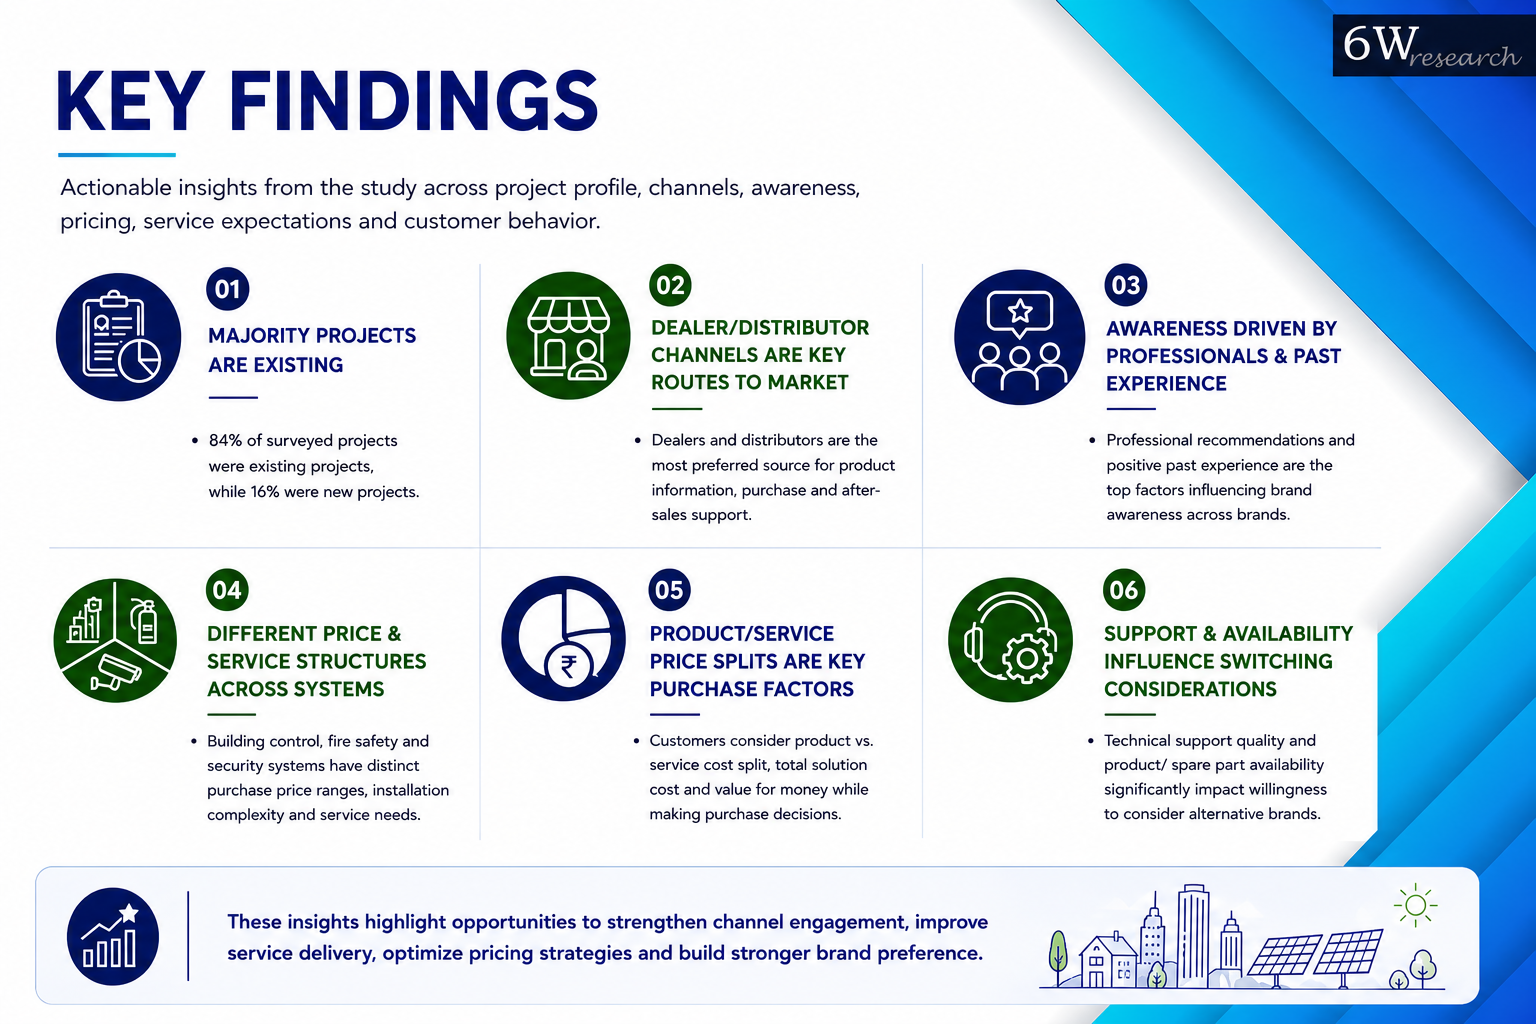
- 84% of surveyed projects were existing projects.
- Dealer/distributor channels were important routes to market.
- Professional recommendations and past experience strongly influenced awareness.
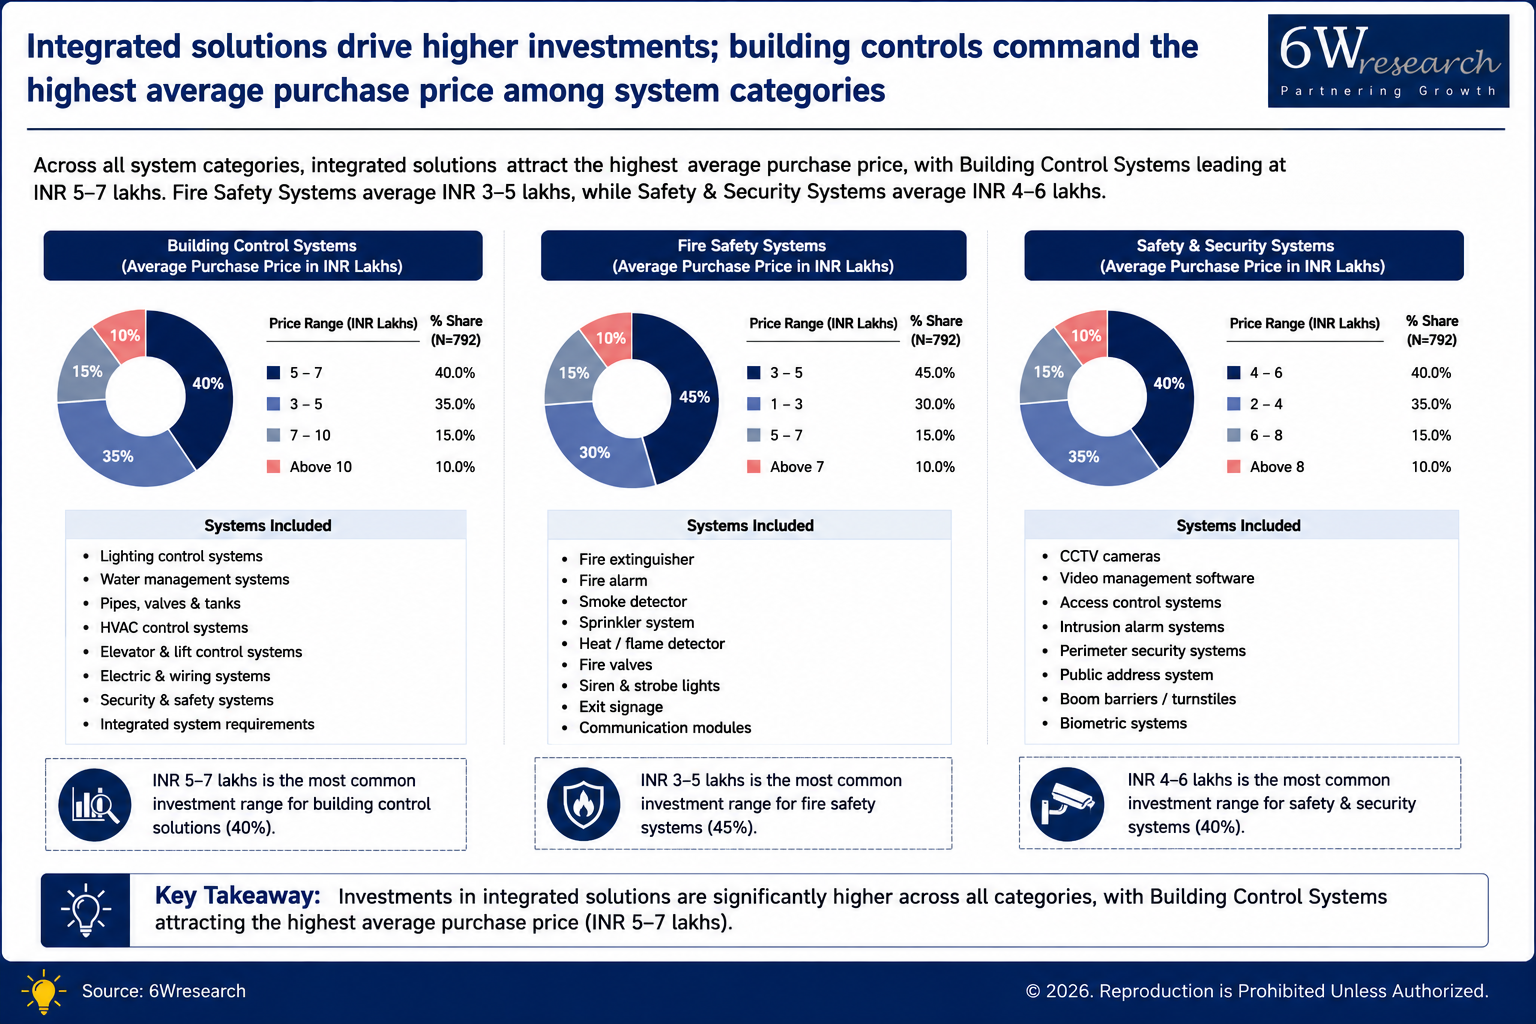
- Building-control, fire-safety and security systems showed different price and service structures.
- Product/service price splits were important purchase considerations.
- Technical support and product availability influenced customer willingness to consider alternatives.
Findings
This market runs almost entirely on relationships. Distributors and dealers are the clear preferred channel across building controls, fire safety and security products, and customers strongly favor dealers they already know, often acting on word-of-mouth or recommendations. That makes local presence and trust especially important here, given how technical these solutions can be — customers need real guidance, not just a transaction. So, the channel isn't just a sales pipeline; it's a big part of how confident customers feel about the purchase. Investing in dealer and distributor relationships would help both reach and how quickly customers can get service or replacements when they need them.
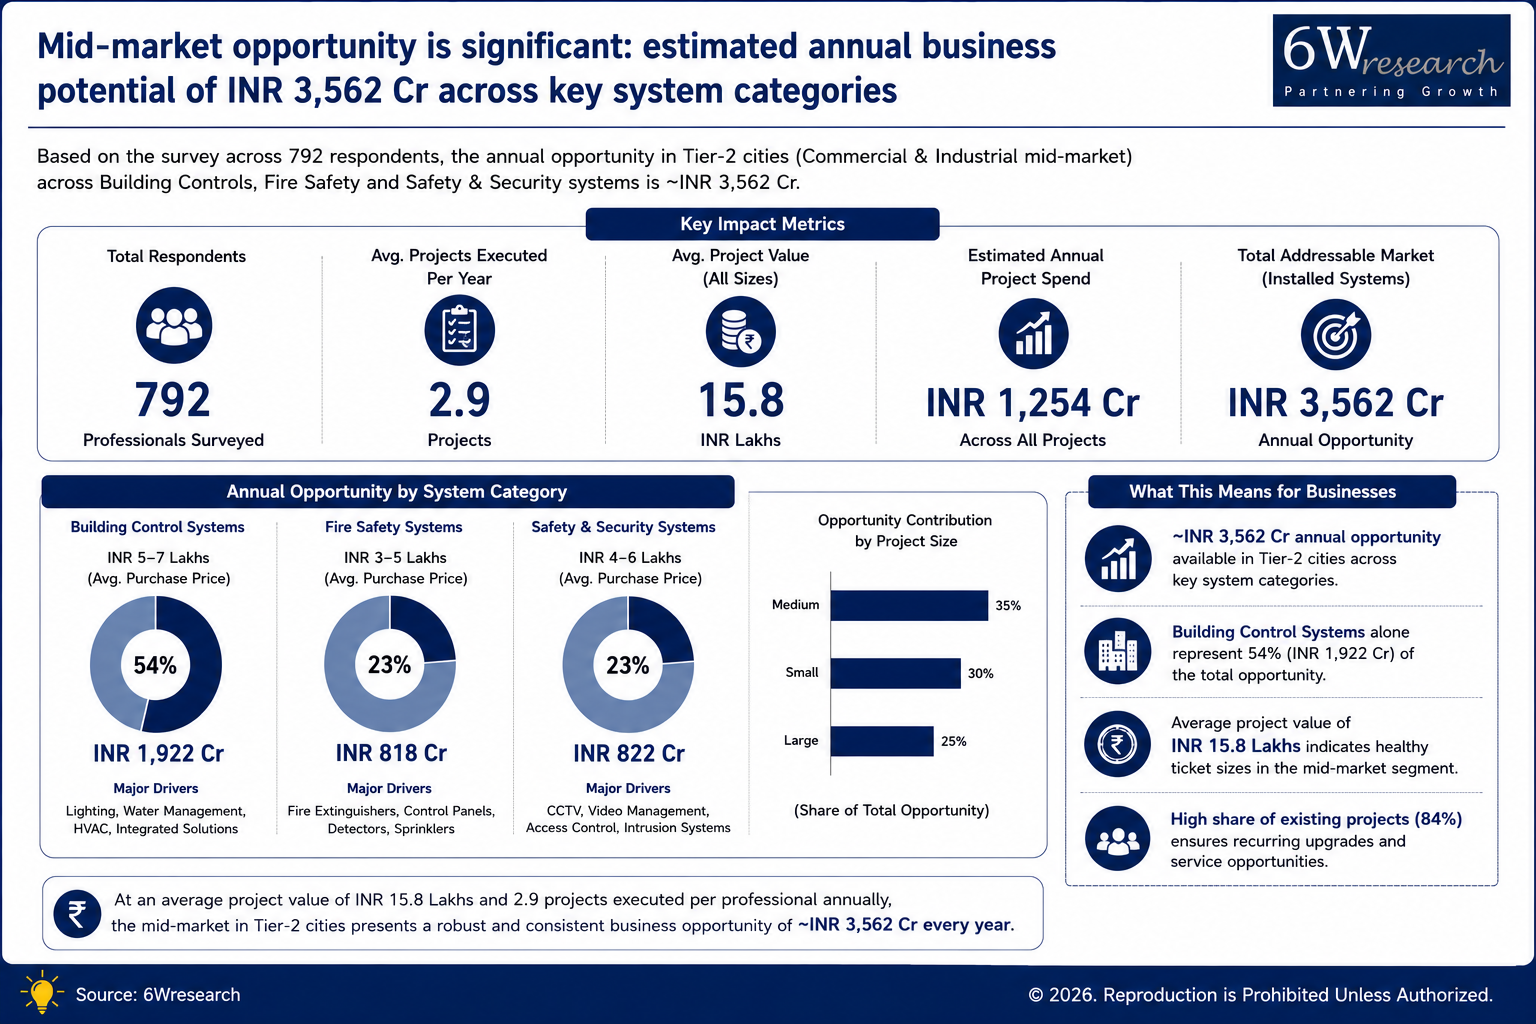
Existing installations are a real opportunity for repeat business – but only if the service holds up. Responsiveness is important because the majority of customers use on-demand service for maintenance. Common pain points: integration issues, hard-to-source replacement parts, cost overruns, weak technical support, long delivery time. Among non-users, good after-sales service came through as the single biggest reason they'd consider switching brands, ahead of product quality, faster lead times, and part availability. So this isn't purely a price game — brands that pair reliable products with strong service, technical support, and fast issue resolution are the ones that win back replacement and upgrade business.
Business Impact
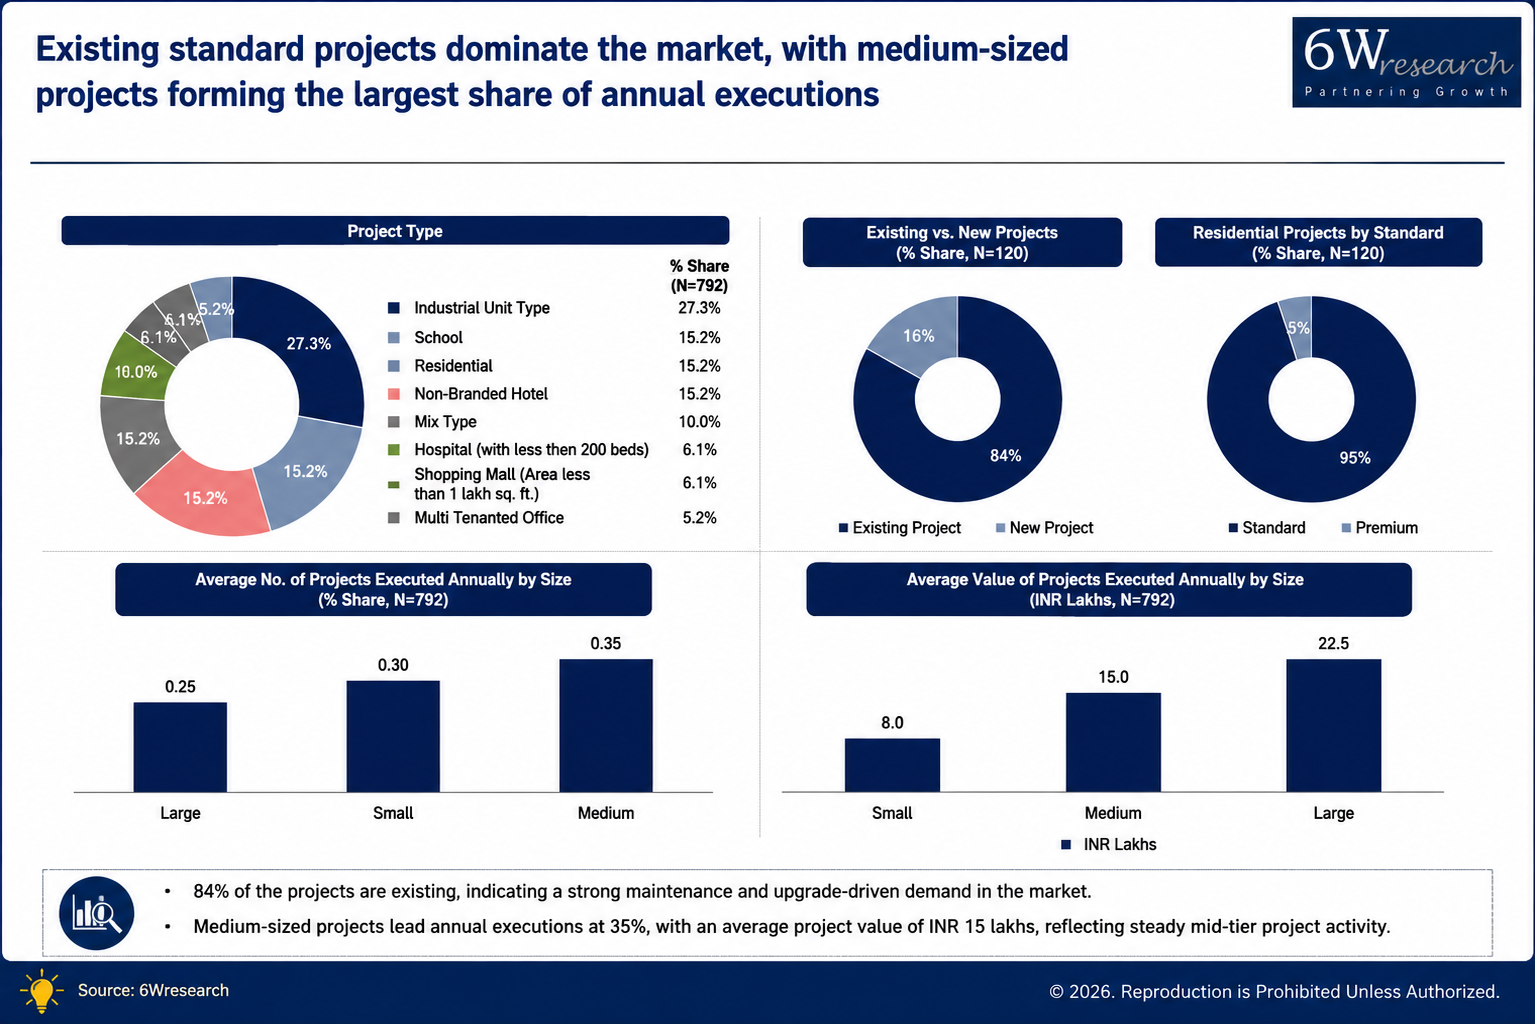
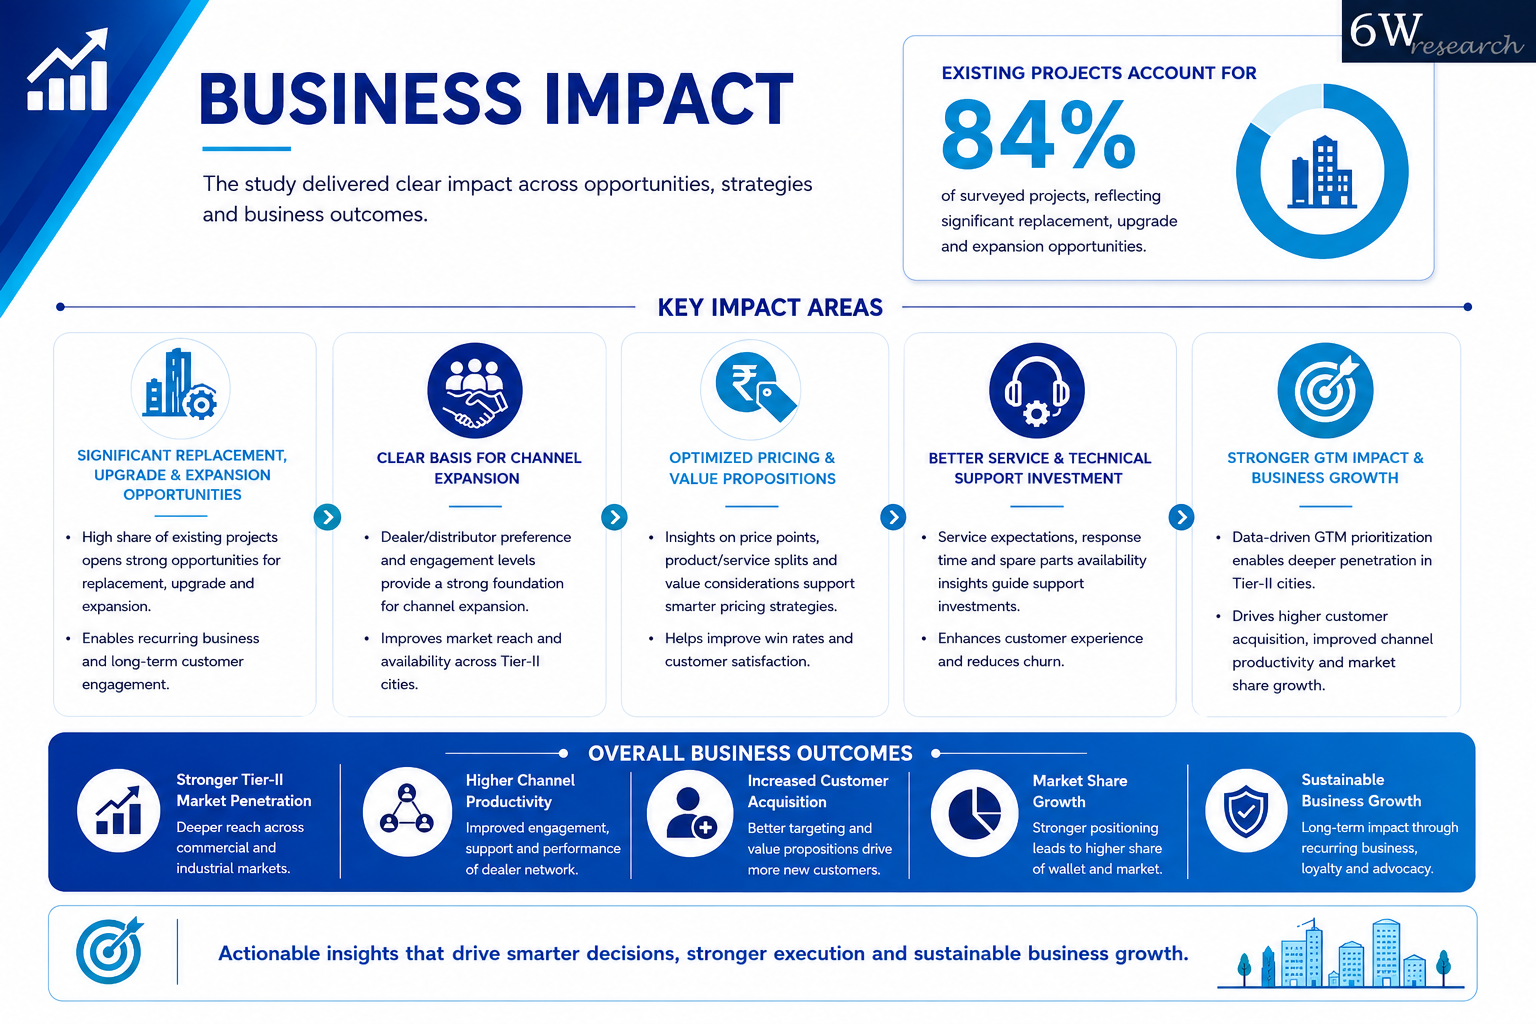
84% of surveyed projects were on existing sites, not new ones — which means there's a real runway for replacement, upgrades, and expansion work. Combined with what we learned about dealer and distributor preferences and service needs, this gives a clear picture for expanding the distribution channel, setting pricing, and where to put technical support and GTM effort. It also backs up the case for going harder on Tier-II penetration, distribution reach, customer acquisition, and market share.


