Why Do Customers Switch Brands — and How Can They Be Won Back?
India Tractor Market – Lost Case Analysis
Objective
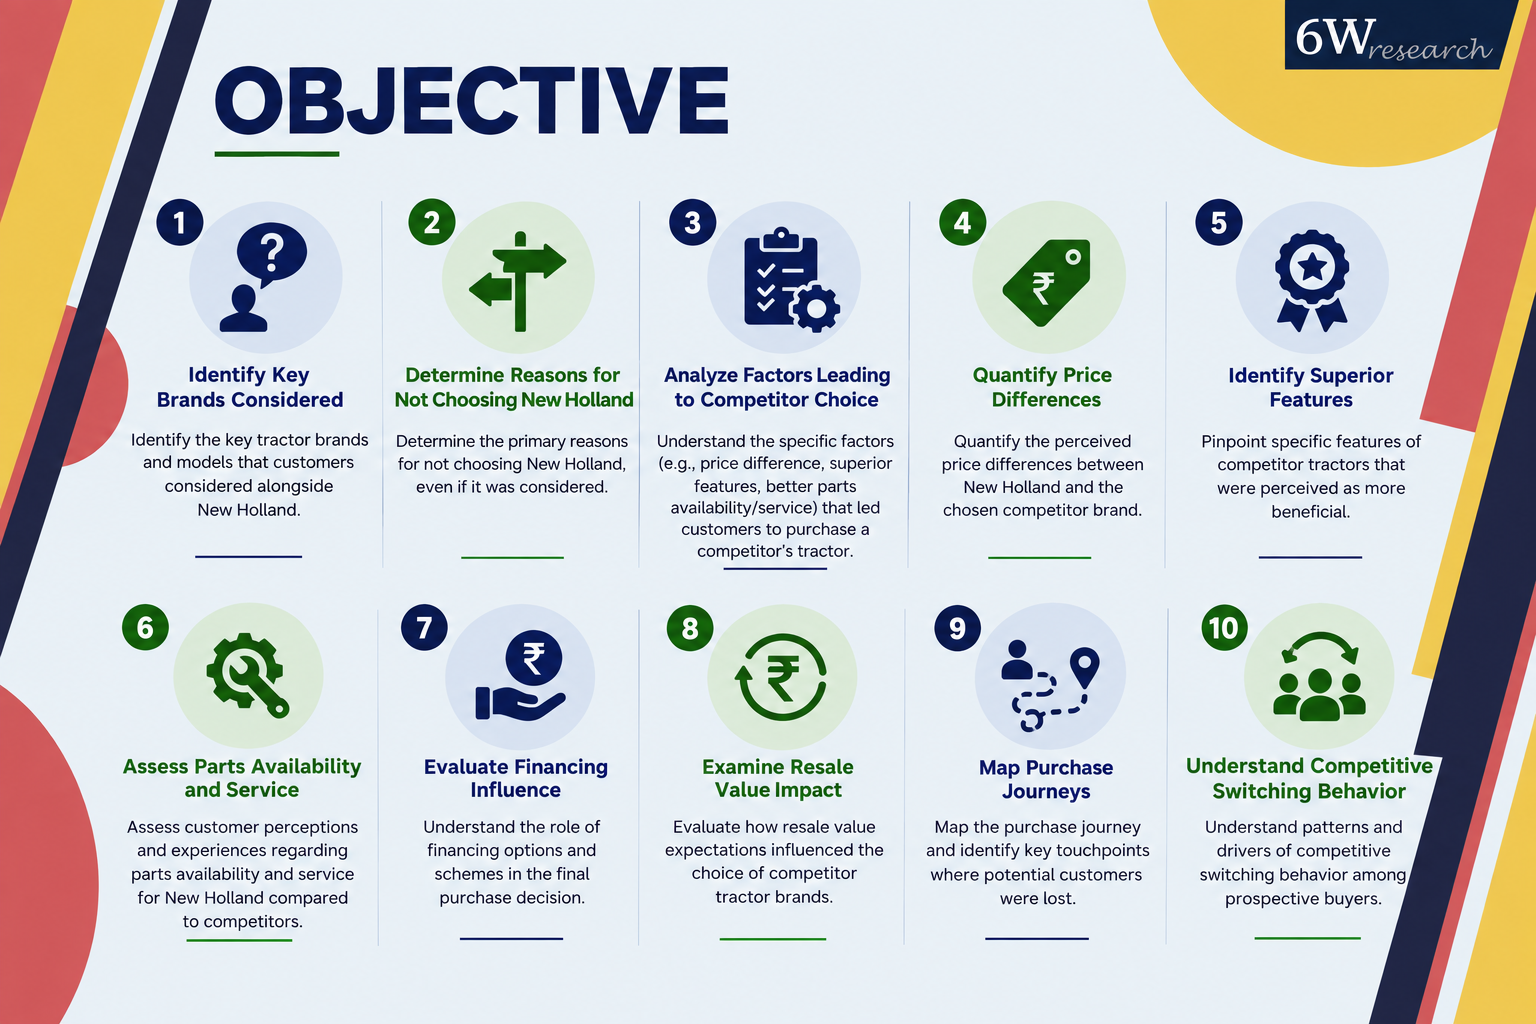
The objective was to determine the reasons why prospective tractor buyers considered a particular brand but ultimately opted for a competing brand. The study mainly focused on the precise points at which potential customers were lost, including pricing, product performance, dealer interaction, after-sales service, financing, resale value, purchase journeys, discount expectations, and competitive switching behavior.
Business Challenge
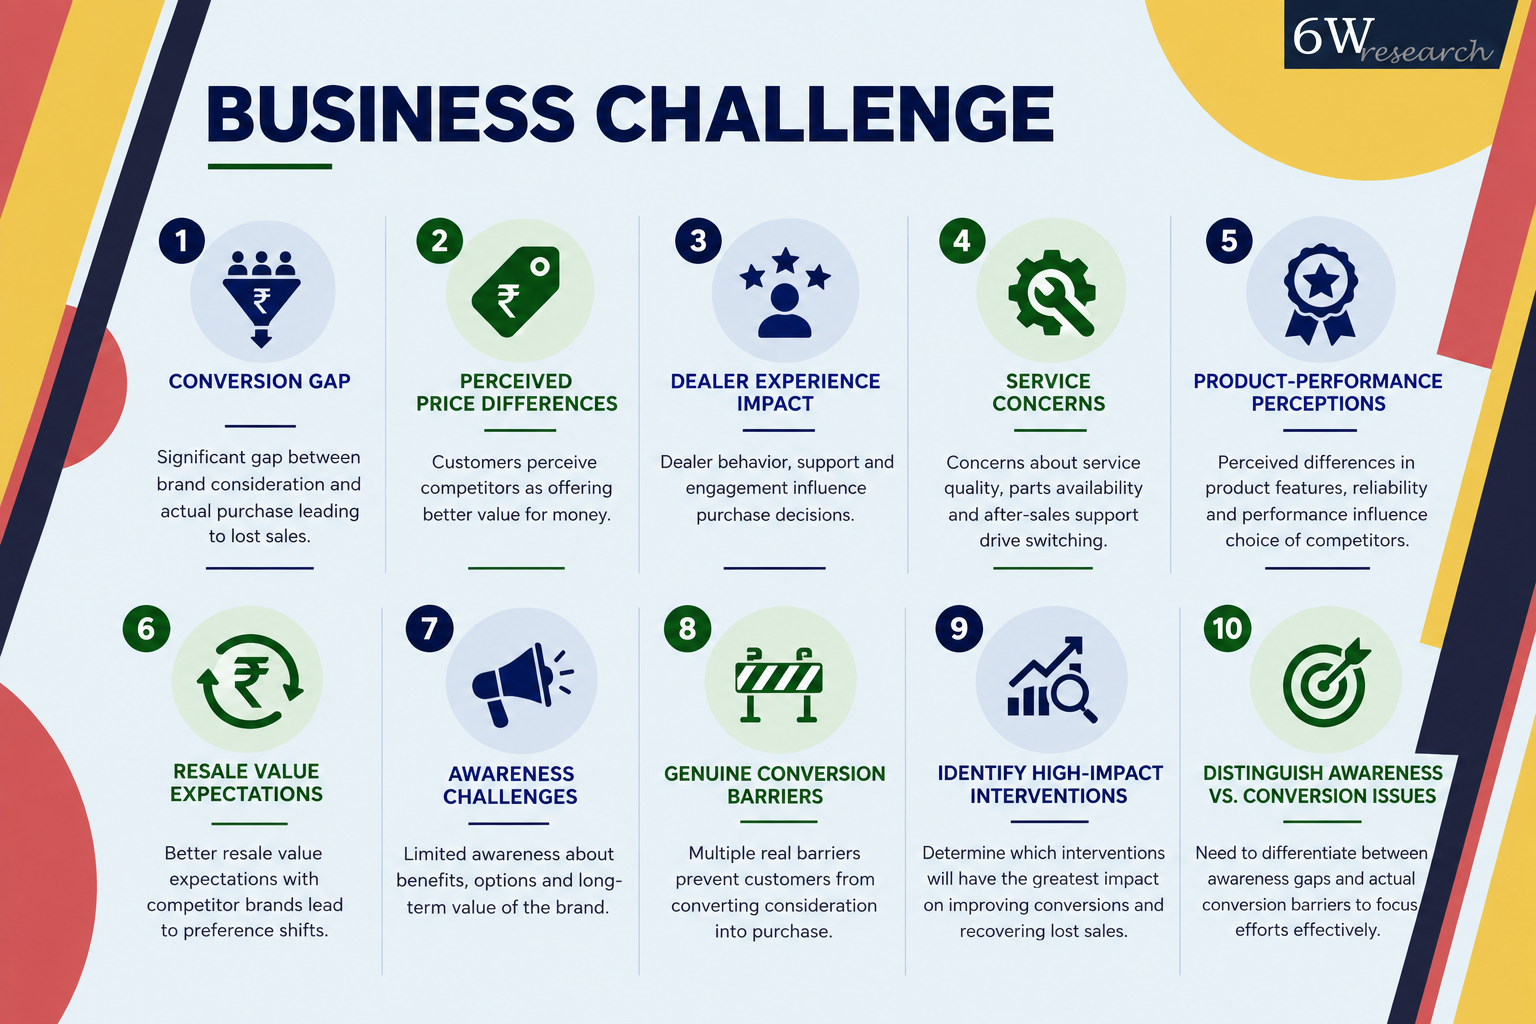
The major challenge was the conversion gap between brand consideration and actual purchase. The business required to differentiate between awareness problems and genuine conversion restrictions and determine which interventions would have the maximum effect on lost-sales recovery. • Customers who are actively switching to competitors based on price differences, dealer occurrence, product-performance perceptions, service concerns and resale expectations.
How We Did It
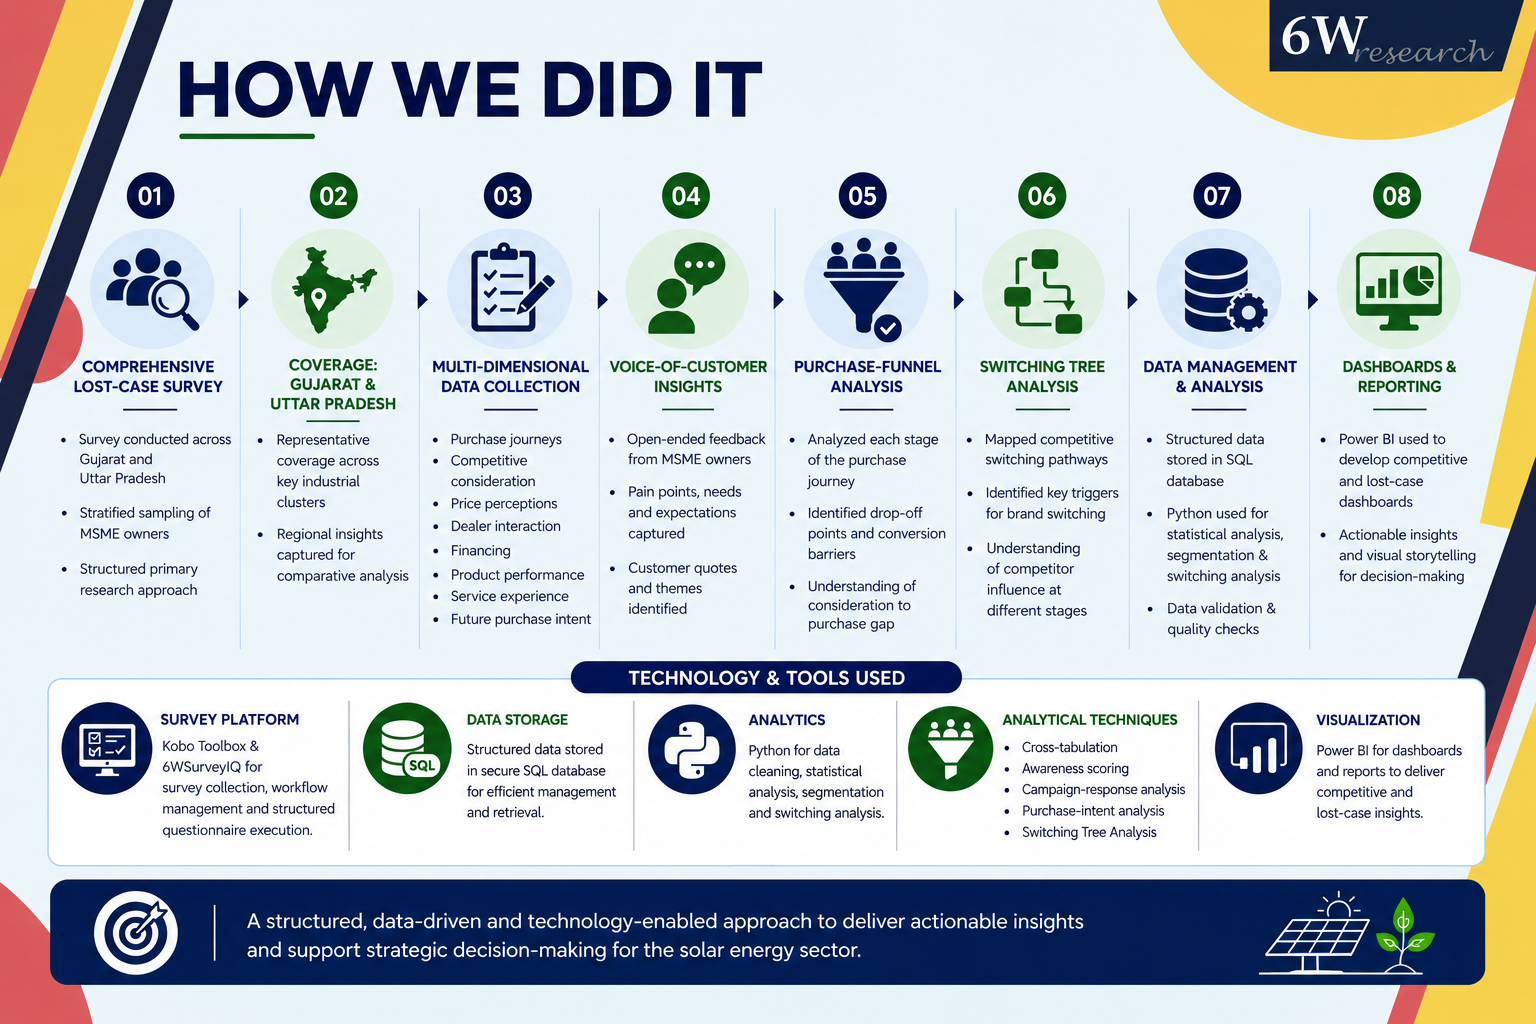
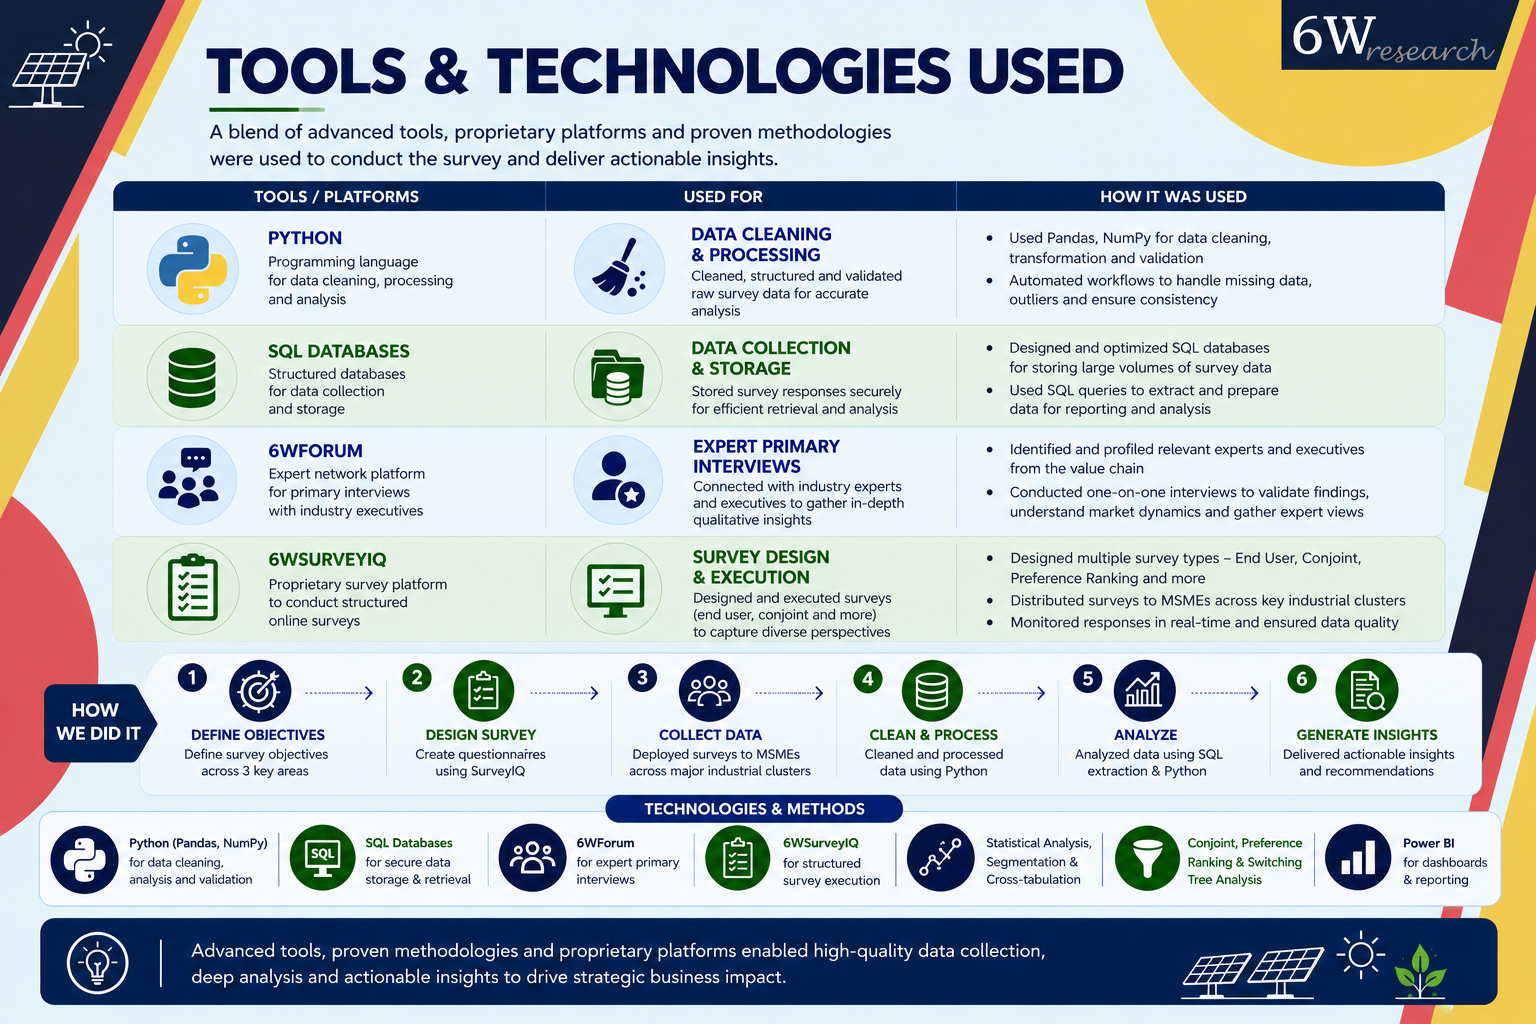
We ran a detailed lost-case analysis across Gujarat and Uttar Pradesh, covering 500 respondents total — 300 from Gujarat, 200 from UP — spanning the 31–40 HP, 41–50 HP and above-50 HP tractor categories. Using structured primary research, we traced the entire purchase journey from initial brand awareness through consideration, evaluation, purchase intention and final purchase, which let us pinpoint exactly where and why people were dropping off. We looked closely at which brands and models respondents considered versus what they actually bought, and why they didn't go with the focal brand — covering price, product features, sales and dealer interactions, financing, after-sales service, market presence and resale value. We also benchmarked the focal brand against whichever competitor tractor was actually purchased, comparing sales experience, product performance, service and overall value. Purchase-funnel analysis let us quantify exactly how much leakage happened at each stage, and the lost-case work helped isolate the main reasons behind switching or non-conversion. We layered in Voice-of-Customer feedback and verbatim responses to capture farmers' actual motivations and concerns — affordability, product fit, dealer responsiveness, service, financing and resale value. All of this was further broken down by geography and horsepower category to spot regional and category-specific differences. In the end, findings were organized into clear, actionable themes — market and value recalibration, service and operational excellence, and brand/local penetration — moving beyond just "why we lost the customer" to specific interventions that could actually improve conversion going forward.
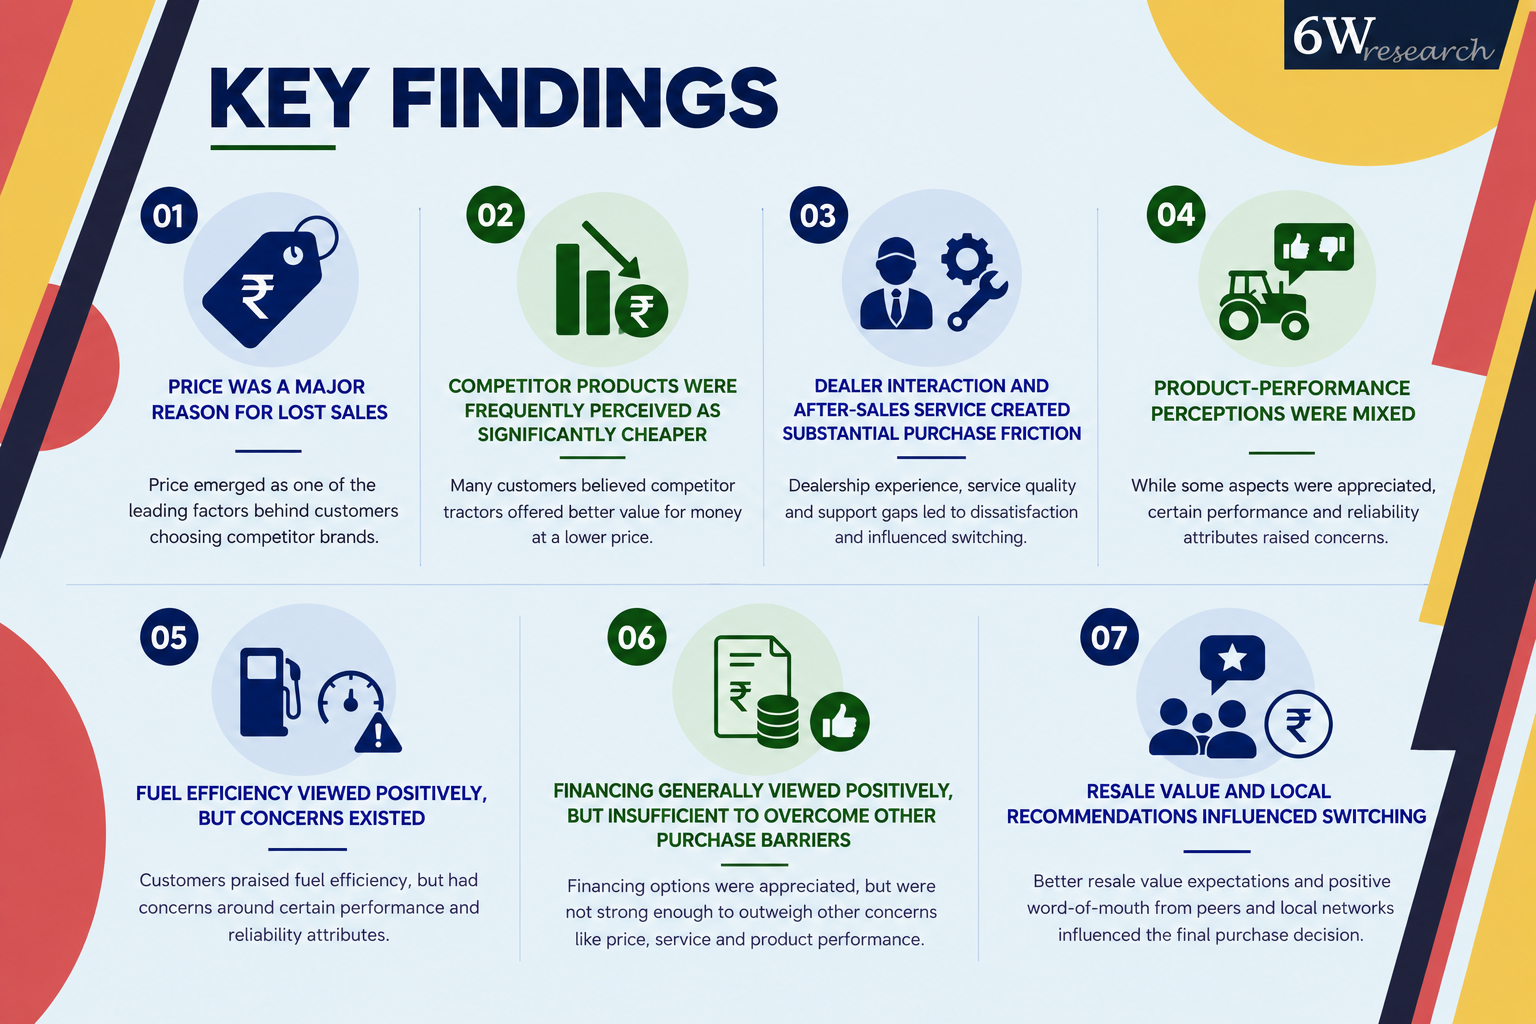
Key Findings
- Price was a major reason for lost sales.
- Competitor products were frequently perceived as significantly cheaper.
- Dealer interaction and after-sales service created substantial purchase friction.
- Product-performance perceptions were mixed.
- Fuel efficiency was viewed positively, while concerns existed around certain performance and reliability attributes.
- Financing was generally viewed positively but was insufficient to overcome other purchase barriers.
- Resale value and local recommendations also influenced switching.
Findings
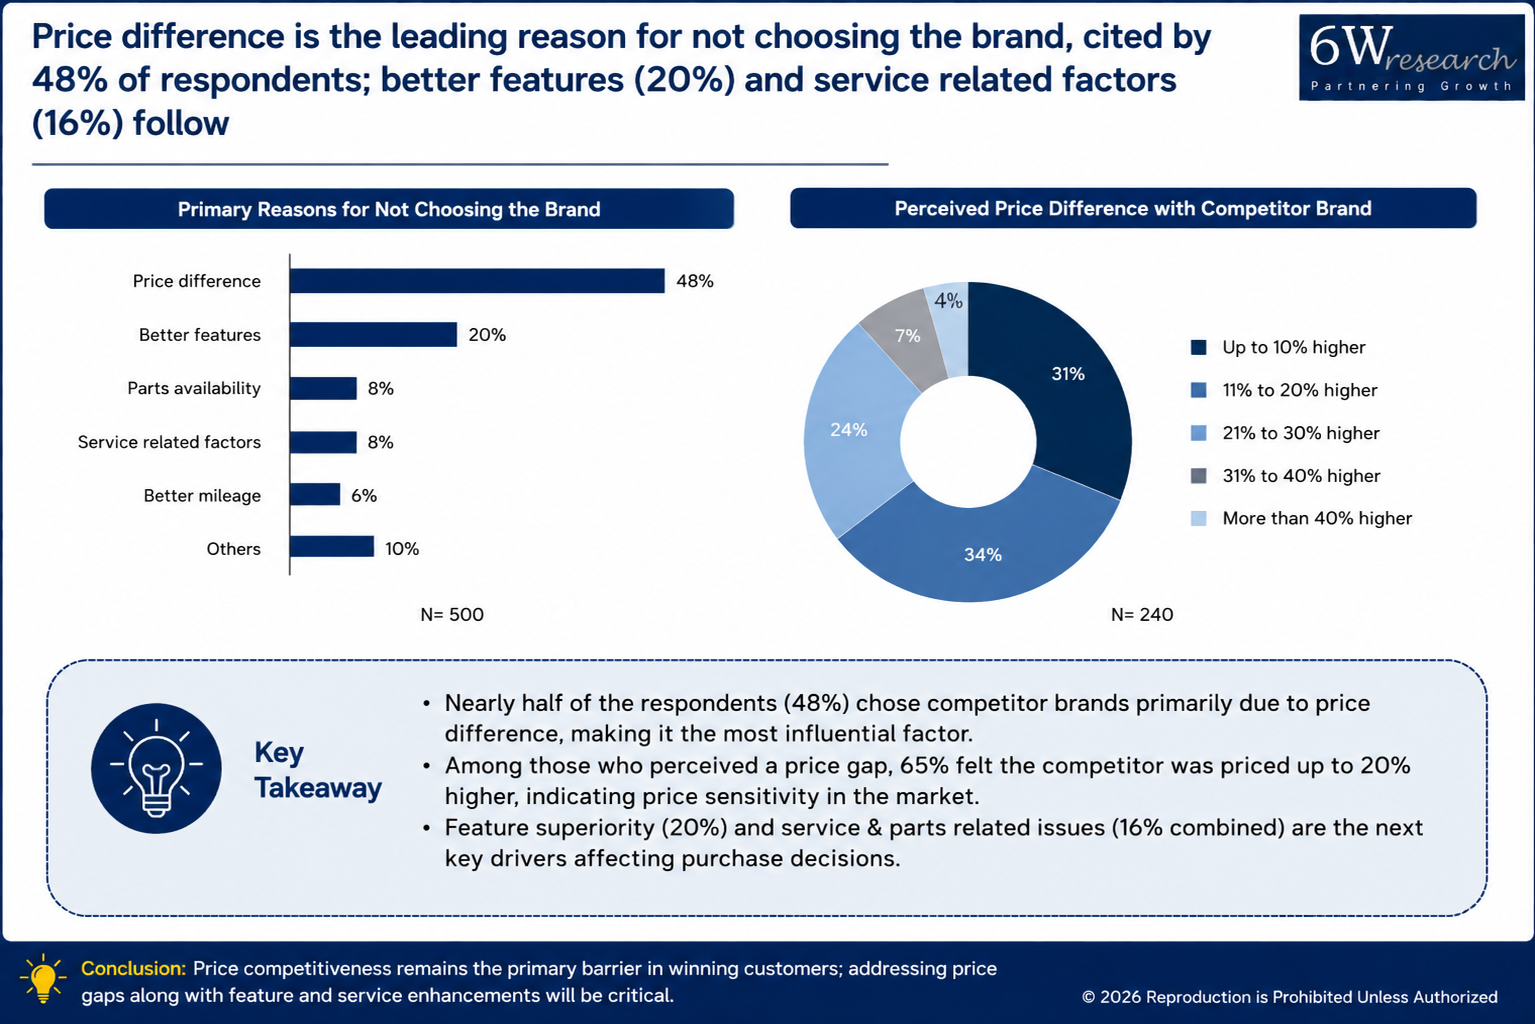
The real problem here isn't awareness — it's getting people through the funnel. Starting from 100% awareness, it drops to 66% at consideration, then 43% at evaluation, and just 30% by purchase intention. So, people are entering the consideration set fine, but something's chipping away at their confidence as they compare price and value more closely. Price came up as the top reason people didn't choose the brand (38%), followed by product concerns (27%) and low local presence (7%). Customers pegged the price gap at roughly ₹50,000 to ₹1 lakh versus competing tractors, and competitor discounts only sharpened that perception. Product evaluation added more friction too — issues around features, performance, gearbox, lift, oil leakage and PTO came up repeatedly. It's worth noting the product wasn't rejected outright — people did acknowledge things like mileage and fuel efficiency as strengths. So the sale is often lost right at the point where general interest turns into a detailed check of whether the tractor is actually worth it, functionally and financially.
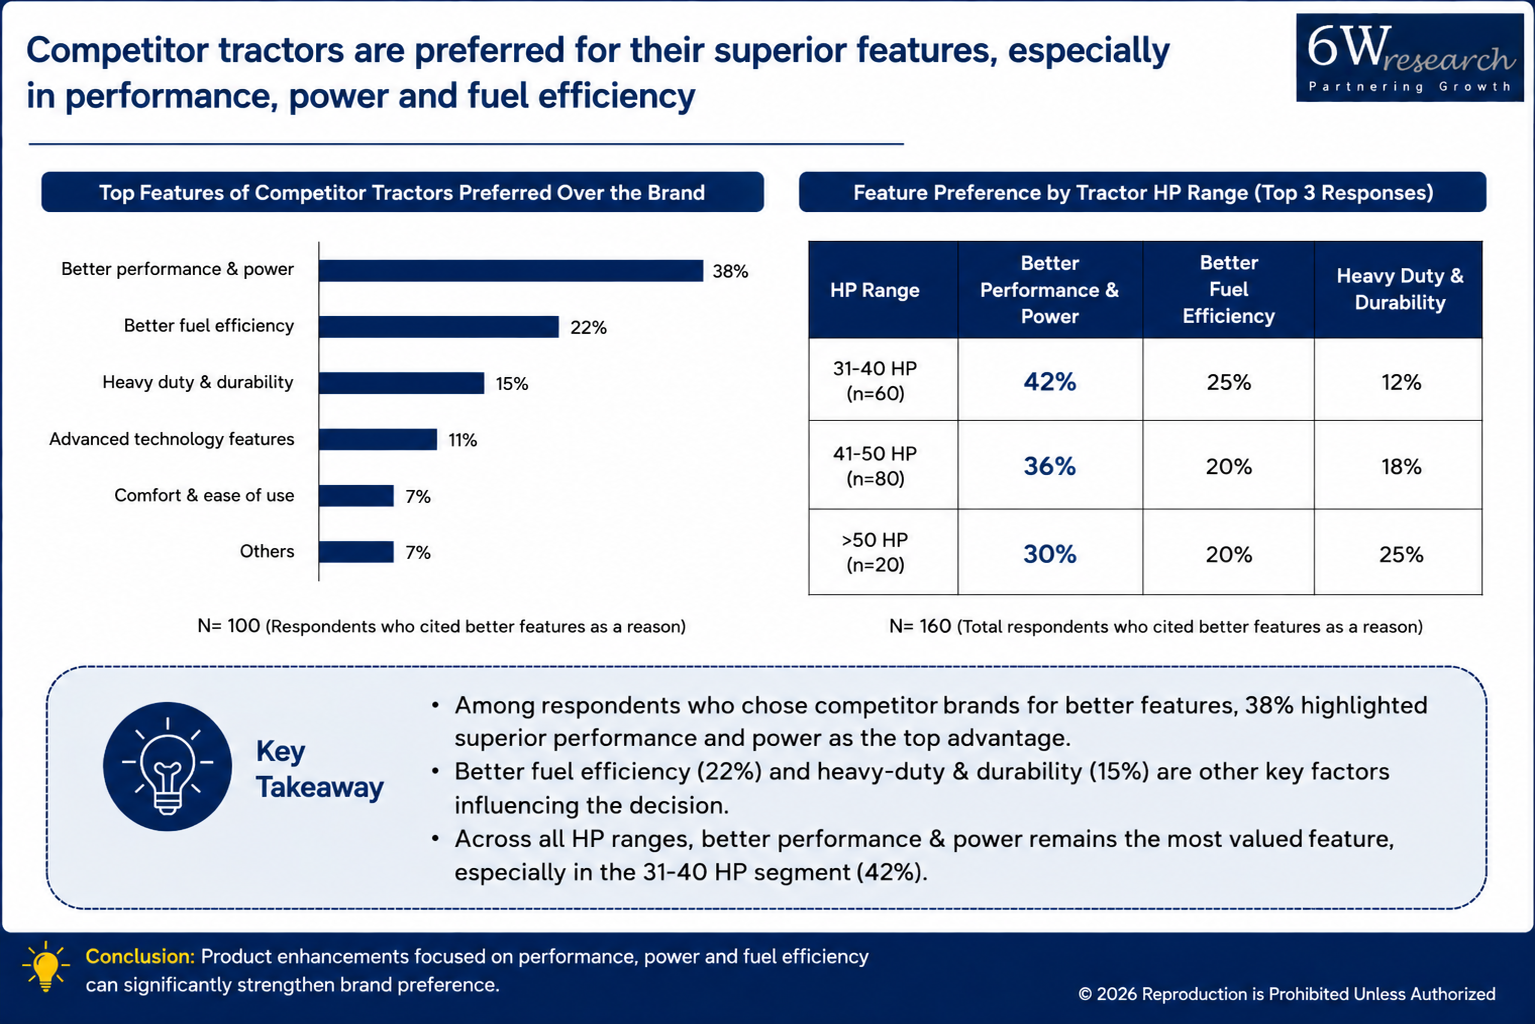
Dealer and sales-process issues made up only about 5% of the primary reasons customers gave for switching, but dig into the purchase journey and it's clear those friction points — slow responses, poor negotiation experience, financing hassles — mattered a lot more than that number suggests. Customers flagged weak dealer responsiveness, limited local presence, and thin after-sales assurance as recurring frustrations. Concerns about spare-parts availability and service responsiveness reinforced the sense that post-purchase reliability isn't an afterthought — it's part of the decision itself. Competitors, meanwhile, benefited from stronger local trust and word-of-mouth, plus tangible discounts or bundled offers that gave them an edge at the negotiation table. So lost sales here aren't really a pricing story — they're the result of several things breaking down together: affordability, product value, dealer engagement, service confidence, and social proof, each reinforcing the next as the customer gets closer to buying.
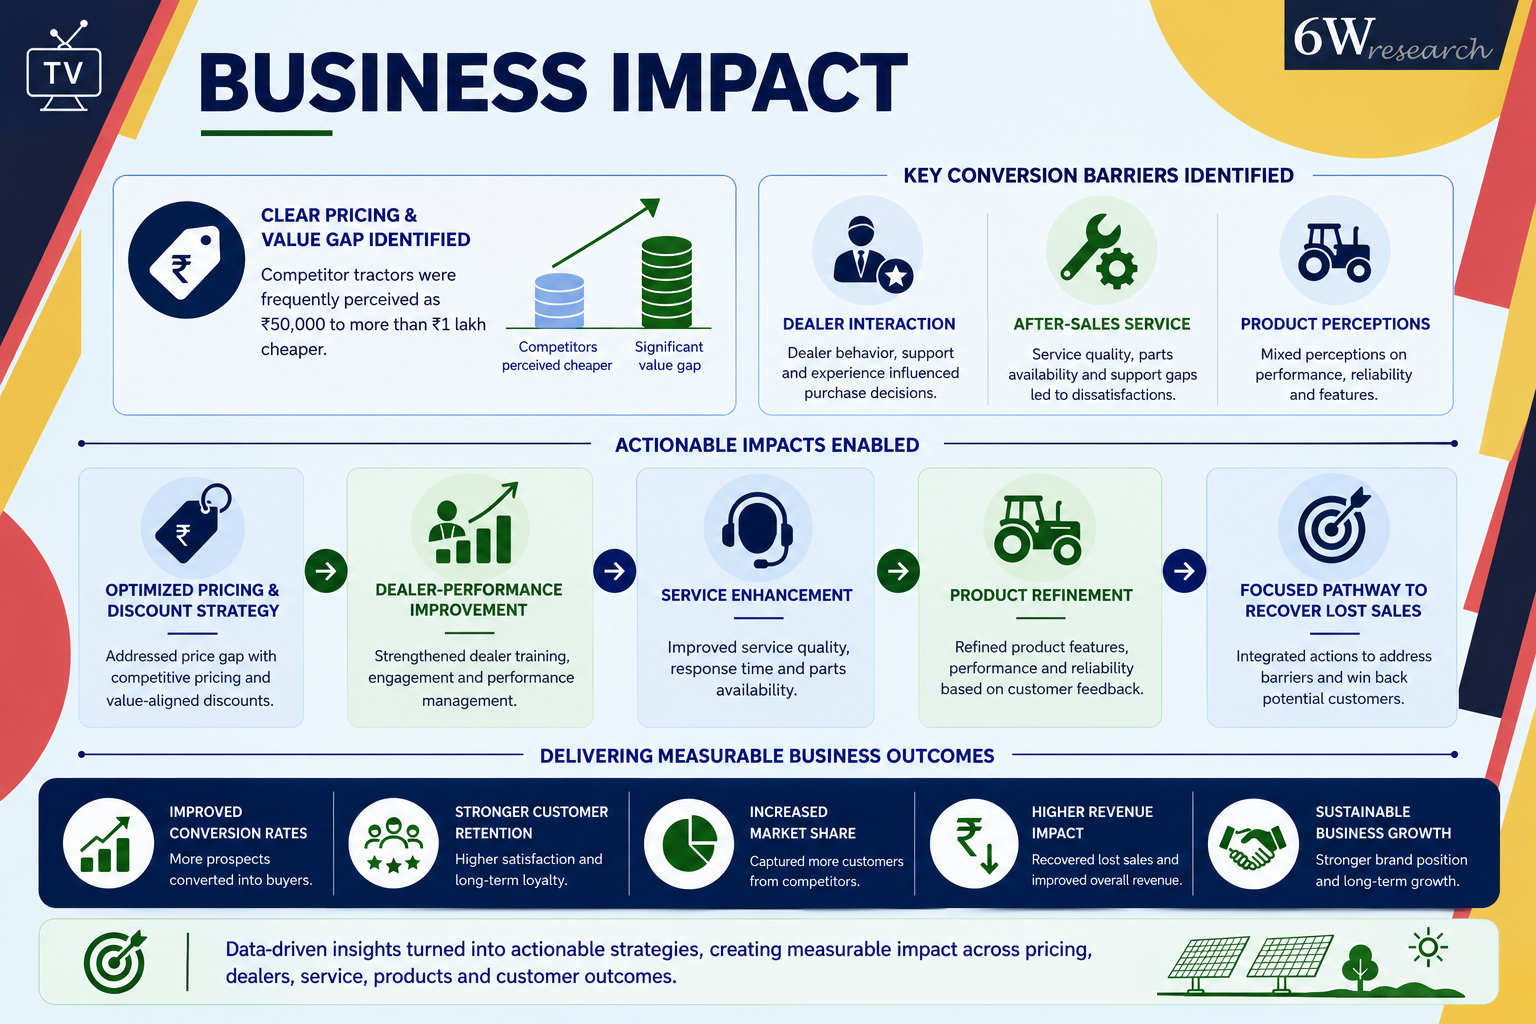
Business Impact
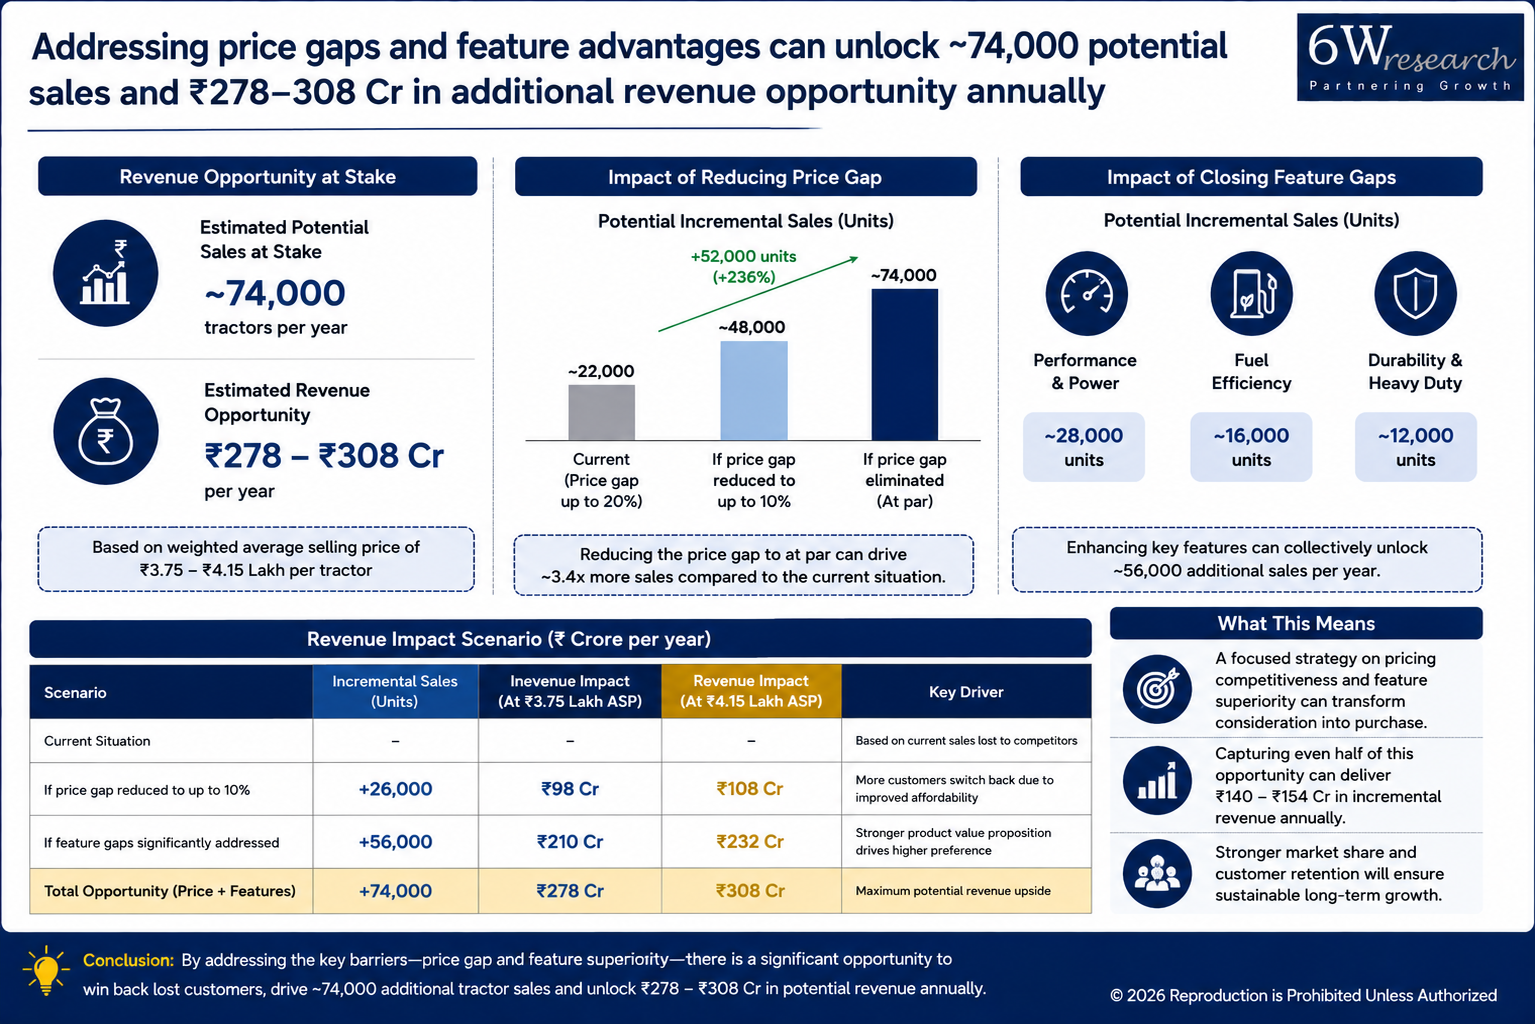
Competitor tractors are priced anywhere from ₹50,000 to over ₹1 lakh below ours — a gap that's hard to ignore. Dealer contact quality, service experience, and how customers perceive the product were the main things holding back conversions. All of this fed into decisions on pricing, discount schemes, dealer efficiency, service quality, and product design — giving us an actual path to recovering sales we've been losing to poor conversion and weak retention.


